SEG - Society of Economic Geologists
SEG - Society of Economic Geologists
SEG - Society of Economic Geologists

Create successful ePaper yourself
Turn your PDF publications into a flip-book with our unique Google optimized e-Paper software.
JULY 2012 • No 90 <strong>SEG</strong> NEWSLETTER 15<br />
deposits in the EGN. These accurate<br />
footprints were then used to train the<br />
neural networks as described in the<br />
next section.<br />
There are, <strong>of</strong> course, also thousands <strong>of</strong><br />
old workings with little or no recorded<br />
production. However, these were not<br />
used for training purposes since the aim<br />
is only to discover further economic<br />
deposits. A study such as this should be<br />
able to distinguish the two. It happens<br />
that several <strong>of</strong> our high ranking targets<br />
lie near abandoned shafts or small diggings;<br />
but the majority <strong>of</strong> such old<br />
workings are not found to be favorable.<br />
DATA MINING<br />
Contour<br />
interval<br />
20 m<br />
Eastern<br />
Goldfields<br />
North<br />
Bronzewing<br />
Gold Mine<br />
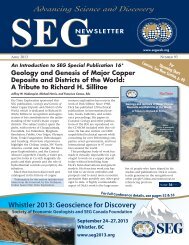
Most <strong>of</strong> the known<br />
deposits are open<br />
pit and are visible<br />
from space.<br />
The upper image is<br />
from Google Earth.<br />
The lower image is<br />
from SRTM Radar.<br />
600 m<br />
FIGURE 7. Google Earth image <strong>of</strong> Bronzewing<br />
gold mine.<br />
The data mining process used for this<br />
study is based on probabilistic modeling<br />
with neural networks and is described in<br />
greater detail in Barnett and Williams<br />
(2006, 2008).<br />
The primary layers <strong>of</strong> exploration data<br />
used as input to the neural networks<br />
were gravity and magnetics, lithology<br />
and structure, radiometrics and biogeochemistry.<br />
However, there is little meaning<br />
in a single-point geophysical, or for<br />
that matter, geological reading. It is the<br />
pattern around a given station that is<br />
important. Such patterns can be represented<br />
by taking the derivatives <strong>of</strong> the<br />
primary data—for example, gravity—and<br />
inputting these as well to the neural<br />
networks. For completeness, it is necessary<br />
to take the horizontal, vertical, and<br />
cross-derivatives, and to include both<br />
first-and second-order terms. This results<br />
in nine extra secondary layers derived<br />
from each primary layer. Similarly, it is<br />
necessary to take account <strong>of</strong> proximity<br />
to geological contacts and structures,<br />
and <strong>of</strong> their strikes. The total number <strong>of</strong><br />
layers assembled for this project came<br />
to over 250, representing about 15 Gb<br />
<strong>of</strong> gridded data files.<br />
Before embarking on a full integration<br />
<strong>of</strong> the data, it can be instructive to<br />
examine individual data sets, to help de -<br />
termine which are contributing most to<br />
the final target map. Some data sets are<br />
evidently more informative than others<br />
in relation to economic gold occurrence,<br />
and the statistical approach allows such<br />
differences to be quantified. In the EGN<br />
study, biogeochemistry and geological<br />
structure prove, individually, to be the<br />
most relevant data sets, followed closely<br />
by gravity and lithology. Radiometric<br />
data come next, with magnetic data<br />
being the least relevant. Nonetheless, a<br />
data set may be only moderately relevant<br />
on its own, but can make a worthwhile<br />
contribution in combination with<br />
others. The results shown below are<br />
based on a combination <strong>of</strong> all the data.<br />
Discussion <strong>of</strong> results<br />
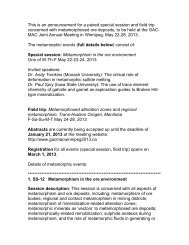
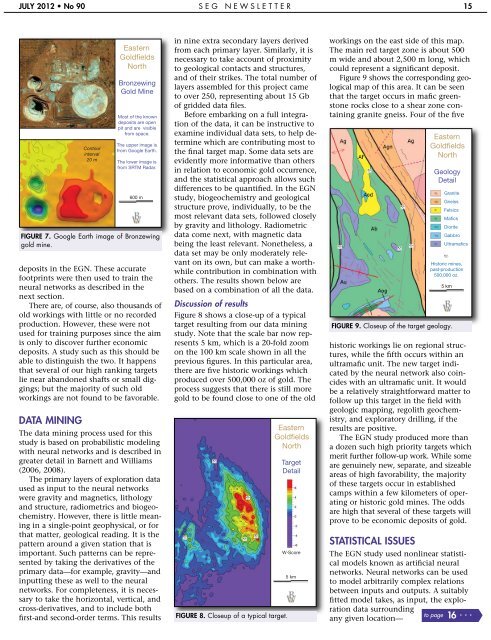
Figure 8 shows a close-up <strong>of</strong> a typical<br />
target resulting from our data mining<br />
study. Note that the scale bar now represents<br />
5 km, which is a 20-fold zoom<br />
on the 100 km scale shown in all the<br />
previous figures. In this particular area,<br />
there are five historic workings which<br />
produced over 500,000 oz <strong>of</strong> gold. The<br />
process suggests that there is still more<br />
gold to be found close to one <strong>of</strong> the old<br />
FIGURE 8. Closeup <strong>of</strong> a typical target.<br />
Eastern<br />
Goldfields<br />
North<br />
Target<br />
Detail<br />
W-Score<br />
5 km<br />
workings on the east side <strong>of</strong> this map.<br />
The main red target zone is about 500<br />
m wide and about 2,500 m long, which<br />
could represent a significant deposit.<br />
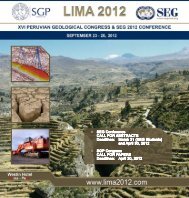
Figure 9 shows the corresponding geological<br />
map <strong>of</strong> this area. It can be seen<br />
that the target occurs in mafic greenstone<br />
rocks close to a shear zone containing<br />
granite gneiss. Four <strong>of</strong> the five<br />
historic workings lie on regional structures,<br />
while the fifth occurs within an<br />
ultramafic unit. The new target indicated<br />
by the neural network also coincides<br />
with an ultramafic unit. It would<br />
be a relatively straightforward matter to<br />
follow up this target in the field with<br />
geologic mapping, regolith geochemistry,<br />
and exploratory drilling, if the<br />
results are positive.<br />
The EGN study produced more than<br />
a dozen such high priority targets which<br />
merit further follow-up work. While some<br />
are genuinely new, separate, and sizeable<br />
areas <strong>of</strong> high favorability, the majority<br />
<strong>of</strong> these targets occur in established<br />
camps within a few kilometers <strong>of</strong> operating<br />
or historic gold mines. The odds<br />
are high that several <strong>of</strong> these targets will<br />
prove to be economic deposits <strong>of</strong> gold.<br />
STATISTICAL ISSUES<br />
Eastern<br />
Goldfields<br />
North<br />
Geology<br />
Detail<br />
Granite<br />
Gneiss<br />
Felsics<br />
Mafics<br />
Diorite<br />
Gabbro<br />
Ultramafics<br />
Historic mines,<br />
past-production<br />
500,000 oz.<br />
5 km<br />
FIGURE 9. Closeup <strong>of</strong> the target geology.<br />
The EGN study used nonlinear statistical<br />
models known as artificial neural<br />
networks. Neural networks can be used<br />
to model arbitrarily complex relations<br />
between inputs and outputs. A suitably<br />
fitted model takes, as input, the exploration<br />
data surrounding<br />
any given location—<br />
to page 16 ...