SEG - Society of Economic Geologists
SEG - Society of Economic Geologists
SEG - Society of Economic Geologists

You also want an ePaper? Increase the reach of your titles
YUMPU automatically turns print PDFs into web optimized ePapers that Google loves.
14 <strong>SEG</strong> NEWSLETTER No 90 • JULY 2012<br />
... from 13<br />
A Radical Approach to Exploration: Let the Data Speak for Themselves! (Continued)<br />
radiometrics, which are normally considered<br />
a shallow-penetrating tool, are<br />
clearly reflecting the bedrock geology<br />
and geochemistry through the surface<br />
weathering. Presumably the regolith has<br />
been in place without much change for<br />
millions <strong>of</strong> years, which has allowed<br />
time for key elements to trickle up to<br />
the surface.<br />
Geochemistry<br />
Various forms <strong>of</strong> geochemistry were<br />
considered for inclusion in the study.<br />
These included lithogeochemistry from<br />
the Australian National Geochemistry<br />
Database (Budd et al., 2002), as well as<br />
hydrogeochemistry and biogeochemistry<br />
from two recent Minerals and<br />
Energy Research Institute <strong>of</strong> Western<br />
Australia (MERIWA) projects (Gray et<br />
al., 2009; Reid et al., 2010).<br />
Lithogeochemistry was found to be<br />
too sparsely sampled to be useful. Also,<br />
the samples tended to be concentrated<br />
in and around the pits <strong>of</strong> the gold and<br />
nickel deposits with big (50 km) gaps in<br />
between. This resulted in a strong correlation<br />
with the known mineralization<br />
but made the data <strong>of</strong> little practical use<br />
as a predictor. The hydrogeochemistry<br />
was more evenly sampled from the<br />
numerous water bores in this area, but<br />
it had a very weak correlation with the<br />
known gold deposits. This may be due<br />
to transport <strong>of</strong> elements in the groundwater,<br />
reportedly as much as 10 km in<br />
the direction <strong>of</strong> flow, and also perhaps<br />
because <strong>of</strong> the extremely low analytic<br />
levels <strong>of</strong> the various elements.<br />
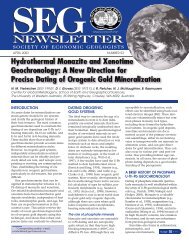
The biogeochemistry, on the other<br />
hand, which was based on sampling the<br />
leaves <strong>of</strong> mulga trees close to the boreholes<br />
tested in the hydrogeochemistry<br />
survey, proved to have a very good correlation<br />
with the known gold deposits.<br />
A total <strong>of</strong> 56 elements, <strong>of</strong> which just<br />
one example (gold) is shown in Figure<br />
6, were gridded and passed to the data<br />
mining process. The only limitation <strong>of</strong><br />
the biogeochemistry is that the survey<br />
did not cover the entire area <strong>of</strong> our<br />
EGN study. This meant, <strong>of</strong> course, that<br />
target predictions incorporating these<br />
data could only be made where there<br />
was complete data coverage.<br />
Landsat<br />
A data set that is readily obtainable in<br />
any part <strong>of</strong> the world is the Landsat<br />
Thematic Mapper (TM). In some arid<br />
terranes, like the Walker Lane <strong>of</strong> Nevada<br />
No data<br />
collected<br />
Mulga trees<br />
Eastern<br />
Goldfields<br />
North<br />
Biogeochem<br />
Gold<br />
ppb Au<br />
1 <strong>of</strong> 56 elements<br />
100 km<br />
FIGURE 6. Biogeochemistry gold image.<br />
and the Altiplano <strong>of</strong> Chile, these data<br />
are highly useful for directly mapping<br />
mineral alteration systems. We therefore<br />
acquired these data in the hope that they<br />
might also be helpful in the Eastern<br />
Goldfields. In this region, however, the<br />
TM data were found to be merely reflecting<br />
the regolith. Furthermore, the TM<br />
data are extremely sensitive to man-made<br />
disturbances. The known gold (and nickel)<br />
mines and their associated waste dumps<br />
stand out very conspicuously in all the<br />
TM bands. Experiments quickly showed<br />
that these data were not discriminating<br />
at detecting mineralization and therefore<br />
could not be used for this purpose<br />
in the EGN.<br />
Topography<br />
Another data set that is widely available<br />
is the Shuttle Radar Topography Mission<br />
(SRTM) global elevation data. These data<br />
were collected during a single 11-day<br />
space mission in February 2000, and now<br />
provide high-resolution coverage <strong>of</strong> 80%<br />
<strong>of</strong> the earth’s surface. In many parts <strong>of</strong><br />
the world the terrain map can be a useful<br />
indicator <strong>of</strong> local structure and lithology.<br />
Linear ridge crest and drainage patterns<br />
may indicate faults, while circular<br />
patterns may indicate diapirs. Siliceous<br />
rocks tend to resist weathering and form<br />
high ground. In this area, however, the<br />
terrain is largely reflecting the regolith<br />
and does not tell us much about the<br />
bedrock geology. Also, the pits tend to<br />
form distinctive, conical-shaped holes in<br />
the terrain. When trained to correlate<br />
the known gold deposits with the SRTM<br />
data, the data mining process promptly<br />
picked out all the nickel pits! Although<br />
this was a convincing demonstration <strong>of</strong><br />
the power <strong>of</strong> the data mining process, it<br />
was hardly useful in predicting other, as<br />
yet undisturbed, gold deposits.<br />
Known deposits<br />
The Geological Survey <strong>of</strong> Western<br />
Australia produces an annually updated<br />
map <strong>of</strong> all the known deposits in the<br />
state (Cooper et al., 2007). However, in<br />
common with the data in the national<br />
OZMIN database (Ewers et al., 2002), it<br />
is not sufficiently accurate for data mining<br />
purposes. Many <strong>of</strong> the deposits are<br />
located only approximately, sometimes<br />
up to a couple <strong>of</strong> kilometers away from<br />
the actual mine site. In order to work at<br />
a 100 m grid interval, it is necessary to<br />
know the precise location or actual<br />
footprints <strong>of</strong> the deposits.<br />
Fortunately, most <strong>of</strong> the major listed<br />
deposits are shallow enough to have<br />
been exploited by open pit. In this semiarid<br />
terrain with its minimal, shrubby<br />
vegetation, the open pits show up very<br />
clearly from space. The pits thus reveal<br />
the precise location <strong>of</strong> the gold mineralization<br />
as the miners were generally<br />
careful not to move much barren rock<br />
except as necessary laybacks to the pits.<br />
Figure 7 shows a satellite image <strong>of</strong><br />
the Bronzewing gold mine downloaded<br />
from Google Earth. The scene is dominated<br />
by the tailings to the east, but<br />
two open pits can clearly be seen on<br />
the western side <strong>of</strong> this image. The<br />
Discovery Pit is to the south and the<br />
smaller Central Pit is to the north.<br />
Such Google Earth (GE) images represent<br />
a mosaic <strong>of</strong> many small images<br />
tied together by control points on the<br />
ground. Most <strong>of</strong> these were found to be<br />
quite accurate, but one was conspicuously<br />
misregistered by several hundred<br />
meters. Another way <strong>of</strong> mapping the pits<br />
is to use the SRTM elevation data, which<br />
are precisely positioned. We therefore<br />
primarily used the SRTM data, supplemented<br />
by the GE data in the case <strong>of</strong> a<br />
few recent discoveries that postdate the<br />
Shuttle Mission in 2000.<br />
We also drew on company reports<br />
for the locations <strong>of</strong> a few underground<br />
de posits, such as the Darlot Centenary<br />
mine, which did not commence operations<br />
as open pits. In this fashion, it<br />
was possible to locate and digitize the<br />
surface projections <strong>of</strong> 240 discrete gold