SEG - Society of Economic Geologists
SEG - Society of Economic Geologists
SEG - Society of Economic Geologists

Create successful ePaper yourself
Turn your PDF publications into a flip-book with our unique Google optimized e-Paper software.
JULY 2012 • No 90 <strong>SEG</strong> NEWSLETTER 13<br />
Gold endowment<br />
The known gold endowment for the<br />
EGN study area is over 70 Moz, while<br />
within the Eastern Goldfields as a whole<br />
it is around 200 Moz. Several world-class<br />
deposits lie outside to the south <strong>of</strong> the<br />
EGN study area. By far the largest is the<br />
Super Pit at Kalgoorlie, which alone contains<br />
more than 68 Moz. Other notable<br />
deposits not covered by this study are<br />
St Ives, Norseman, Kanowna Belle, New<br />
Celebration, and Mt Charlotte. The EGN<br />
study area nonetheless contains 15<br />
known gold deposits with over one Moz<br />
<strong>of</strong> gold, including among them Sunrise<br />
Dam, Wallaby, Sons <strong>of</strong> Gwalia, Agnew,<br />
Jundee, Granny Smith, and Tarmoola;<br />
and there are another 50 deposits with<br />
recorded production <strong>of</strong> over 30,000 oz.<br />
EXPLORATION DATA<br />
Before commencing the data mining<br />
study, we first had to assemble and<br />
carefully collimate all the available<br />
exploration data sets covering the EGN<br />
at a common grid interval. As the data<br />
were generally <strong>of</strong> very high quality, a<br />
grid interval <strong>of</strong> 100 m was chosen for<br />
this purpose.<br />
Geology<br />
The geological map that was used for this<br />
study came from Geoscience Australia<br />
and was published by Liu et al. (2000).<br />
This is a 1:500,000 scale solid geology<br />
map based on historic 1:100,000 and<br />
1:250,000 scale outcrop mapping combined<br />
with interpretation <strong>of</strong> recent airborne<br />
geophysical, gravity, and Landsat<br />
TM data. Although this map has only<br />
been released in paper form and as an<br />
Adobe pdf document, the authors (Alan<br />
Whitaker, pers. commun., 2007) were<br />
kind enough to provide the map in a<br />
digital GIS format that could be input<br />
to our data mining study.<br />
This was found to be a highly suitable<br />
map for the purposes <strong>of</strong> this study.<br />
In addition to lithology, the map shows<br />
structures in the form <strong>of</strong> faults (major<br />
and minor), shear zones (containing<br />
strongly deformed rocks), and folds<br />
(antiforms and synforms). The lithologic<br />
information was represented in a form<br />
that captured both individual formations<br />
and proximity to contacts between<br />
the various formations. The five distinct<br />
forms <strong>of</strong> structure were all separately<br />
represented to our data mining study.<br />
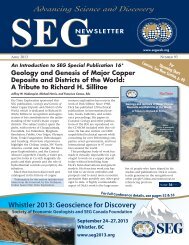
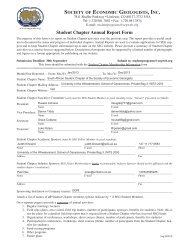
Magnetic surveys<br />
Figure 3 shows the aeromagnetic map <strong>of</strong><br />
the area, which was also obtained from<br />
FIGURE 3. Magnetic intensity image.<br />
Eastern<br />
Goldfields<br />
North<br />
Magnetics<br />
RTP<br />
nanoteslas<br />
100 km<br />
Geoscience Australia (Percival, 2010).<br />
This map was compiled from about 10<br />
modern surveys that had been flown<br />
since the early 1990s. The line spacing <strong>of</strong><br />
these surveys ranged from 200 to 400 m,<br />
and the flying height ranged from 60 to<br />
100 m. The data quality is therefore<br />
extremely good—in fact, much better<br />
than in many other parts <strong>of</strong> the world.<br />
Data were reduced to the pole to<br />
center the anomalies over any causative<br />
magnetic bodies. The data range <strong>of</strong> the<br />
map shown in Figure 3 is over 10,000<br />
nanoteslas, which is unusually high but<br />
not too surprising considering the number<br />
<strong>of</strong> banded iron formations and<br />
granitic intrusions present in this area.<br />
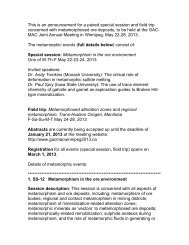
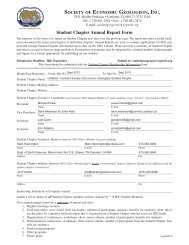
Gravity<br />
Figure 4 shows the gravity map <strong>of</strong> the<br />
area, which was produced from a grid<br />
provided by Geoscience Australia<br />
(Wynne and Bacchin, 2009). The data<br />
range for this map is 800 gravity units<br />
(or 80 milligals). These data had been<br />
collected in many small ground surveys,<br />
starting in the 1950s when sensitive<br />
gravimeters first became available. The<br />
average station spacing in the EGN is<br />
around 4 km, which is adequate for our<br />
purposes. In the next few years, no doubt<br />
a modern airborne gravity survey will be<br />
carried out, which should provide even<br />
better data with more uniform coverage.<br />
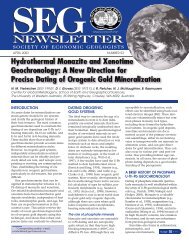
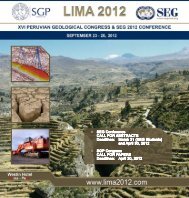
Radiometric studies<br />
The radiometric data used for this project<br />
came from Geoscience Australia,<br />
and were collected in the last 20 years<br />
in conjunction with the aeromagnetic<br />
FIGURE 4. Bouguer gravity image.<br />
Eastern<br />
Goldfields<br />
North<br />
Bouguer<br />
Gravity<br />
gravity-units<br />
100 km<br />
data described above. The data came<br />
from 10 different surveys (Percival,<br />
2010), which have been blended into<br />
separate grids <strong>of</strong> potassium, uranium,<br />
and thorium counts.<br />
Figure 5 shows a ternary K-U-Th<br />
image <strong>of</strong> the radiometric data. It can be<br />
seen that this image correlates nicely<br />
with the geology shown in Figure 2. The<br />
granites are typically high in potassium<br />
and therefore generally map as reddish<br />
colors. And, despite the regolith cover,<br />
the greenstone belts stand out as bluishgreen<br />
zones trending NNW across the<br />
area. This is very encouraging<br />
as it means the 14 to page ...<br />
FIGURE 5. Radiometric ternary image.<br />
Eastern<br />
Goldfields<br />
North<br />
Radiometric<br />
Composite<br />
U<br />
K<br />
Ternary Image<br />
100 km<br />
Th