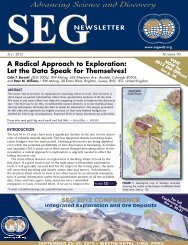
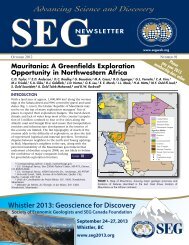
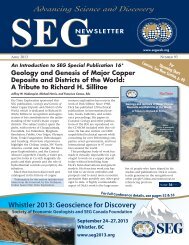
SEG 45 Final_qx4 - Society of Economic Geologists
SEG 45 Final_qx4 - Society of Economic Geologists
SEG 45 Final_qx4 - Society of Economic Geologists

Create successful ePaper yourself
Turn your PDF publications into a flip-book with our unique Google optimized e-Paper software.
24 <strong>SEG</strong> NEWSLETTER No 55 • OCTOBER 2003<br />
<strong>Economic</strong> Geology — An Invited Commentary on Journal Papers<br />
Eric Grunsky<br />
Mineral Resources Division, Geological Survey <strong>of</strong> Canada, 601 Booth St., Ottawa, ON K1A 0E8, Canada<br />
Two Papers on The Use <strong>of</strong> Hyperspectral Airborne-<br />
Satellite Imagery in Mineral Exploration<br />
COMMENTARY<br />
Two recent papers, “Utility <strong>of</strong> high-altitude<br />
infrared spectral data in mineral<br />
exploration: Application to northern<br />
Patagonia Mountains, Arizona,” by<br />
Berger et al. (2003), and “Mapping<br />
hydrothermally altered rocks at Cuprite,<br />
Nevada, using the Advanced<br />
Spaceborne Thermal Emission and<br />
Reflection Radiometer (ASTER), a new<br />
satellite-imaging system,” by Rowan et<br />
al. (2003), make a distinctive mark on<br />
the use <strong>of</strong> airborne and satellite hyperspectral<br />
imaging as an exploration tool.<br />
These two papers deal with imaging<br />
<strong>of</strong> the Earth’s surface using the visible<br />
(0.4 µm) to near infrared (2.5 µm) part<br />
<strong>of</strong> the electromagnetic spectrum to map<br />
various mineral species. Depending on<br />
their structure and molecular bonding,<br />
minerals reflect and absorb the electromagnetic<br />
spectrum in unique ways. A<br />
large group <strong>of</strong> minerals have distinct<br />
electromagnetic signatures that make it<br />
possible to identify them from imaging<br />
systems that map the range <strong>of</strong> the electromagnetic<br />
spectrum between 0.5 and<br />
2.5 µm.<br />
These papers represent two distinct<br />
approaches. The first paper, by Berger et<br />
al., discusses the use <strong>of</strong> the AVIRIS<br />
(Airborne Visible Infrared Imaging<br />
Spectrometer) scanner, which provides<br />
high-resolution reflectance measurements<br />
in the spectral domain (224 channels<br />
between 0.4 and 2.<strong>45</strong> µm) and variable<br />
spatial resolution (20 m), dependent<br />
on aircraft altitude. The second paper, by<br />
Rowan et al., discusses the use <strong>of</strong> the<br />
ASTER satellite scanner, which <strong>of</strong>fers a<br />
limited range <strong>of</strong> spectra at three spatial<br />
resolutions (15, 30, and 90 m). ASTER<br />
measures reflectance radiation in 3<br />
bands within the 0.52- to 0.86-µm range<br />
(visible-near-infrared) at 15-m spatial<br />
resolution, and 6 bands between 1.00<br />
and 2.43 µm (short wave infrared) at 30-<br />
m spatial resolution. Emitted radiation is<br />
measured in 5 bands between 8.125 and<br />
11.650 µm (thermal infrared) with a 90-<br />
m spatial resolution.<br />
The main advantage <strong>of</strong> the AVIRIS<br />
sensor is the level <strong>of</strong> spectral detail,<br />
which provides accurate measurements<br />
<strong>of</strong> reflectance and absorption features <strong>of</strong><br />
minerals that enables detailed mineral<br />
mapping. Its main disadvantages, however,<br />
are the extensive processing<br />
required to make the reflectance spectra<br />
useful, and its limited spatial coverage<br />
and acquisition cost based on programmed<br />
flights. In contrast, the main<br />
advantage <strong>of</strong> the ASTER sensor is that it<br />
measures key portions <strong>of</strong> the visible,<br />
near-infrared, and thermal infrared<br />
spectra <strong>of</strong> minerals for large-scale mapping<br />
projects, whereas its main disadvantage<br />
is that the data represent only<br />
portions <strong>of</strong> the electromagnetic spectrum<br />
and some minerals cannot be distinctively<br />
mapped. In addition, the<br />
lower spatial resolution in the nearand<br />
thermal infrared portions <strong>of</strong> the<br />
spectrum makes it more difficult to map<br />
at detailed scales.<br />
These two papers represent significant<br />
advances in the use <strong>of</strong> these imaging<br />
tools to map out specific mineralogies<br />
related to mineralization processes. One<br />
<strong>of</strong> the challenges mapping minerals<br />
from hyperspectral imagery is the ability<br />
to distinguish different mineral species<br />
that are mixed together within a given<br />
pixel. This is done by comparing a given<br />
pixel or group <strong>of</strong> spatially contiguous<br />
pixels with laboratory reference spectra<br />
<strong>of</strong> minerals. A spectral analysis procedure<br />
is used to evaluate the degree <strong>of</strong><br />
match <strong>of</strong> each pixel’s spectrum to specific<br />
mineral reference spectra. From the<br />
results <strong>of</strong> the analysis, mineral species<br />
can be identified probabilistically.<br />
The paper by Berger et al. covers<br />
detailed mineral mapping over two<br />
concealed porphyry copper deposits in<br />
the northern Patagonia Mountains <strong>of</strong><br />
Arizona. Distinctive hydrothermal alteration<br />
mineralogy had been previously<br />
mapped in the field, which principally<br />
consisted <strong>of</strong> iron-oxide leached cap. The<br />
hyperspectral survey data were combined<br />
with airborne aeromagnetic data,<br />
digital elevation data, mineral occurrence<br />
data and digital geological maps.<br />
The paper documents a thorough<br />
comparison <strong>of</strong> the minerals mapped by<br />
the AVIRIS scanner with those from<br />
field mapping programs and the aeromagnetic<br />
data. In the Red Mountain<br />
porphyry deposit three alteration zones<br />
were identified from field mapping:<br />
quartz-sericite-pyrite, pyritic-argillic,<br />
and propylitic. The AVIRIS scanner was<br />
able to identify the same principal<br />
alteration zones but the spatial distribution<br />
<strong>of</strong> the zones differed from the field<br />
maps in a few areas. These differences<br />
have been attributed to errors in field<br />
mapping and the AVIRIS results clearly<br />
provided more information. However,<br />
in some cases the AVIRIS scanner was<br />
not able to identify alteration assemblages<br />
due to the fine-grained nature <strong>of</strong><br />
the material and other mineralogies,<br />
which interfere with the detection <strong>of</strong> the<br />
specific reflectance and absorption<br />
characteristics. In addition, vegetation<br />
cover and the effects <strong>of</strong> slope, aspect,<br />
and relative position <strong>of</strong> the sun, as<br />
shown by the digital elevation data,<br />
have an effect on the capture <strong>of</strong> the<br />
mineral spectra. The leached cap, rich<br />
in iron-oxide, is clearly identified from<br />
the AVIRIS spectra, and iron-oxide and<br />
iron-sulfate minerals are easily identified.<br />
However, because <strong>of</strong> factors such<br />
as degree <strong>of</strong> crystallinity, composition,<br />
and structure, not all mineral species<br />
can be identified unambiguously.<br />
The authors conclude that mineral<br />
mapping using AVIRIS data produces<br />
cost-effective results in large areas <strong>of</strong><br />
exposed bedrock and successfully identifies<br />
different mineral assemblages<br />
within areas <strong>of</strong> hydrothermal alteration.<br />
The second paper, by Rowan et al.,<br />
has used the Cuprite area <strong>of</strong> Nevada to<br />
test the ability <strong>of</strong> ASTER data to identify<br />
various alteration and mineralization<br />
assemblages. The Cuprite site is well<br />
known for testing hyperspectral scanners<br />
and abundant literature exists on the<br />
mineralogy <strong>of</strong> the area. The paper makes<br />
a comparison <strong>of</strong> the ASTER data with a<br />
previously flown AVIRIS dataset over the<br />
same area. Bands 1 to 9<br />
to page<br />
(0.52 to 2.43 µm) were 25 ...