Determination of chromium, manganese, lead and ... - Seaturtle.org
Determination of chromium, manganese, lead and ... - Seaturtle.org
Determination of chromium, manganese, lead and ... - Seaturtle.org

You also want an ePaper? Increase the reach of your titles
YUMPU automatically turns print PDFs into web optimized ePapers that Google loves.
- --<br />
SPECTROCHIMICA<br />
ACT A<br />
PART B<br />
ELSEVIER Spectrochimica Acta Part B 51 (1996) 665-683<br />
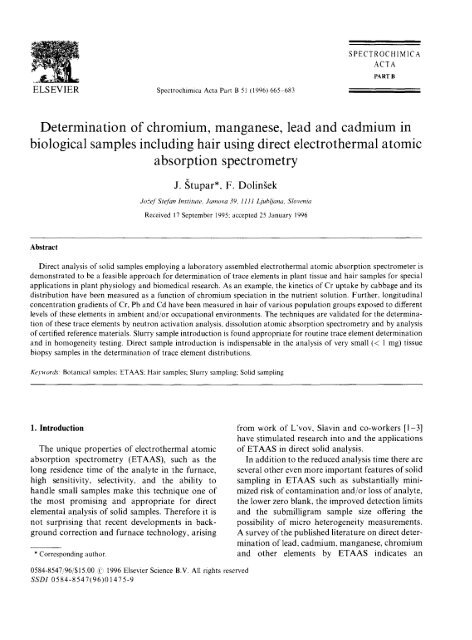
<strong>Determination</strong> <strong>of</strong> <strong>chromium</strong>, <strong>manganese</strong>, <strong>lead</strong> <strong>and</strong> cadmium in<br />
biological samples including hair using direct electrothermal atomic<br />
absorption spectrometry<br />
J. stupar*. F. Doliniek<br />
J<strong>of</strong>ef Stef'ari Inslitute, Jamova 39, lilt Ljubljana, Slovenia<br />
Received 17 September 1995: accepted 25 January 1996<br />
Abstract<br />
Direct analysis <strong>of</strong> solid samples employing a laboratory assembled electrothermal atomic absorption spectrometer is<br />
demonstrated to be a feasible approach for determination <strong>of</strong> trace elements in plant tissue <strong>and</strong> hair samples for special<br />
applications in plant physiology <strong>and</strong> biomedical research. As an example, the kinetics <strong>of</strong> Cr uptake by cabbage <strong>and</strong> its<br />
distribution have been measured as a function <strong>of</strong> <strong>chromium</strong> speciation in the nutrient solution. Further, longitudinal<br />
concentration gradients <strong>of</strong> Cr, Pb <strong>and</strong> Cd have been measured in hair <strong>of</strong> various population groups exposed to different<br />
levels <strong>of</strong> these elements in ambient <strong>and</strong>/or occupational environments. The techniques are validated for the determination<br />
<strong>of</strong> these trace elements by neutron activation analysis. dissolution atomic absorption spectrometry <strong>and</strong> by analysis<br />
<strong>of</strong> certified reference materials. Slurry sample introduction is found appropriate for routine trace element determination<br />
<strong>and</strong> in homogeneity testing. Direct sample introduction is indispensable in the analysis <strong>of</strong> very small (< 1 mg) tissue<br />
biopsy samples in the determination <strong>of</strong> trace element distributions.<br />
Keywords: Botanical samples: ETAAS: Hair samples; Slurry sampling; Solid sampling<br />
1. Introduction<br />
The unique properties <strong>of</strong> electrothermal atomic<br />
absorption spectrometry (ETAAS), such as the<br />
long residence time <strong>of</strong> the analyte in the furnace,<br />
high sensitivity, selectivity, <strong>and</strong> the ability to<br />
h<strong>and</strong>le small samples make this technique one <strong>of</strong><br />
the most promising <strong>and</strong> appropriate for direct<br />
elemental analysis <strong>of</strong> solid samples. Therefore it is<br />
not surprising that recent developments in background<br />
correction <strong>and</strong> furnace technology, arising<br />
* Corresponding author.<br />
from work <strong>of</strong> L'vov, Slavin <strong>and</strong> co-workers [l-31<br />
have stimulated research into <strong>and</strong> the applications<br />
<strong>of</strong> ETAAS in direct solid analysis.<br />
In addition to the reduced analysis time there are<br />
several other even more important features <strong>of</strong> solid<br />
sampling in ETAAS such as substantially minimized<br />
risk <strong>of</strong> contamination <strong>and</strong>/or loss <strong>of</strong> analyte,<br />
the lower zero blank, the improved detection limits<br />
<strong>and</strong> the submilligram sample size <strong>of</strong>fering the<br />
possibility <strong>of</strong> micro heterogeneity measurements.<br />
A survey <strong>of</strong> the published literature on direct determination<br />
<strong>of</strong> <strong>lead</strong>, cadmium, <strong>manganese</strong>, <strong>chromium</strong><br />
<strong>and</strong> other elements by ETAAS indicates an<br />
0584-8547/96/$15.00 c 1996 Elsevier Science B.V. All rights reserved<br />
SSDI 0584-8547(96)01475-9
extreme popularity <strong>of</strong> this technique in the analysis<br />
<strong>of</strong> biological, food <strong>and</strong> related samples [4-181. Two<br />
approaches <strong>of</strong> sample introduction (slurry sampling<br />
<strong>and</strong> direct sample introduction) have been<br />
employed; however, the former has proved more<br />
popular due to the simplicity <strong>of</strong> operation. For<br />
slurry preparation a number <strong>of</strong> diluents have<br />
been proposed by different authors. Some preferred<br />
pure water [4,5.14], others preferred water<br />
with the addition <strong>of</strong> a surface active agent <strong>and</strong>/or<br />
matrix modifier [7,9,10,15,16], whilst another<br />
group <strong>of</strong> researchers favoured dilute nitric acid<br />
[8,11,12,17,18] in order to increase the fraction <strong>of</strong><br />
the analyte in the liquid phase. Miller-Ihli [18] who<br />
produced excellent research on slurry sampling in<br />
ETAAS [18-201 investigated the effect <strong>of</strong> analyte<br />
partitioning in the slurries on the precision <strong>of</strong><br />
measurements. A new term "representative sample<br />
mass' was introduced to define the portion <strong>of</strong> the<br />
sample represented by the analysis. Partial calcination<br />
<strong>of</strong> the sample material before slurry preparation<br />
by ashing in an electrical oven [11,14,16] or<br />
sulphuric acid digestion has been suggested to<br />
reduce the particle size <strong>and</strong> to prevent deterioration<br />
<strong>of</strong> the pyrolitic coating in the graphite tube. A variety<br />
<strong>of</strong> techniques such as magnetic stirring [15,16],<br />
vortex mixing [6], sonification [12,15,17,18,19,20],<br />
or the application <strong>of</strong> thickening agents [8], have<br />
been successfully employed for slurry stabilization.<br />
Ultrasonic homogenization is no doubt the most<br />
efficient approach applicable not only for biological<br />
samples but one must be cautious <strong>of</strong> contamination<br />
from the ultrasonic probe or the beaker<br />
material [12]. A certain extent <strong>of</strong> disagreement<br />
can be noticed in the literature about the influence<br />
<strong>of</strong> particle size <strong>of</strong> slurried biological sample upon<br />
the precision <strong>of</strong> measurement <strong>and</strong> accuracy <strong>of</strong><br />
determination. Ebdon et al. [7,9] claimed that<br />
90% <strong>of</strong> the particles in the suspension should be<br />
smaller than 20-25 pm in diameter for optimal<br />
slurry electrothermal atomization. Working with<br />
such fine powders, excellent precision <strong>and</strong> accuracy<br />
was reported for a number <strong>of</strong> biological certified<br />
reference materials (CRMs). Only manual shaking<br />
<strong>of</strong> the suspensions before pipetting for sample<br />
introduction was adequate. On the contrary,<br />
Miller-Ihli pointed out [19] that uniformity <strong>of</strong> particle<br />
size may be more important than the absolute<br />
size in determining precision <strong>of</strong> biological slurry<br />
measurements. In general simple aqueous st<strong>and</strong>ard<br />
calibration was found satisfactory for quantitation<br />
<strong>of</strong> biological slurries for most analytes [7,8,9,12,<br />
15.18,20]. However, certain authors [5,16,17]<br />
reported interferences arising from the matrix <strong>and</strong><br />
recommend calibration by the method <strong>of</strong> st<strong>and</strong>ard<br />
additions. Introduction <strong>of</strong> oxygen [5] or air [14]<br />
during the ashing step which facilitates an efficient<br />
destruction <strong>of</strong> <strong>org</strong>anic matter at low temperature<br />
has been proposed to reduce the non-specific<br />
absorbance <strong>and</strong> prevent formation <strong>of</strong> carbonaceous<br />
residues in the graphite tube.<br />
Apart from showing an acceptable precision <strong>and</strong><br />
accuracy, the current literature survey on direct<br />
determination <strong>of</strong> trace elements in botanical Samples<br />
failed to demonstrate some specific features <strong>of</strong><br />
this technique that can be used in plant physiology<br />
studies. Indeed only a few papers deal with real<br />
problems [lo, 11,161. The feasibility <strong>of</strong> using<br />
ETAAS for direct analysis <strong>of</strong> a single hair segment<br />
was first realized by Renshaw et al. [21,22]. In their<br />
study, longitudinal concentration gradients <strong>of</strong> <strong>lead</strong><br />
<strong>and</strong> copper were measured in a population in order<br />
to evaluate the possibility <strong>of</strong> discriminating<br />
between hair samples from different sources.<br />
Alder et al. [23] measured the distribution <strong>of</strong> 13<br />
trace elements along the length <strong>of</strong> individual hairs<br />
by direct furnace atomization <strong>of</strong> 1 cm segments <strong>and</strong><br />
measurement <strong>of</strong> atomic absorption.<br />
The present study was initiated with the objective<br />
<strong>of</strong> demonstrating the potentialities <strong>of</strong> direct<br />
ETAAS in trace element determination associated<br />
with specific problems in biomedical <strong>and</strong> environmental<br />
research. Plant tissue biopsy samples were<br />
collected for <strong>chromium</strong> <strong>and</strong> <strong>manganese</strong> determination<br />
to study the kinetics <strong>of</strong> metal uptake <strong>and</strong> translocation.<br />
The distribution <strong>of</strong> these elements in<br />
different parts <strong>of</strong> the plant was also measured.<br />
Chromium, <strong>lead</strong> <strong>and</strong> cadmium were measured in<br />
scalp hair <strong>of</strong> tannery workers <strong>and</strong> children. The<br />
slurry sample introduction technique was<br />
employed for determination <strong>of</strong> bulk hair trace<br />
element levels, <strong>and</strong> direct introduction <strong>of</strong> small<br />
hair segments for measurement <strong>of</strong> longitudinal<br />
concentration gradients. The advantages <strong>of</strong> the<br />
latter approach are discussed <strong>and</strong> data are presented<br />
to illustrate its use in monitoring trace
element nutritional status <strong>and</strong> occupational or<br />
environmental exposure.<br />
2. Experimental<br />
2.1. Apparatus <strong>and</strong> instrumental parameters<br />
A laboratory assembled atomic absorption spectrophotometer<br />
employing a graphite cup atomizer<br />
was used in this work. A detailed description <strong>of</strong> the<br />
instrumental arrangement was given in a previous<br />
paper [15]. A graphite cup <strong>of</strong> type A without the<br />
inner cup was used for <strong>chromium</strong> <strong>and</strong> <strong>manganese</strong><br />
determination. The instrumental parameters summarized<br />
in Table 1 were carefully optimized for<br />
each particular element <strong>and</strong> mode <strong>of</strong> sample introduction.<br />
Argon was replaced by oxygen for the first<br />
12- 15 s <strong>of</strong> the ashing step lasting in total 35 s which<br />
facilitates an efficient destruction <strong>of</strong> <strong>org</strong>anic<br />
matter. This resulted in a substantial reduction <strong>of</strong><br />
the background signal during atomization which<br />
was particularly serious in the measurement <strong>of</strong><br />
cadmium. The use <strong>of</strong> chemical modifiers was<br />
found to be unnecessary except in the atomization<br />
<strong>of</strong> cadmium. All calibrations were performed using<br />
aqueous st<strong>and</strong>ard solutions.<br />
2.2. Sample collection <strong>and</strong> preparation procedures<br />
2.2.1. Botanical samples<br />
Depending on the nature <strong>of</strong> the study, collection<br />
<strong>of</strong> botanical samples was performed either by<br />
biopsy or the whole mass <strong>of</strong> a particular plant tissue<br />
was taken for analysis. In the latter case the<br />
plant material was dried at 105OC. pulverized by<br />
grinding <strong>and</strong> analysed by slurry sample introduction.<br />
Biopsy sampling <strong>of</strong> botanical material was<br />
performed using special tools which are illustrated<br />
in Fig. 1. Discs 6 mm in diameter were cut from<br />
each plant leaf using a punch made <strong>of</strong> aluminium.<br />
Cuttings from the root tissue were obtained in a<br />
similar way. A teflon plate served as a support. In<br />
metal distribution studies the biopsy samples (leaf<br />
discs or root cuttings) were analysed individually<br />
by direct sample introduction. A quartz rod with a<br />
sharp end (see Fig. 1) was used to assist sample<br />
transfer. The mass <strong>of</strong> each particular sample<br />
Table 1<br />
Instrumental parameters for direct atomization <strong>of</strong> botanical <strong>and</strong> hair samples<br />
Parameter<br />
Element<br />
Lead Cadmium* Chromium Manganese<br />
Absorption line nm<br />
Atomization cycle<br />
drying step s<br />
c<br />
Ashing step s<br />
c<br />
Atomization step s<br />
c<br />
Argon flow rate/cm3 min-'<br />
Oxygen flow rate*;cm3 m m'<br />
Background correction<br />
Measurement mode<br />
Sample introduction mode<br />
Direct<br />
Slurry<br />
5k-20~ sh 220' 5 -220' sh-w<br />
110 110 110 110<br />
35 35 35 35<br />
450 550 620 620<br />
3 1 10 5<br />
2000 1700 2500 2400<br />
3000<br />
2500<br />
Simultaneous Di lamp<br />
Integrated absorbance<br />
0.2-4 mg <strong>of</strong> moist plant tissue or hair<br />
10-20 mm3 <strong>of</strong> 0.2- 10¡X m/v aqueous or 1 M HNOi suspension<br />
a (NH&HP04 or Pd(NO& modifier.<br />
' Direct sample introduction.<br />
Slurry sample introduction.<br />
Replaces argon only for the first 12-15 s in the ashing step
668 J. Stupor. F. Dolit~.fek Specfrochimica Ada Part B 51 '1996) 665-683<br />
Fig. 1. Sampling <strong>of</strong> botanical material for direct sample introduction:<br />
a, plant leaf; b. teflon plate; c, punch <strong>and</strong> teflon piston;<br />
d, quartz rod with sharp end; e, graphite cup.<br />
(range 1-2 mg) was determined using a Mettler<br />
MU3 electronic microbalance. The dry mass <strong>of</strong><br />
the atomized sample was calculated assuming<br />
that the moisture content did not vary appreciably<br />
within each particular plant. The latter was determined<br />
on a separate sample. In plant metal-uptake<br />
studies a large number <strong>of</strong> tissue biopsy samples<br />
were taken in vivo from the same plant species.<br />
Identical tissue samples were combined, dried <strong>and</strong><br />
pulverized. Generally 10-100 mg <strong>of</strong> dried tissue<br />
material was obtained for analysis which was performed<br />
by the slurry introduction technique.<br />
Efficient pulverization <strong>of</strong> dried plant tissue was<br />
obtained by grinding samples in a vibration mill<br />
(Retsch, Model MM-2) using agate beads <strong>and</strong><br />
capsule. A typical particle size distribution <strong>of</strong><br />
powdered plant tissue material obtained after<br />
approximately 30 min grinding is illustrated in<br />
Fig. 2. It is evident from the cumulative frequency<br />
distribution function that median particle diameters<br />
are around 10 pm, <strong>and</strong> 90% <strong>of</strong> the particles<br />
are smaller than 30 pm. No measurable contamination<br />
(<strong>chromium</strong>, <strong>manganese</strong>) resulted from<br />
grinding in agate material, in contrast to that<br />
resulting from the more efficient zirconia. Similar<br />
contamination problems due to grinding in<br />
zirconia have been reported by others [19].<br />
Generally twice-distilled water without any<br />
Particle diameter (pm)<br />
Fig. 2. Typical particle size distribution <strong>of</strong> powdered plant tissue <strong>and</strong> hair samples: -Â¥- Rye Grass No. 281 (ground); -A-,<br />
No. 281 (original); -x-. Scalp Hair (ground).<br />
Rye Grass
additives was employed for preparation <strong>of</strong> slurries.<br />
The mass-to-volume ratio <strong>of</strong> the suspension varied<br />
depending on the element being measured. In<br />
determination <strong>of</strong> <strong>chromium</strong>, 2 ml <strong>of</strong> solvent was<br />
mixed with 50-200 mg <strong>of</strong> pulverized plant tissue,<br />
while for determination <strong>of</strong> <strong>manganese</strong> only 2.5-<br />
10 mg <strong>of</strong> plant material was slurried with the<br />
same volume <strong>of</strong> solvent. Prior to manual sampling<br />
using micropipettes, the slurries were mixed three<br />
times for 12 s using a Cole-Palmer Model 4710<br />
ultrasonic homogenizer. The original stainless<br />
steel microtip was replaced by a similar one<br />
machined from pure aluminium to avoid contamination<br />
<strong>of</strong> the slurry. Because the density <strong>of</strong><br />
plant tissue material is close to unity, settling <strong>of</strong><br />
fine particles was slow. Additional improvement<br />
<strong>of</strong> slurry stability was produced by surface active<br />
water soluble proteins released from the plant<br />
tissue during sonification. After initial ultrasonic<br />
homogenization, shaking <strong>of</strong> the suspension before<br />
each particular sampling was found to be adequate<br />
to regenerate the suspension.<br />
2.2.2. Hair samples<br />
In the present paper two possible approaches to<br />
direct trace element hair analysis were investigated:<br />
(a) determination <strong>of</strong> bulk trace element content<br />
using slurry sample introduction; (b) measurement<br />
<strong>of</strong> the longitudinal concentration gradient by direct<br />
atomization <strong>of</strong> small hair segments. In either case<br />
scalp hair was sampled from the nape <strong>of</strong> the neck.<br />
Usually two bundles, each containing 50-90 single<br />
hairs were cut as close as possible to the skin. One<br />
hair bundle was analysed unwashed; the other was<br />
subjected to the pre-analysis washing described by<br />
Kumpulainen et al. [24]. This consisted <strong>of</strong> four successive<br />
20 min washings in a mixture <strong>of</strong> n-hexaneethanol<br />
(1 + l), followed by three successive 5 min<br />
washings in distilled water. After that hairs were<br />
dried at 60-80'0 for 4 h.<br />
(a) A 25 mm long section <strong>of</strong> the proximal part <strong>of</strong><br />
hair was cut from the bundle for determination <strong>of</strong><br />
bulk trace element contents. In this slurry sample<br />
introduction approach either the prewashed or<br />
unwashed dried hairs were first ground. Hair grinding<br />
was performed the same way as described for<br />
botanical samples (Section 2.2.1). Similar contamination<br />
problems arose from using zirconia<br />
material for grinding. A typical particle size distribution<br />
<strong>of</strong> a powdered hair sample (illustrated in<br />
Fig. 2) shows an identical pattern to that <strong>of</strong> a similarly<br />
ground botanical sample. Slurries were prepared<br />
by weighing 20-200 mg <strong>of</strong> hair powder<br />
into cleaned glass vials <strong>and</strong> adding 2 ml <strong>of</strong> twicedistilled<br />
water. Homogeneity <strong>of</strong> the slurries was<br />
achieved by the sonification procedure described<br />
in Section 2.2.1. The favourable density <strong>of</strong> hair<br />
material (1.074) <strong>and</strong> water soluble proteins facilitate<br />
an excellent slurry stability.<br />
(b) Despite the obvious benefits outlined earlier<br />
by Renshaw et al. [22] <strong>and</strong> others, measurements <strong>of</strong><br />
trace element concentration gradients along the<br />
hair length has not received much attention, possibly<br />
due to technical problems. Our first attempt to<br />
measure longitudinal concentration gradients <strong>of</strong><br />
<strong>chromium</strong> in a bundle rather than in a single hair<br />
by analysing 4 mm segments failed due to the propensity<br />
<strong>of</strong> hair to static charging. After a number <strong>of</strong><br />
different trials the only reasonable way <strong>of</strong> reaching<br />
a practical solution was to seal an undisturbed hair<br />
bundle between two strips <strong>of</strong> Scotch tape (Scotch<br />
Magic Tape, France). This material was chosen<br />
because <strong>of</strong> its negligible blank values for <strong>lead</strong>,<br />
cadmium <strong>and</strong> <strong>chromium</strong>. Segments 2-4 mm in<br />
diameter were punched out at selected distances<br />
along the hair length <strong>and</strong> introduced individually<br />
into the graphite cup for atomization. The exact<br />
mass <strong>of</strong> the hair material in the segment was<br />
obtained by weighing the total mass <strong>of</strong> the segment<br />
Fig. 3. Hair sampling tools for direct segmental analysis: a,<br />
punch; b, teflon piston for extruding disc; c, quartz rod with<br />
sharp end for h<strong>and</strong>ling disc; d, hair bundle fixed between two<br />
tapes.
<strong>and</strong> subtracting the mass <strong>of</strong> the tape. The latter was<br />
determined separately <strong>and</strong> was found to be reasonably<br />
constant (Â 0.01 mg). Two typical sealed hair<br />
bundles with 4 mm diameter segments cut out <strong>and</strong><br />
the tools required for punching <strong>and</strong> h<strong>and</strong>ling hair<br />
segments are illustrated in Fig. 3. The punch was<br />
made <strong>of</strong> high quality steel containing only traces <strong>of</strong><br />
<strong>chromium</strong> <strong>and</strong> no measurable contamination<br />
resulted from this operation.<br />
3. Results <strong>and</strong> Discussion<br />
3.1. Sensitivity, accuracy <strong>and</strong> precision <strong>of</strong><br />
measurements<br />
Characteristic masses <strong>of</strong> 15 pg. 8 pg, 55 pg, <strong>and</strong> 3<br />
pg for <strong>chromium</strong>, <strong>manganese</strong>, <strong>lead</strong> <strong>and</strong> cadmium.<br />
respectively, were calculated for aqueous solutions<br />
using a cup shaped atomization device. These were<br />
considerably higher in comparison to those<br />
reported for commercial tube-like atomizers<br />
[3.12]. The poorer sensitivity is primarily a consequence<br />
<strong>of</strong> the shorter residence time <strong>of</strong> analyte<br />
atoms in the cup in relation to the pyrolitically<br />
coated tube. It is important, however, to note<br />
that the above characteristic masses remained<br />
reasonably constant (variation <strong>of</strong> h5-10%)<br />
over a two year period. This enabled fast semiquantitative<br />
screening <strong>of</strong> biological samples without<br />
calibration.<br />
Reasonably good accuracy <strong>and</strong> precision <strong>of</strong><br />
measurements are a prerequisite <strong>of</strong> any analytical<br />
technique <strong>and</strong> procedure employed in studies in the<br />
life sciences. Artifacts in analytical data may <strong>lead</strong><br />
to totally erroneous assumptions <strong>and</strong>/or conclusions.<br />
Therefore the majority <strong>of</strong> papers quoted in<br />
the Introduction deal with the optimization <strong>of</strong><br />
parameters influencing the accuracy <strong>and</strong> precision<br />
<strong>of</strong> slurry measurements. A number <strong>of</strong> different biological<br />
reference materials were used in those<br />
studies.<br />
Two major sources <strong>of</strong> error may be encountered<br />
in direct analysis <strong>of</strong> solid samples; the first is associated<br />
with the representativeness <strong>of</strong> sampling, <strong>and</strong><br />
the second is due to error in the atomic absorption<br />
measurements. The first source <strong>of</strong> error might<br />
become dominant when the total mass <strong>of</strong> material<br />
to be analysed is substantially larger than the mass<br />
actually measured. In this case the homogeneity <strong>of</strong><br />
the material with respect to the analyte is critical<br />
<strong>and</strong> can be improved by reducing the particle size.<br />
However, in a variety <strong>of</strong> biomedical applications<br />
the analytical information is required on a very<br />
small mass <strong>of</strong> the material (less than 1 me). as for<br />
example a short hair segment or a small tissue<br />
biopsy sample. In such situations analyte inhomogeneity<br />
in the sample. even if it is present, has little<br />
significance for the analyst <strong>and</strong> the entire analytical<br />
error is due to the atomic absorption measurement.<br />
The intention <strong>of</strong> this research was not to favour a<br />
particular sample introduction technique but to<br />
demonstrate their best use in certain applications.<br />
In this respect our main concern was to achieve<br />
acceptable accuracy <strong>and</strong> precision <strong>of</strong> measurements<br />
using simple aqueous st<strong>and</strong>ard calibration.<br />
For this purpose a number <strong>of</strong> international biological<br />
st<strong>and</strong>ard or certified reference materials<br />
(SRMsICRMs) <strong>and</strong> internal hair reference samples<br />
were analysed in triplicate by the slurry sample<br />
introduction technique. The data were averaged,<br />
<strong>and</strong> the st<strong>and</strong>ard deviation calculated. Reference<br />
Table 2<br />
Analyte partitioningJ in biological reference materials <strong>and</strong> hair<br />
slurries<br />
Material<br />
Analyte element<br />
Cd Pb Mn Cr<br />
Rye crassh 6 13 40-50 -d<br />
BRC-CRM No. 28 1 97' 100' 89"'<br />
Oleu e~iropueu 2 14 -d -<br />
BRC-CRM No. 62 80' 97'<br />
Citrus eaves^<br />
d<br />
- 40-65 30-40<br />
NBS-SRM No. 1572 83' 83-97'<br />
Mussel Tissue 8<br />
BRC-CRM NO. 278 gjc -' -' 45-65'<br />
Hair Internal Reference 5 0.5 -d 22<br />
Sample No. 4 84' 80' 47'<br />
' Percentage ana-lyte in aqueous phase.<br />
Additionally ground material.<br />
' 1 M HNO, slurry.<br />
Not determined.<br />
d
J. %upur, F. Dolin.?ek . Spectrorhiifiicu Ada Purl B 51 ( 1996, 665-683 67 1<br />
Table 3<br />
<strong>Determination</strong> <strong>of</strong> <strong>lead</strong>, cadmium, <strong>chromium</strong> <strong>and</strong> <strong>manganese</strong> in biological reference materials <strong>and</strong> internal hair reference samples (n = 3)<br />
Reference material<br />
Element concentration<br />
Pb Cd Cr Mn<br />
ws- ' ng e-I "e g-' /+! g-l<br />
Rye Grassa<br />
BRCICRM No. 281<br />
Olea europaeu<br />
BRC-CRM NO. 62<br />
Mussel Tissue<br />
BRCCRM No. 278<br />
Milk Powder<br />
BRC-CRM No. 150<br />
Citrus Leavesd<br />
NBS/SRM No. 1572<br />
Internal Hair Reference Sample<br />
No, 1<br />
No. 2<br />
No. 3<br />
Ground in agate ball mill.<br />
Slurry electrothermal atomic absorption spectrometry.<br />
Certified values.<br />
Slurry in 1 M HNO,.<br />
HNO, dissolution electrothermal atomic absorption spectrometry<br />
' Neutron activation analysis<br />
Not determined.<br />
materials were suspended in twice-distilled water<br />
<strong>and</strong> 1 M HN03. The mass-to-volume ratio <strong>of</strong> the<br />
suspensions varied depending on the analyte <strong>and</strong><br />
its concentration in the reference material.<br />
The following masses <strong>of</strong> SRMslCRMs were suspended<br />
in 1 ml <strong>of</strong> the diluent: 25-100 mg, 2.5-<br />
20 mg, 10-50 mg <strong>and</strong> 10-40 mg for the determination<br />
<strong>of</strong> <strong>chromium</strong>. <strong>manganese</strong>, <strong>lead</strong> <strong>and</strong><br />
cadmium, respectively. A 10 m m sampling volume<br />
was employed in <strong>manganese</strong> measurements <strong>and</strong><br />
20 mm3 for the other elements. Analyte partitioning<br />
was determined in these slurries by centrifugation<br />
(10000 rev min' for 20 min) <strong>of</strong> a<br />
homogenized suspension <strong>and</strong> filtration <strong>of</strong> the<br />
supernatant through a 0.2 pm millipore membrane.<br />
Data on analyte partitioning in aqueous <strong>and</strong> 1 M<br />
HN03 suspensions are summarized in Table 2. It<br />
may be concluded from the data in Table 2 that<br />
<strong>lead</strong> <strong>and</strong> cadmium compounds present in these<br />
materials are much less soluble in water in<br />
comparison with <strong>chromium</strong> <strong>and</strong> <strong>manganese</strong> compounds.<br />
However, the solubility <strong>of</strong> all four elements<br />
is substantially enhanced in the presence <strong>of</strong><br />
1 M HN03. Data for <strong>manganese</strong> partitioning in an<br />
HNO; acid slurry <strong>of</strong> SRM Citrus Leaves 1572<br />
agree well with those obtained by Jordan et al.<br />
[12], considering our more rigorous separation <strong>of</strong><br />
the liquid phase. The data for other elements
672 J hpur, F. Dol;n.i%k Spectroihimiw Aria Part B 51 (1996i 665-683<br />
Table 4<br />
Reproducibilitya (RSD ic %) <strong>of</strong> measurement (Ã = 5) <strong>of</strong> biological<br />
reference materials <strong>and</strong> hair slurries, affected by analyte<br />
partitioning <strong>and</strong> particle size distribution<br />
Material<br />
Rye Grass<br />
BRC CRM No. 281<br />
Oleu europueu<br />
BRC CRM No. 62<br />
Citrus Leaves<br />
NBSiSRM No. 1572<br />
Mussel Tissue<br />
BRC-CRM No. 278<br />
Hair Internal Reference<br />
Sample No. 4<br />
Analyte element<br />
a An average precision <strong>of</strong> manual sampling <strong>of</strong> Â 2% was<br />
mated by measurements <strong>of</strong> aqueous st<strong>and</strong>ards.<br />
Additionally ground material.<br />
1 M HNO, slurry.<br />
Not determined.<br />
esti-<br />
investigated are generally in the same range as<br />
those reported in the literature [17-191. The exception<br />
is <strong>lead</strong> partitioning in botanical HN03 acidic<br />
slurries, where high values (80-100%) were<br />
reported by Miller-Ihli [18] <strong>and</strong> in this work, <strong>and</strong><br />
very low values (1.5-2.5%) by Dobrowolsky <strong>and</strong><br />
Mierzwa [17].<br />
The results for <strong>manganese</strong>, <strong>chromium</strong>, <strong>lead</strong> <strong>and</strong><br />
cadmium determination in various international<br />
biological SRMsICRMs <strong>and</strong> laboratory-prepared<br />
hair samples are summarized in Table 3. Because<br />
no reference values were available for hair samples,<br />
these were also analysed by neutron activation<br />
analysis <strong>and</strong> a conventional dissolution - AAS<br />
procedure, <strong>and</strong> the results were compared. Two<br />
<strong>of</strong> the botanical CRMs (Rye Grass. Citrus Leaves)<br />
were additionally ground by the procedure<br />
described in Section 2.1.1. The primary reason for<br />
so doing was the poor homogeneity <strong>of</strong> these<br />
materials. Additional grinding increased the<br />
number <strong>of</strong> particles in the sampling volume by<br />
the factor <strong>of</strong> 64. In the slurries involved in evaluation<br />
<strong>of</strong> the accuracy <strong>of</strong> determination (Table 3) <strong>and</strong><br />
precision <strong>of</strong> measurement (Table 4) the minimum<br />
mass <strong>of</strong> solid material per unit volume (see the data<br />
in Ref. [25]) required to produce 50 particles in the<br />
sampling volume (10-20 mm3) was considerably<br />
exceeded. However, it should be pointed out that<br />
the real number <strong>of</strong> particles in the sample volume<br />
may be substantially different from that assuming<br />
perfect spherical shape <strong>of</strong> the particles. The latter is<br />
particularly well demonstrated in Fig. 4 for ground<br />
botanical <strong>and</strong> hair materials. In poorly ground<br />
material (Citrus Leaves, Fig. 4(a)) one can distinguish<br />
between particles <strong>of</strong> two different structures<br />
(fibrous <strong>and</strong> planar). It is very likely that the analyte<br />
contents <strong>of</strong> these two particle groups vary considerably.<br />
The apparent differences in particle<br />
structure disappear on additional grinding <strong>of</strong> this<br />
material, but a fairly irregular particle shape can<br />
still be observed (Fig. 4(b. c)). An irregular shape<br />
with some fibrous structure is also characteristic <strong>of</strong><br />
ground hair material (Fig. 4(d)).<br />
With the exception <strong>of</strong> the cadmium value measured<br />
in CRM (Rye Grass No. 281), all other data<br />
obtained for elements in botanical reference<br />
materials are reasonably within the uncertainty<br />
limits <strong>of</strong> the certified values. These intervals were<br />
in certain cases rather broad, as for example for<br />
<strong>chromium</strong> <strong>and</strong> cadmium in Citrus Leaves. In contrast,<br />
some <strong>of</strong> the reference materials were found to<br />
be homogeneous even in the submilligram range,<br />
for example Mussel Tissue where no significant<br />
difference in cadmium values was found between<br />
aqueous <strong>and</strong> 1 M HN03 slurries, despite the considerable<br />
difference in representative sample mass.<br />
The same applies for <strong>manganese</strong> determination in<br />
the ground Rye Grass sample. No feasible explanation<br />
could be proposed for the apparent difference<br />
in the measured <strong>and</strong> certified cadmium value in this<br />
material.<br />
Excellent agreement with neutron activation<br />
data in the measurement <strong>of</strong> cadmium in hair<br />
implies good accuracy for the direct ETAAS determination<br />
for this element. Slurry <strong>and</strong> conventional<br />
solution ETAAS yielded essentially the same<br />
results for <strong>chromium</strong> <strong>and</strong> <strong>manganese</strong> in hair<br />
sample 1 but neutron activation data was either<br />
not applicable or less precise for determining<br />
,<br />
these elements. Because neutron activation is not<br />
I<br />
a suitable technique for measurement <strong>of</strong> <strong>lead</strong>, the<br />
I<br />
I
J. fiupar, F. Dolit~iek : Spectruehimica Ada Part B 51 H996, 665-68S<br />
Fig. 4. Scanningelectron microscopy photographs <strong>of</strong> hair <strong>and</strong> plant material particles: (a) original NBS SRM 1572 Citrus Leaves; (b), (c)<br />
ground NBS SRM 1572 Citrus Leaves; (d) ground hair.<br />
accuracy <strong>of</strong> direct determination <strong>of</strong> this element in<br />
hair was examined by comparing the results with<br />
those obtained by conventional solution ETTAS.<br />
A reasonable agreement was obtained for both hair<br />
samples.<br />
3.1.1. Effect <strong>of</strong>particle size <strong>and</strong> analyte partitioning<br />
on the precision <strong>of</strong> measurement<br />
Theoretically, particle size <strong>and</strong> analyte partitioning<br />
in the slurry may influence the precision <strong>and</strong>/or<br />
accuracy <strong>of</strong> measurement [26,27]. The beneficial<br />
effect <strong>of</strong> analyte extraction on these values has<br />
already been demonstrated [18-201 in measurements<br />
<strong>of</strong> slurries <strong>of</strong> different nature <strong>and</strong> homogeneity.<br />
Part <strong>of</strong> this study was therefore directed<br />
towards evaluation <strong>of</strong> the effects <strong>of</strong> particle size<br />
<strong>and</strong> analyte partitioning on the precision <strong>and</strong>/or<br />
accuracy <strong>of</strong> measurements <strong>of</strong> biological slurry<br />
preparations. Table 4 summarizes reproducibility<br />
data <strong>of</strong> cadmium, <strong>lead</strong>. <strong>manganese</strong> <strong>and</strong> <strong>chromium</strong><br />
measurements in biological SRM <strong>and</strong> hair slurries.<br />
Each value in the table represents the st<strong>and</strong>ard<br />
deviation <strong>of</strong> five consecutive measurements <strong>of</strong> a<br />
single slurry preparation.<br />
The poor homogeneity <strong>of</strong> SRM Citrus Leaves<br />
used in the validation <strong>of</strong> slurry results was established<br />
by electron microscopy (Fig. 4(a)). A similar<br />
degree <strong>of</strong> inhomogeneity might also be expected for<br />
the other two botanical SRMs having approximately<br />
equal particle size distribution. Corresponding<br />
values <strong>of</strong> Dan are 100 pm, 158 pm <strong>and</strong><br />
265 pm for the Rye Grass, Olea eropaea <strong>and</strong> Citrus<br />
Leaves [15] respectively. This might explain the<br />
large uncertainty intervals for some certified<br />
elements (<strong>lead</strong>, cadmium, <strong>chromium</strong>) in these<br />
materials even at 500 mg sample mass. Additional,
674 J. ~ lu~ur, F. Doliniek Spec~rocl~iniicu Actu Part B 51 1996) 665-683<br />
Table 5<br />
Distribution <strong>of</strong> <strong>chromium</strong> <strong>and</strong> <strong>manganese</strong> in cabbage secondary<br />
rootsd<br />
Sample no. Chromium! Manganese;<br />
(ws') (w g-l)<br />
}<br />
1 2990<br />
2 3260<br />
3 2550. 3020 Â 294<br />
3.70<br />
4h 3020<br />
5" 3280<br />
6' 31 10 600<br />
7d 1390 220<br />
Mass <strong>of</strong> sample 20-30 mg, aqueous 0.3% m/v slurry.<br />
Samples taken r<strong>and</strong>omly over the whole length <strong>of</strong> secondary<br />
roots.<br />
' Upper part <strong>of</strong> secondary roots.<br />
Lower part <strong>of</strong> secondary roots.<br />
grinding which substantially reduced the particle<br />
size (Dgo w 20-40 pm) should therefore improve<br />
the precision <strong>of</strong> slurry measurements. This was<br />
indeed observed for the measurement <strong>of</strong> <strong>lead</strong> in<br />
SRM Rye Grass (Table 4). It should be emphasized<br />
that reduction in particle size affected the precision<br />
<strong>of</strong> measurement more strongly than the enhanced<br />
solubility <strong>of</strong> <strong>lead</strong> in the slurry at the same total<br />
sample mass (35 mg m l).<br />
It may generally be expected that large enhancements<br />
in analyte extraction such as experienced in<br />
the case <strong>of</strong> <strong>lead</strong> <strong>and</strong> cadmium may result in an<br />
improved precision <strong>of</strong> measurement providing the<br />
sample material consists <strong>of</strong> relatively coarse particles<br />
(Dgo 2 150 pm). Additionally, no further<br />
improvement in the precision <strong>of</strong> measurement can<br />
be obtained with slurries <strong>of</strong> finely ground material<br />
(Dan ? 35 pm) by more complete extraction <strong>of</strong> the<br />
analyte. An exception to these generalizations was<br />
found in measurement <strong>of</strong> <strong>chromium</strong> in Citrus<br />
Leaves.<br />
3.2. The use <strong>of</strong> the proposed method in plant mineral<br />
nutrition studies<br />
Several major, minor <strong>and</strong> trace elements are<br />
essential for the normal growth <strong>and</strong> reproduction<br />
<strong>of</strong> higher plants. In contrast, a number <strong>of</strong> elements,<br />
even at trace levels, will inhibit plant growth or<br />
may cause plant death. Mineral nutrition <strong>and</strong> toxicology<br />
are therefore important areas <strong>of</strong> research<br />
both in basic <strong>and</strong> applied science. Significant progress<br />
has been made during the last few decades in<br />
underst<strong>and</strong>ing the mechanisms <strong>of</strong> mineral uptake,<br />
translocation <strong>and</strong> their function in plant metabolism.<br />
This progress was largely affected by the<br />
development <strong>of</strong> analytical chemistry. Solid sampling<br />
- ETAAS has some unique features which<br />
can be utilized in studies <strong>of</strong> plant mineral nutrition<br />
<strong>and</strong> toxicology.<br />
The studies performed in the scope <strong>of</strong> this communication<br />
can be divided into two categories:<br />
(1) measurement <strong>of</strong> <strong>chromium</strong> distribution in<br />
plant tissues (leaf <strong>and</strong> root);<br />
(2) measurements <strong>of</strong> the kinetics <strong>of</strong> <strong>chromium</strong><br />
uptake <strong>and</strong> translocation.<br />
Short-term laboratory experiments (up to 7<br />
days) were performed in nutrient solutions on<br />
cabbage plants (Brassica oleracea L. var. conica<br />
cr. Raket).<br />
3.2.1. Preparation <strong>of</strong> plant material<br />
Cabbage plants used in laboratory experiments<br />
Table 6<br />
Homogeneity <strong>of</strong> <strong>chromium</strong> distribution in plant tissue<br />
Sample Cabbage leaves/(pg g ) Cabbage roots/(pg g )<br />
Biopsy Bulk" A/% Biopsy Bulk2 A/ O h<br />
Blank 0.23 0.19 +2 1 1.40 1.90 -26<br />
Cr(V1) (0.5 pg ~ m - ~ ) 0.92 0.97 - 5 873 556 +57<br />
Cr(V1) (5 pg cW3) 2.38 2.1 1 -13 2144 1337 +60<br />
Cr(II1) (0.5 pg cm-') 0.28 0.32 -13 843 543 +55<br />
Cr-oxalate (0.5 pg c m ) 0.66 0.74 -11 210 242 -13<br />
Analysed by dissolution <strong>of</strong> 2 g <strong>of</strong> homogenized sample.
were grown in a modified Arnon-Hoagl<strong>and</strong> solution<br />
[28] for three months. The ambient air temperature<br />
in the greenhouse was 15-22T.<br />
illumination 11 hours per day.<br />
3.2.2. Homogeneity <strong>of</strong> <strong>chromium</strong> distribution in<br />
plant tissue<br />
One <strong>of</strong> the most important reasons for studying<br />
the homogeneity <strong>of</strong> metal distribution in plant tissues<br />
is the question <strong>of</strong> how accurately the biopsy<br />
sampling <strong>of</strong> the plant tissue would resemble the<br />
average content <strong>of</strong> the metal in that tissue (bulk<br />
content). The distribution <strong>of</strong> <strong>chromium</strong> was<br />
measured in the leaf <strong>and</strong> root tissue <strong>of</strong> cabbage<br />
plants placed for seven days in a nutrient solution<br />
<strong>of</strong> very low (about 50 ng Cr ~m-~) <strong>and</strong> high (500 ng<br />
Cr cm3) chromate concentration.<br />
Fifteen discs <strong>of</strong> 6 mm diameter were punched<br />
r<strong>and</strong>omly from a particular leaf using the tools<br />
presented in Fig. 1. Each <strong>of</strong> the discs was weighed<br />
<strong>and</strong> measured for <strong>chromium</strong> content. The variation<br />
in the mass <strong>of</strong> discs within one leaf was found to be<br />
 2%, but variations between different leaves <strong>of</strong><br />
the same plant were up to 100%. Variations in<br />
the <strong>chromium</strong> content <strong>of</strong> individual leaves was<br />
 35% for the plants grown in the low <strong>chromium</strong><br />
solution (average <strong>chromium</strong> content 0.16 pg g )<br />
<strong>and</strong> Â 11 % for those grown in high <strong>chromium</strong><br />
solution (average <strong>chromium</strong> content 0.54 pg g ).<br />
Similarly, leaves <strong>of</strong> different age from the plant fed<br />
high <strong>chromium</strong>(V1) showed remarkably different<br />
<strong>chromium</strong> contents (variation <strong>of</strong> up to 300%).<br />
Additionally, the distribution <strong>of</strong> <strong>chromium</strong> <strong>and</strong><br />
<strong>manganese</strong> was measured in secondary roots <strong>of</strong><br />
the high <strong>chromium</strong>(V1) fed plant. Five samples <strong>of</strong><br />
the whole length were collected r<strong>and</strong>omly from the<br />
root system. Samples No. 6 <strong>and</strong> No. 7 consisted<br />
only <strong>of</strong> the upper <strong>and</strong> lower part <strong>of</strong> secondary<br />
roots, respectively. The samples were washed,<br />
dried <strong>and</strong> pulverized. The analysis was performed<br />
by slurry sample introduction. The results illustrated<br />
in Table 5 showed definite variation in the<br />
concentration <strong>of</strong> both elements with the root<br />
length. Between the whole length root sub-samples<br />
0 20 40 60 80 100 120 140 160 180<br />
Time (hours)<br />
Fig. 5. Kinetics <strong>of</strong> <strong>chromium</strong> uptake by cabbage plant (plant roots): -Â¥- chromate; -Ap. Cr(II1); -*-, Cr(1II) oxalate complex.
676 J. ~ttqar, F. Dolinfek : Specirorhimica Ada Part B 51 (19961 665-683<br />
there is also significant variation for <strong>manganese</strong><br />
(Â 50%) <strong>and</strong> less remarkable variation for <strong>chromium</strong><br />
(Â 10%).<br />
Another more elaborate homogeneity test was<br />
performed in which five approximately equal cabbage<br />
plants (with 14 developed leaves) exposed for<br />
7 days to different <strong>chromium</strong> species at various<br />
concentration levels were sampled for <strong>chromium</strong><br />
determination. Two different sampling strategies<br />
were used.<br />
(1) Biopsy sampling. Seven discs <strong>of</strong> 6 mm diameter<br />
were punched from each leaf <strong>of</strong> a plant <strong>and</strong><br />
the samples were combined. Similarly, three whole<br />
lengths <strong>of</strong> secondary roots were cut from each<br />
plant. Samples were dried, pulverized <strong>and</strong> analysed<br />
by the slurry sample introduction technique.<br />
(2) Bulk sampling. The rest <strong>of</strong> the plant tissue<br />
(root <strong>and</strong> leaves separately) were analysed by the<br />
conventional dissolution procedure.<br />
The results <strong>of</strong> this experiment are summarized in<br />
Table 6 <strong>and</strong> are in general agreement with the<br />
expected homogeneity <strong>of</strong> <strong>chromium</strong> distribution<br />
in these tissues obtained by previous measurements.<br />
The accuracy <strong>of</strong> the proposed biopsy<br />
sampling should be satisfactory for different<br />
plant physiology studies such as metal uptake<br />
<strong>and</strong> translocation. The "root" values tend to be<br />
positively biased, particularly when large quantities<br />
<strong>of</strong> the metal are deposited in the root cells by<br />
adsorption. This might be explained by the<br />
fact that a larger proportion <strong>of</strong> the finer roots<br />
with larger specific surface area are sampled by<br />
the biopsy technique in comparison to bulk<br />
sampling.<br />
3.2.3. Kinetics <strong>of</strong> <strong>chromium</strong> uptake <strong>and</strong> translocation<br />
in plants<br />
In studies <strong>of</strong> the kinetics <strong>of</strong> metal uptake <strong>and</strong><br />
translocation by different plant species, it is essential<br />
that temporal changes in the metal content <strong>of</strong><br />
particular tissues are monitored in the same plant.<br />
Namely. the metabolic rates <strong>of</strong> individual plants <strong>of</strong><br />
0 20 40 60 80 100 120 140 160 180<br />
Time (hours)<br />
Fig. 6. Kinetics <strong>of</strong> <strong>chromium</strong> uptake by cabbage plant (plant leaves): -Â¥- chromate; -Ap. Cr(II1); -*-. Cr(II1) oxalate complex.
J. ~tupur. F. Dol~i~.fek / Spectrochimica Ada Par! B 51 f 1996) 665-683 677<br />
the same species grown in the same environment<br />
may vary dramatically (1-5 times). In such studies<br />
radio tracer techniques have been the most popular<br />
[28,29]. The following experiment was designed to<br />
evaluate the feasibility <strong>of</strong> using solid sampling<br />
ETAAS as an alternative technique in measurements<br />
<strong>of</strong> plant metal uptake. Nine approximately<br />
equal cabbage plants were transferred from Arnon-<br />
Hoagl<strong>and</strong> nutrient solution in triplicate into three<br />
different solutions (9 x lop3 M NaiHP04,<br />
6 x lop3 M KH2P04 <strong>and</strong> 5 x lop3 M NH4N03)<br />
containing 500 ng c m3 <strong>of</strong> <strong>chromium</strong> in the form<br />
<strong>of</strong> either chromate, <strong>chromium</strong>(111) chloride or<br />
<strong>chromium</strong>(111) oxalate. Plants were left in these<br />
solutions for one week under continuous aeration,<br />
constant temperature <strong>and</strong> illumination. Biopsy<br />
sampling was performed on leaves <strong>and</strong> roots by<br />
the procedure described in Section 3.2.2 at zero<br />
time, 8 h, 24 h, 72 h <strong>and</strong> at the end <strong>of</strong> the<br />
experiment (168 h). Samples collected from all<br />
three plants in the same solution <strong>and</strong> taken at the<br />
same time were combined, dried, pulverized <strong>and</strong><br />
analysed by the slurry sample introduction technique.<br />
Temporal variations <strong>of</strong> <strong>chromium</strong> content<br />
in cabbage roots <strong>and</strong> cabbage leaves due to<br />
different <strong>chromium</strong> speciation in the nutrient<br />
solution are illustrated in Figs. 5 <strong>and</strong> 6, respectively.<br />
It is not the scope <strong>of</strong> this paper to discuss<br />
in detail the results <strong>of</strong> this experiment, but what<br />
should be emphasized is the necessity <strong>of</strong> metal<br />
speciation in the nutrient solution <strong>and</strong> its effect<br />
on the uptake rate <strong>and</strong> transport index<br />
(100 x metal shoot content/total metal content).<br />
This has <strong>of</strong>ten been neglected, which explains the<br />
conflicting results reported for <strong>chromium</strong> in the<br />
literature [30].<br />
Distance from scalp (mrn)<br />
Fig. 7. Effect <strong>of</strong> hair washing on longitudinal hair Cr pr<strong>of</strong>iles typical <strong>of</strong> tannery workers: @, subject I; A. subject 2; (-.<br />
-- -. washed hair).<br />
unwashed hair;
678 J. Siupar. F. Dolm.fek Specirochimica Acta Pari B 51 (1996) 665-683<br />
3.3. Measurements <strong>of</strong> metal concentration gradients<br />
along the hair versus bulk metal content<br />
In the majority <strong>of</strong> biomedical research reports<br />
where hair analysis has been used to assess the<br />
status <strong>of</strong> the subject in respect to that particular<br />
element, the possibility <strong>of</strong> trace element variation<br />
along the hair length has usually been disregarded.<br />
The latter has been emphasized by Renshaw et al.<br />
[21,22], Alder et al. [23], <strong>and</strong> Stauber <strong>and</strong> Florence<br />
[31] who demonstrated the advantages <strong>of</strong> measuring<br />
longitudinal hair pr<strong>of</strong>iles for correct interpretation<br />
<strong>of</strong> analytical data for diagnostic purposes.<br />
The concentration <strong>of</strong> the majority <strong>of</strong> trace elements<br />
investigated by these authors was found to increase<br />
from root to tip.<br />
Bulk trace element hair contents represent only<br />
an average value over a certain period <strong>of</strong> time.<br />
These values may be strongly dependent on hair<br />
lengths <strong>and</strong> take no consideration <strong>of</strong> the relative<br />
proportion <strong>of</strong> trace elements incorporated in the<br />
hair structure after the hair has been formed.<br />
Therefore the bulk hair value would generally overestimate<br />
the "metabolic hair trace element value".<br />
Measurement <strong>of</strong> longitudinal trace element hair<br />
pr<strong>of</strong>iles should have several advantages over the<br />
bulk trace element hair content. (i) Assuming<br />
trace element incorporation takes place predominantly<br />
during hair formation (keratinization), it<br />
would provide short time variation in the status<br />
<strong>of</strong> the subject with respect to that particular<br />
element. (ii) Providing postkeratinization trace<br />
element incorporation is significant in comparison<br />
to metabolic incorporation, the relative extent <strong>of</strong><br />
the former may be estimated by evaluation <strong>of</strong> the<br />
distribution pattern <strong>of</strong> that particular element<br />
along the hair length. (iii) Considering some<br />
specific details, analysis <strong>of</strong> longitudinal trace<br />
element hair pr<strong>of</strong>iles may provide insight into<br />
various physiological processes in the <strong>org</strong>anism<br />
such as absorption, metabolism <strong>and</strong> excretion by<br />
perspiration.<br />
0 5 10 15 20 25 30 35 40 45 50<br />
Distance from scalp (mm)<br />
Fig. 8. Variation <strong>of</strong> hair Cr content with distance from scalp due to the change <strong>of</strong> habitat (for an occupationally unexposed person).<br />
I-, washed hair; -A-. unwashed hair.
cu Actu Part B 51 (1996) 665-683 679<br />
The technique proposed in this paper has an<br />
advantage over those proposed by Renshaw et al.<br />
[22] <strong>and</strong> other workers [23,31] in that it can<br />
measure segments <strong>of</strong> hair 2-4 mm in length without<br />
substantial technical problems. Longitudinal<br />
hair pr<strong>of</strong>iles <strong>of</strong> <strong>chromium</strong>, <strong>lead</strong> <strong>and</strong> cadmium<br />
were measured. The subjects involved in these<br />
measurements were mainly children aged 10- 14<br />
<strong>of</strong> both sexes from different residential areas in<br />
Slovenia. In addition, the hair <strong>of</strong> tannery workers<br />
was also measured for <strong>chromium</strong> content.<br />
3.3.1. Chromium in hair<br />
In Fig. 7 longitudinal <strong>chromium</strong> hair pr<strong>of</strong>iles <strong>of</strong><br />
two tannery workers are illustrated. The solid lines<br />
represent unwashed hair <strong>and</strong> the dotted lines<br />
washed hair, both taken from the same hair bundle.<br />
Tannery workers are exposed to substantial<br />
amounts <strong>of</strong> <strong>chromium</strong> at the workplace <strong>and</strong><br />
elevated levels for blood, urine <strong>and</strong> hair <strong>chromium</strong><br />
have been reported in the literature [32,33]. However.<br />
the hair levels reported differ significantly.<br />
Providing the hair was washed before analysis by<br />
the same procedure [24], the bulk hair <strong>chromium</strong><br />
value will depend strongly (as is evident from<br />
Fig. 7) on the length <strong>of</strong> hair taken for analysis<br />
<strong>and</strong> the <strong>chromium</strong> distribution along the hair<br />
length. Extrapolated "zero length" hair <strong>chromium</strong><br />
values are generally significantly lower in comparison<br />
to the 25 mm length bulk values <strong>and</strong> should be<br />
used as the best estimate <strong>of</strong> the true metabolic<br />
<strong>chromium</strong> value <strong>of</strong> tannery workers. An interesting<br />
feature relating to the difference between washed<br />
<strong>and</strong> unwashed hair can be observed from Fig. 7. It<br />
appears that a substantial amount <strong>of</strong> <strong>chromium</strong><br />
can be washed from the hair by relatively nonaggressive<br />
solvents (a-hexane-ethanol) only from<br />
the proximal part <strong>of</strong> the hair <strong>and</strong> very little or<br />
none from the distal part. Since very few visible<br />
<strong>chromium</strong>-containing particles were identified on<br />
0 10 20 30 40 50 60 70 80<br />
Distance from scalp (mm)<br />
Fig. 9. Longitudinal hair Cr pr<strong>of</strong>iles <strong>of</strong> unwashed children's hair: ¥ x, girls: A, ¥ boys.
the hair surface before washing, the main contribution<br />
to <strong>chromium</strong> incorporated into the hair<br />
structure after hair formation may result from the<br />
secretion <strong>of</strong> the eccrine gl<strong>and</strong>s.<br />
Longitudinal hair <strong>chromium</strong> pr<strong>of</strong>iles <strong>of</strong> occupationally<br />
unexposed subjects (boys <strong>and</strong> girls) illustrated<br />
in Figs. 8 <strong>and</strong> 9 in general display r<strong>and</strong>om<br />
variation <strong>of</strong> hair <strong>chromium</strong> content with distance<br />
from the scalp. However, a pronounced increase in<br />
<strong>chromium</strong> concentration with hair length towards<br />
the distal part may also be observed (see Fig. 91,<br />
but the concentration gradients are significantly<br />
smaller than that found for tannery workers. The<br />
longitudinal <strong>chromium</strong> hair pr<strong>of</strong>iles <strong>of</strong> washed <strong>and</strong><br />
unwashed hair <strong>of</strong> the same subject (Fig. 8) show a<br />
similar pattern, although the washed hair has<br />
somewhat lower <strong>chromium</strong> levels. These findings<br />
are in agreement with the results reported by<br />
Hambidge et al. [34]. The lower <strong>chromium</strong> level<br />
in the distal part <strong>of</strong> the hair <strong>of</strong> the subject in<br />
Fig. 8 may be explained by the different nutritional<br />
intake (tap water <strong>chromium</strong> content) due to the<br />
change <strong>of</strong> habitat. Namely, assuming an average<br />
hair growth rate (15 mm per month) the regions<br />
<strong>of</strong> high <strong>and</strong> low <strong>chromium</strong> hair levels coincide<br />
well with the time intervals subject spent at different<br />
locations. Further work related to this problem<br />
is in progress <strong>and</strong> will be described elsewhere.<br />
3.3.2. Lead in hair<br />
Lead is one <strong>of</strong> the major toxins due to its generally<br />
widespread use (gasoline, paints, <strong>lead</strong> batteries,<br />
etc.) <strong>and</strong> its presence in particular occupational<br />
environments. The appearance <strong>of</strong> acute <strong>and</strong><br />
chronic plumbism has been found to be quite frequent<br />
among children <strong>and</strong> pr<strong>of</strong>essional <strong>lead</strong> workers.<br />
Several clinical features, blood-Pb, urine-Pb<br />
<strong>and</strong> various laboratory measurements have been<br />
0 10 20 30 40 50 60 70 80 90 100<br />
Distance from scalp (mm)<br />
I<br />
Fig. 10. Influence <strong>of</strong> hair washing on variation <strong>of</strong> hair Pb content with distance from scalp: A, resident <strong>of</strong> <strong>lead</strong> smelter area: @, city 1<br />
resident; (--, unwashed hair; - - -, washed hair). I<br />
I
0 10 20 30 40 50 60 70 80 90<br />
Distance from scalp (mm)<br />
Fig. I I. Influence <strong>of</strong> ha~r washing on variation <strong>of</strong> ha~r Cd content with dlstancc from scalp: A, resident <strong>of</strong> <strong>lead</strong> smelter area; a, city<br />
resident: (-. unwashed hair: - - -. washed hair).<br />
employed for diagnostic purposes. Additionally,<br />
determination <strong>of</strong> <strong>lead</strong> in scalp hair was demonstrated<br />
to be a valuable diagnostic tool in mild or<br />
chronic <strong>lead</strong> intoxication [35], <strong>and</strong> in monitoring<br />
human environmental exposure [36]. A reasonable<br />
correlation between blood <strong>and</strong> hair Pb levels was<br />
reported for environmentally exposed persons [36].<br />
In these studies, sectional analysis <strong>of</strong> hair was<br />
also performed to identify the history <strong>of</strong> <strong>lead</strong> intoxication.<br />
The longitudinal hair pr<strong>of</strong>iles were plotted<br />
by measuring sections <strong>of</strong> hair 10-25 mm long<br />
representing a rather coarse resolution. which<br />
thus might produce inaccurate results. The<br />
reported hair <strong>lead</strong> levels (average <strong>of</strong> a definite<br />
length) claimed to be characteristic <strong>of</strong> a normal<br />
subject therefore differ widely <strong>and</strong> are relatively<br />
high.<br />
This paper describes the effect <strong>of</strong> hair washing<br />
(n-hexane-ethanol-water) <strong>and</strong> ambient <strong>lead</strong> level<br />
on longitudinal hair <strong>lead</strong> pr<strong>of</strong>iles. In Fig. 10 variation<br />
<strong>of</strong> hair <strong>lead</strong> content along the hair length is<br />
illustrated for two subjects from urban <strong>and</strong> <strong>lead</strong><br />
smelter residential areas. The yearly (1994) average<br />
levels <strong>of</strong> <strong>lead</strong> in ambient air (particles
3.3.3. Cadmium in hair<br />
Cadmium scalp hair determination has frequently<br />
been reported to be a good indicator <strong>of</strong><br />
environmental or occupational exposure, but this<br />
possibility was not universally accepted [36]. However,<br />
a poor correlation has been found between<br />
hair cadmium <strong>and</strong> cadmium in different <strong>org</strong>ans<br />
(liver, kidney, spleen, lung) <strong>and</strong> therefore hair cadmium<br />
was not considered to be a good index <strong>of</strong><br />
body burden. It should be pointed out that literature<br />
data on hair cadmium (unexposed population)<br />
cover an extremely large range (0.17-5.1 pg g-')<br />
<strong>and</strong> it is reasonable to suspect that not all the data<br />
are correct. Data on hair length used in these analyses<br />
are incomplete, <strong>and</strong> no results on longitudinal<br />
cadmium hair pr<strong>of</strong>iles <strong>of</strong> normal or exposed subjects<br />
are available in the literature.<br />
Longitudinal cadmium hair pr<strong>of</strong>iles <strong>of</strong> children<br />
from two geographical locations were measured by<br />
the proposed technique. The concentration <strong>of</strong> cadmium<br />
in the ambient air at these locations was<br />
practically equal (0.43 pg m-3).<br />
The effect <strong>of</strong> hair washing on longitudinal cadmium<br />
hair pr<strong>of</strong>iles is illustrated in Fig. 11. In contrast<br />
to <strong>lead</strong> (see Fig. 10) cadmium hair pr<strong>of</strong>iles<br />
from both locations show an approximately equal<br />
concentration gradient along the hair str<strong>and</strong>.<br />
Moreover, proximal cadmium hair values are<br />
almost identical, which is compatible with an<br />
equal level <strong>of</strong> environmental cadmium exposure.<br />
Although the washed hair cadmium values seem<br />
to be consistently lower in comparison to<br />
unwashed hair in one case, the latter cannot be<br />
universally accepted. Namely, the difference<br />
between cadmium hair contents <strong>of</strong> washed <strong>and</strong><br />
unwashed hair <strong>of</strong> the second subject (longer<br />
hair) varies tremendously along the hair length<br />
<strong>and</strong> may well be explained by the large variations<br />
in the cadmium content <strong>of</strong> individual hair<br />
[221.<br />
4. Conclusions<br />
Direct atomization <strong>of</strong> solid samples employing a<br />
laboratory assembled electrothermal atomic<br />
absorption spectrometer was demonstrated to be<br />
a feasible approach in the analysis <strong>of</strong> plant tissue<br />
<strong>and</strong> hair samples. A minor modification may be<br />
necessary to perform these analyses on those commercial<br />
instruments which are not specially<br />
designed to h<strong>and</strong>le solid samples. Slurry sample<br />
introduction was found to be a powerful technique<br />
for routine, high accuracy determination <strong>of</strong> trace<br />
elements in botanical <strong>and</strong> hair samples <strong>and</strong> homogeneity<br />
testing. Both the enhanced solubility <strong>of</strong> the<br />
analyte <strong>and</strong> reduction <strong>of</strong> particle size were found to<br />
affect the precision <strong>of</strong> measurement; however, the<br />
latter showed the stronger effect. Generally, no<br />
further improvement in the precision <strong>of</strong> measurement<br />
can be obtained with slurries <strong>of</strong> finely ground<br />
material (D90 6 30 pm) by more complete extraction<br />
<strong>of</strong> the analyte.<br />
Alternatively, the direct sample introduction<br />
approach, was indispensable in the analysis <strong>of</strong><br />
very small samples (
the conventionally employed average trace element<br />
contents <strong>of</strong> the whole hair length,<br />
Acknowledgements<br />
The authors are grateful to the National Science<br />
Foundation <strong>of</strong> Slovenia for a research Grant. The<br />
assistance <strong>of</strong> Miss K. Adamit, Mrs 0. Debevc <strong>and</strong><br />
Mrs H. ~urca in collecting hair samples is gratefully<br />
acknowledged. The authors are also indebted<br />
to Dr. A.R. Byrne for performing comparative<br />
neutron activation analysis, <strong>and</strong> linguistic correction<br />
<strong>of</strong> the manuscript, <strong>and</strong> to Dr. J.B. Dawson for<br />
his interest <strong>and</strong> valuable suggestions during preparation<br />
<strong>of</strong> the manuscript.<br />
References<br />
[I] B.V. L.vov. J. Anal. At. Spectrom . 3 (1988) 9.<br />
[2] W. Slavin <strong>and</strong> D C. Manning, Spectrochin~. Acta Part B.<br />
-37 (1982) 955.<br />
[3] W. Slavin, D.C. Manning <strong>and</strong> G.R. Carnick. Talanta. 36<br />
(1989) 171.<br />
[4] D.V. Brady. J.G. Montalvo. Jr.. J. Jung <strong>and</strong> R.A. Curran.<br />
At. Absorption Ncwslett.. l3(5) ( 1974) I 18.<br />
151 K.O. Olayinka. S.J. Haswcll <strong>and</strong> R. Grzeskowiak. J. Anal.<br />
At. Spcctrom.. I (1986) 297.<br />
[6] F. Fagioli. S. L<strong>and</strong>i. C. Locatclli <strong>and</strong> C. Bigh~. At. Spectrosc..<br />
7(2) ( 1986) 49.<br />
171 L. Ebdon <strong>and</strong> A. Lechotycki. Microchem. J.. 34 (1986) 340<br />
[XI M. Hoenig <strong>and</strong> P. Van Hoeyn~cghen. Anal. Chcm.. 58<br />
(1986) 2614.<br />
[9] L. Ebdon <strong>and</strong> .A. Lechotych. M~crochem. J.. 36 (1987) 207,<br />
1101 L. Ebdon <strong>and</strong> E.H. Evans. J. ,Anal. At. Spectrom.. 2 (1987)<br />
317.<br />
[I I] N. Carrion. Z.A. de Benzo. B. Moreno, A. E~ern<strong>and</strong>c7.<br />
E.J. Eljur~ <strong>and</strong> D. Florcs. .I 'Anal At. Spectrom . -3<br />
(19x8) 479.<br />
P. Jordan. J.M. Ives. G.R. Carnick <strong>and</strong> W. Slavin, At.<br />
Spectrosc.. lCJ(6) ( 1989) 165.<br />
N.J. Miller-1hl1, Spectroch~m. Acta Part B. 44 (1989) 1221.<br />
L. Ebdon. S. Fisher, H.G.M. Parry <strong>and</strong> A.A. Brown, J.<br />
.Anal. At. Spectrom.. 5 (1990) 321.<br />
f-. Dolingek. J. stuPar <strong>and</strong> V. VrKaj. J. Anal. At. Spectrom..<br />
6 (I99 I ) 653.<br />
I.L. Garcia, P. Vlnas <strong>and</strong> M.H. Cordoba. J. Anal. At.<br />
Spectrom.. 7 (1992) 529.<br />
R. Dobrowo1ski <strong>and</strong> J. Mierzwa, Fresenius' Z. Anal.<br />
Chem.. 346 I 1993) 1058<br />
Y.J. Miller-1hI1. J. Anal. At. Spectrom.. 9 (1994) 1129.<br />
N.J. M~llcr-Ihli, Fresenius' Z. Anal. Chem., 337 (1990) 271.<br />
N.J. .Miller-Ihli. Frcsenius' Z. .Anal. Chem., 345 (1993) 482.<br />
G.D. Renshan'. C.A. Pounds <strong>and</strong> E.F. Pearson. Nature,<br />
238 (1972) 162.<br />
G.D. Renshaw, C.A. Pound5 <strong>and</strong> E.F. Pearson. J. Forensic<br />
SCI.. I8 (1973) 143.<br />
J.F. Alder, -4.J. Samuel <strong>and</strong> T.S. West. Anal. Chim. Acta.<br />
87 (1976) 313.<br />
J. Kumpula~ncn. S. Salmela, E. Vuori <strong>and</strong> J. Lchto, Anal.<br />
Ch11n. Acta. I38 (1982) 361.<br />
Y J. .M~ller-Ihli, At. Spectrosc., (XI)(1992) I.<br />
J.A. Holcombe <strong>and</strong> V. Majidi. J. Anal. At. Spectrom., 4<br />
( 1989) 423.<br />
V. Maj~di <strong>and</strong> J.A. Holcombe, Spcctrochim. Acta Part B,<br />
45 (1990) 753.<br />
P.R. Shc~ry <strong>and</strong> P.J. Peterson. J. Exp. Bot.. 25 (1974) 785.<br />
M. Lahouti <strong>and</strong> P.J. Peterson, J. SCI. Food Agric.. 30<br />
( 1979) 136.<br />
[30] V. Ramach<strong>and</strong>ran, T.D. D'Souza <strong>and</strong> K.B. Mistry, J.<br />
Nuclear. Agric. Biol., 9 (1980) 127.<br />
1.311 J.L. Stauber <strong>and</strong> T.M. Florence. Sci. Total En\,lron.. 83<br />
(1989) 85.<br />
[32] J.A. R<strong>and</strong>al <strong>and</strong> R S. Gibson. Br. J. Ind. Mcd.. 46 (1989)<br />
171.<br />
[33] G. Saner, V. Yuzbitsiyan <strong>and</strong> S. Cigdem. Br. J. Ind. Mcd.,<br />
41 ( 1984) 26.3.<br />
[34] K.M. Hambidge. k1.L. Franklin <strong>and</strong> M.A. Jacobs, Am. J.<br />
Clln Nut.. 25 (1972) 380.<br />
1351 L. Kop~to. A.M. Briley <strong>and</strong> H. Shwachman, J. Am. Med.<br />
.Assoc., 209 ( 1969) 243<br />
[36] .4. Chattopadhyay <strong>and</strong> R.E. Jervls. Trace Subst. Environ.<br />
Health, 8 (1974) 31.