Nanoporous carbide-derived carbon with tunable pore size
Nanoporous carbide-derived carbon with tunable pore size
Nanoporous carbide-derived carbon with tunable pore size

Create successful ePaper yourself
Turn your PDF publications into a flip-book with our unique Google optimized e-Paper software.
<strong>Nanoporous</strong> <strong>carbide</strong>-<strong>derived</strong> <strong>carbon</strong> <strong>with</strong><br />
<strong>tunable</strong> <strong>pore</strong> <strong>size</strong><br />
YURY GOGOTSI *1 , ALEXEI NIKITIN 1 , HAIHUI YE 1 , WEI ZHOU 2 , JOHN E. FISCHER 2 , BO YI 3 ,<br />
HENRY C. FOLEY 3 AND MICHEL W. BARSOUM 1<br />
1<br />
Department of Materials Science and Engineering, Drexel University, 3141 Chestnut Street, Philadelphia, Pennsylvania 19104, USA<br />
2<br />
Department of Materials Science and Engineering, University of Pennsylvania, 3231 Walnut Street, Philadelphia, Pennsylvania 19104-6272, USA<br />
3<br />
Department of Chemical Engineering,The Pennsylvania State University, University Park, Pennsylvania 16801, USA<br />
*e-mail: gogotsi@drexel.edu<br />
LETTERS<br />
Published online: 3 August 2003; doi:10.1038/nmat957<br />
a<br />
2.0<br />
Porous solids are of great technological importance due to<br />
their ability to interact <strong>with</strong> gases and liquids not only at the<br />
surface, but throughout their bulk 1 .Although large <strong>pore</strong>s can be<br />
produced and well controlled in a variety of materials 2 , nano<strong>pore</strong>s in<br />
the range of 2 nm and below (micro<strong>pore</strong>s, according to IUPAC<br />
classification) are usually achieved only in <strong>carbon</strong>s or zeolites.To date,<br />
major efforts in the field of porous materials have been directed<br />
towards control of the <strong>size</strong>,shape and uniformity of the <strong>pore</strong>s.Here we<br />
demonstrate that porosity of <strong>carbide</strong>-<strong>derived</strong> <strong>carbon</strong>s (CDCs) 3–9 can<br />
be tuned <strong>with</strong> subångström accuracy in a wide range by controlling the<br />
chlorination temperature.CDC produced from Ti 3 SiC 2 has a narrower<br />
<strong>pore</strong>-<strong>size</strong> distribution than single-wall <strong>carbon</strong> nanotubes or activated<br />
<strong>carbon</strong>s; its <strong>pore</strong>-<strong>size</strong> distribution is comparable to that of zeolites.<br />
CDCs are produced at temperatures from 200–1,200 °C as a powder, a<br />
coating, a membrane or parts <strong>with</strong> near-final shapes, <strong>with</strong> or <strong>with</strong>out<br />
meso<strong>pore</strong>s.They can find applications in molecular sieves,gas storage,<br />
catalysts, adsorbents, battery electrodes, supercapacitors, water/air<br />
filters and medical devices.<br />
Highly crystallized zeolites have a narrow <strong>pore</strong>-<strong>size</strong> distribution, but<br />
discrete <strong>pore</strong> <strong>size</strong>s and the fine-tuning of <strong>pore</strong> <strong>size</strong> are impossible because<br />
the <strong>pore</strong>s of zeolites are controlled by a lattice structure. Porous <strong>carbon</strong>s<br />
produced by thermal decomposition of organic materials may have <strong>pore</strong><br />
diameters 10,11 down to 0.3 nm, or meso<strong>pore</strong>s of several nanometres, but<br />
they typically have a broad <strong>pore</strong>-<strong>size</strong> distribution 12 , which limits their<br />
ability to separate molecules of different <strong>size</strong>s.<br />
To the best of our knowledge,materials <strong>with</strong> a <strong>tunable</strong> <strong>pore</strong> structure<br />
at the atomic level and a narrow <strong>pore</strong>-<strong>size</strong> distribution do not exist. It has<br />
been shown that selective etching of <strong>carbide</strong>s is an attractive technique for<br />
the synthesis of various <strong>carbon</strong> structures from nanotubes 13 to<br />
diamonds 14 .Carbon produced by the extraction ofmetals from <strong>carbide</strong>s 3,4<br />
is called <strong>carbide</strong>-<strong>derived</strong> <strong>carbon</strong> (CDC). Because the rigid metal<br />
<strong>carbide</strong> lattice is used as a template and the metal is extracted layer-bylayer,<br />
atomic-level control can be achieved in the synthesis process<br />
and the <strong>carbon</strong> structure can be templated by the <strong>carbide</strong> structure.<br />
Further structure modification and control can be achieved by varying the<br />
temperature,gas composition,and other process variables.The reaction:<br />
SiC + 2Cl 2 (g) = SiCl 4 (g) + C (1)<br />
b<br />
dV/dlogD<br />
1.6<br />
1.2<br />
0.8<br />
0.4<br />
0.0<br />
0.1<br />
dV/dlogD<br />
D m = 0.64 nm<br />
D m = 0.58 nm<br />
D m = 0.51 nm<br />
0.8<br />
0.4<br />
0.0<br />
300 °C<br />
500 °C<br />
700 °C<br />
1 10 100<br />
Pore <strong>size</strong> (nm)<br />
D m = 0.76 nm 1,100 °C<br />
0.5 1 1.5<br />
Pore <strong>size</strong> (nm)<br />
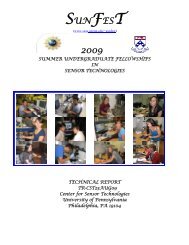
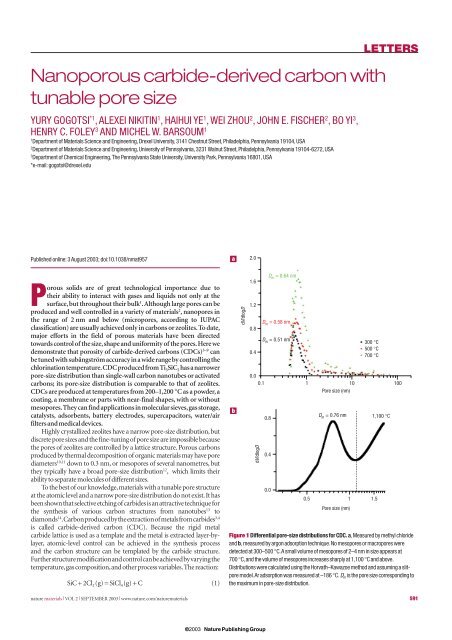
Figure 1 Differential <strong>pore</strong>-<strong>size</strong> distributions for CDC. a,Measured by methyl chloride<br />
and b, measured by argon adsorption technique.No meso<strong>pore</strong>s or macro<strong>pore</strong>s were<br />
detected at 300–500 °C.A small volume of meso<strong>pore</strong>s of 2–4 nm in <strong>size</strong> appears at<br />
700 °C,and the volume of meso<strong>pore</strong>s increases sharply at 1,100 °C and above.<br />
Distributions were calculated using the Horvath–Kawazoe method and assuming a slit<strong>pore</strong><br />
model.Ar adsorption was measured at –186 °C. D m is the <strong>pore</strong> <strong>size</strong> corresponding to<br />
the maximum in <strong>pore</strong>-<strong>size</strong> distribution.<br />
nature materials | VOL 2 | SEPTEMBER 2003 | www.nature.com/naturematerials 591<br />
© 2003 Nature Publishing Group
LETTERS<br />
a<br />
14<br />
12<br />
a<br />
D<br />
c<br />
G<br />
1,589 cm –1<br />
FWHM = 49 cm –1<br />
1,353 cm –1 1,598 cm –1<br />
10<br />
1,200 °C<br />
8<br />
1,100 °C<br />
InI<br />
6<br />
4<br />
2<br />
Intensity (arbitrary units)<br />
1,000 °C<br />
900 °C<br />
800 °C<br />
700 °C<br />
600 °C<br />
d<br />
5 nm<br />
5 nm<br />
0.34 nm<br />
0<br />
0<br />
2 4 6 8 10 12 14 16 18 20<br />
Q 2 (nm –2 )<br />
500 °C<br />
400 °C<br />
cm–1<br />
1,350 cm –11,580<br />
b<br />
m (R g )<br />
100<br />
80<br />
60<br />
40<br />
300 °C<br />
400 °C<br />
600 °C<br />
700 °C<br />
800 °C<br />
1,000 °C<br />
b<br />
1.6<br />
1.4<br />
1.2<br />
300 °C<br />
200 °C<br />
1,000<br />
1,571 cm –1<br />
1,381 cm –1 FWHM = 96 cm –1<br />
1,200 1,400 1,600 1,800<br />
Wavenumber (cm –1 )<br />
e<br />
20<br />
1,200 °C<br />
I D /I G<br />
1.0<br />
0.8<br />
c<br />
0<br />
1<br />
2 3 4 5 6<br />
R g (nm)<br />
0.6<br />
0.4<br />
I II III IV<br />
200 400 600 800 1,000 1,200<br />
Temperature (°C)<br />
5 nm<br />
Pore <strong>size</strong> (nm)<br />
0.8<br />
0.7<br />
0.6<br />
0.5<br />
SAXS<br />
CH 3 Cl adsorption<br />
Ar adsorption<br />
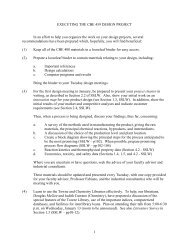
Figure 3 Raman spectra and transmission electron microscope (TEM) images of<br />
CDC produced at different temperatures. a, Raman spectra of CDC synthe<strong>size</strong>d at<br />
different temperatures. b,The temperature dependence of the ratio of the intensities<br />
of disorder-induced D band and graphite G band (I D /I G ). c–e,TEM images showing<br />
evolution of the <strong>carbon</strong> structure <strong>with</strong> temperature: c, 1,200 °C, d, 700 °C, e, 300 °C.<br />
CDC produced in temperature range I (300 °C; see part b) is completely amorphous.<br />
Slow <strong>pore</strong> growth occurs in range II. Formation of <strong>carbon</strong> fringes at 700 °C and higher<br />
temperatures shows the beginning of the structure ordering leading to increasing <strong>pore</strong><br />
<strong>size</strong> and appearance of meso<strong>pore</strong>s in range III. Pronounced graphitization is observed<br />
at 1,200 °C (range IV), resulting in a sharper G-band in the Raman spectrum and<br />
decreased I d /I g ratio.<br />
400 600 800 1,000 1,200<br />
Temperature of chlorination (°C)<br />
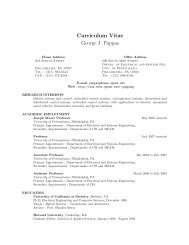
Figure 2 Dependences of the radius of gyration (R g ) and <strong>pore</strong> <strong>size</strong> on chlorination<br />
temperature. a, Experimental small-angle X-ray scattering (SAXS) curves in Guinier<br />
coordinates. b, Distribution of gyration radius m(R g ). c, Comparison of <strong>pore</strong> <strong>size</strong>s<br />
obtained by CH 3 Cl sorption and SAXS for different chlorination temperatures of Ti 3 SiC 2 .<br />
No <strong>pore</strong>s <strong>with</strong> R g larger than 0.6 nm were detected by SAXS.The SAXS-<strong>derived</strong> R g at<br />
600 °C is 0.53 nm, and the sorption-based D m (average of 500 °C and 700 °C values) is<br />
0.61 nm.Taking the latter as the height of slit <strong>pore</strong>s, the implied radius R is 0.71 nm,<br />
comparable to the radii of slit-shaped nano<strong>pore</strong>s in polymer-<strong>derived</strong> materials 12 .<br />
Thus, slit <strong>pore</strong>s have been formed in CDC. Extremely fine tuning of <strong>pore</strong> <strong>size</strong>s is possible<br />
between 300 °C and 800 °C.At higher temperatures, growth of meso<strong>pore</strong> volume<br />
occurs at the expense of nano<strong>pore</strong>s.<br />
has been used for the production of silicon tetrachloride since 1918 6 ,<br />
but the remaining <strong>carbon</strong> was usually burned. The linear reaction<br />
kinetics of the reaction (1) 5 allows transformations to large depth,<br />
until the particle or component is completely converted to <strong>carbon</strong>.<br />
The transformation is conformal and does not lead to changes in<br />
sample <strong>size</strong> or shape.<br />
Various CDCs have been investigated by several groups and specific<br />
surface areas (SSA) of up to 2,000 m 2 g –1 <strong>with</strong> small <strong>pore</strong> <strong>size</strong>s have been<br />
reported 4,7–9 . Comparison of literature data on CDCs shows that, for<br />
different <strong>carbide</strong>s (SiC,TiC,ZrC,B 4 C,TaC and Mo 2 C) and chlorination<br />
temperatures, <strong>pore</strong>s between 0.8 and 2.1 nm, determined by the<br />
structure of the <strong>carbide</strong> precursor and process parameters, were<br />
produced. However, no control over the <strong>pore</strong> <strong>size</strong> or distribution has<br />
been reported. The objective of this work is to demonstrate <strong>pore</strong>-<strong>size</strong><br />
tuning in CDCs by controlling the synthesis temperature.<br />
592 nature materials | VOL 2 | SEPTEMBER 2003 | www.nature.com/naturematerials<br />
© 2003 Nature Publishing Group
LETTERS<br />
This study was conducted on Ti 3 SiC 2 powders and bulk samples.<br />
Ti 3 SiC 2 is a soft ceramic <strong>with</strong> a lamellar structure (Supplementary<br />
Information, Fig. S1) that is commercially available and can easily be<br />
machined to any shape 15 . Etching of Ti 3 SiC 2 can generate a larger <strong>pore</strong><br />
volume (~75%) compared <strong>with</strong> TiC or SiC (56.2% and 57.3%,<br />
respectively; Supplementary Information, Table S1). Its interaction<br />
<strong>with</strong> chlorine,Cl 2 ,has not been reported in the literature.<br />
Chlorination in a flow of pure Cl 2 for 3 hours in a quartz-tube<br />
furnace results in extraction of Ti and Si from Ti 3 SiC 2 leading to the<br />
formation of <strong>carbon</strong> by the reaction:<br />
Ti 3 SiC 2 + 8Cl 2 (g) = SiCl 4 (g) + 3TiCl 4 (g) + 2C (2)<br />
Four different techniques were independently used to measure the <strong>pore</strong><br />
<strong>size</strong>: Ar, N 2 and methyl chloride (CH 3 Cl) sorption, as well as small-angle<br />
X-ray scattering (SAXS), as described in the Methods. As can be seen in<br />
Fig. 1, <strong>pore</strong> <strong>size</strong>s of CDCs increase <strong>with</strong> increasing temperature.<br />
The sorption isotherms of low-temperature CDCs (up to 600 °C)<br />
obtained using N 2 ,Ar,or,CH 3 Cl (Supplementary Information, Fig. S2),<br />
were of type I in the Brunauer classification 12 , which is evidence of the<br />
presence of nano<strong>pore</strong>s and the absence of meso- or macro<strong>pore</strong>s.This is in<br />
agreement <strong>with</strong> the differential <strong>pore</strong>-<strong>size</strong> distributions shown in Fig. 1a.<br />
Very small <strong>pore</strong> <strong>size</strong>s were achieved at low temperatures; just slightly<br />
larger than the interplanar spacing in graphite (0.3354nm).What is even<br />
more impressive is the fact that the <strong>pore</strong>-<strong>size</strong> distributions are very<br />
narrow (Fig. 1a) and close to those of,for example,VPI-5 zeolite 1 .<br />
Isotherms of CDCs produced above 700 °C were of type IV,which<br />
indicates the presence of meso<strong>pore</strong>s.Total <strong>pore</strong> volumes observed for<br />
the samples produced at 700, 900 and 1,100 °C were almost the same,<br />
but the <strong>pore</strong>-<strong>size</strong> distributions were different: meso<strong>pore</strong> volume<br />
and <strong>size</strong> increased <strong>with</strong> increasing chlorination temperatures.<br />
Their equivalent radius was less than 3 nm at 700 °C (Fig. 1a) and<br />
about 6 nm at 1,100 °C (Fig. 1b). Weight loss and energy-dispersive<br />
X-ray spectroscopy (EDS) analysis of the samples after chlorination<br />
suggested almost complete removal of Ti and Si above 400 °C.<br />
Because the CDCs retained the original volume of the <strong>carbide</strong><br />
precursor,it is fair to assume the total <strong>pore</strong> volume to be the same after<br />
chlorination at different temperatures. The maximum <strong>pore</strong> volume<br />
of ~0.64 cm 3 g –1 accessible to Ar and N 2 in CDC after heat-treatment<br />
at 700–1,200 °C is in agreement <strong>with</strong> the theoretically calculated<br />
value of 0.645 cm 3 g –1 .<br />
SAXS measurements confirm the evolution of <strong>pore</strong> <strong>size</strong> <strong>with</strong><br />
increasing processing temperature. In Fig. 2, we plot the data for seven<br />
samples spanning the range between 300 °C and 1,200 °C. The results<br />
have been corrected for background and scattering by the quartz<br />
container. We observe almost monodisperse Guinier behaviour,<br />
log (I)~–Q 2 (R g ) 2 /3 over a broad range of Q 2 (Fig. 2a), where I is the<br />
intensity, and R g is the radius of gyration, as shown by the fact that<br />
the analysis using a technique described elsewhere 16 gives a very narrow<br />
peak in m(R g ) which accounts for most of the nano<strong>pore</strong> volume<br />
(Fig.2b).The interpretation of R g (Fig. 2c) depends on the shape of the<br />
nano<strong>pore</strong>s. In the analysis of the CH 3 Cl sorption data we assumed slit<br />
<strong>pore</strong>s, which implies that the <strong>size</strong>s in Fig. 1 are associated <strong>with</strong> the<br />
height of the slits. Slit <strong>pore</strong>s are the logical choice, given the layered<br />
nature of the precursor material (Supplementary Information,<br />
Fig.S1).For slit <strong>pore</strong>s approximated as cylinders of radius R and height<br />
D,R g2 =D 2 /12+R 2 /2.SAXS confirms the aforementioned sorption data<br />
and shows that <strong>pore</strong> <strong>size</strong> can be controlled <strong>with</strong> better than 0.05 nm<br />
accuracy (Fig. 2c), which, to our knowledge, has never been<br />
demonstrated for any other porous material.<br />
A kinetic model of self-organization in the formation of nano<strong>pore</strong>s<br />
during chlorination of SiC has been proposed 8 .It can be used to describe<br />
the formation of the ordered nanoporous <strong>carbon</strong> from Ti 3 SiC 2 .<br />
With increasing temperature, the specific jump distance of <strong>carbon</strong><br />
atoms increases and the <strong>pore</strong> <strong>size</strong> increases accordingly.<br />
a<br />
Edge plain<br />
Basal plain<br />
2 µm Ti 3 SiC 2 2 µm<br />
Microstructural studies of CDCs were conducted to explain their<br />
structural reorganization and the development of their porous<br />
structure <strong>with</strong> temperature.Raman spectroscopy (Fig. 3a,b) shows that<br />
<strong>carbon</strong> already forms at 200 °C. However, X-ray diffraction (XRD)<br />
shows peaks of the initial <strong>carbide</strong>; thus the transformation was not<br />
complete at this temperature. A low position of the G-band and<br />
upshifted D-band in the Raman spectrum (Fig. 3a) may be the result of<br />
<strong>carbon</strong> bonding to Si and significant sp 3 hybridization of <strong>carbon</strong> 17 .<br />
Si (
LETTERS<br />
It is notable that CDCs do not have macroporosity if produced<br />
from a dense ceramic (Fig. 4) or a <strong>carbide</strong> single crystal. However, a<br />
controlled amount of macroporosity can be introduced by using<br />
sintered porous ceramics.Macroporosity or mesoporosity that appear<br />
at high chlorination temperatures is not desirable for molecular-sieve<br />
membranes, but would be necessary for catalytic and some other<br />
applications, because it allows easier access to nano<strong>pore</strong>s.<br />
Based on their <strong>tunable</strong> porous structures, controlled surface<br />
chemistry, and other properties, CDCs may be used for some<br />
applications where single-wall <strong>carbon</strong> nanotubes are currently<br />
considered 22 .For example,CDC is an attractive material for electrodes<br />
for electrochemical double-layer capacitors commonly called<br />
‘supercapacitors’ 23 , because the <strong>pore</strong>-<strong>size</strong> distribution can be tuned to<br />
match various electrolytes.<br />
Finally, it is known that hydrogen uptake depends on the porous<br />
structure of the adsorbent. The highest uptake was achieved in<br />
nanoporous <strong>carbon</strong>s <strong>with</strong> SSA above 1,000 m 2 g –1 and almost no<br />
meso<strong>pore</strong>s 24,25 . CDCs produced at 600 °C and 1,100 °C have SSA of<br />
1,061 m 2 g –1 and 1,431 m 2 g –1 ,respectively,and SSA of up to 2,000 m 2 g –1<br />
has been measured for SiC- and B 4 C-<strong>derived</strong> CDC. Our ability to tune<br />
the <strong>pore</strong> <strong>size</strong> to exactly fit the hydrogen (or other gas) molecule may be<br />
of principal importance for gas storage applications.About 40 wt% Cl 2<br />
is trapped in CDCs produced at 300–400 °C at room temperature and<br />
ambient pressure, if the cooling is done in argon, and it can reach<br />
55–60 wt% when cooled in Cl 2 . The amount of Cl 2 stored decreases<br />
<strong>with</strong> increasing <strong>pore</strong> <strong>size</strong>, reaching less than 5 wt% at 1,200 °C<br />
(Supplementary Information, Fig. S3). The stored chlorine is slowly<br />
released, and its amount goes down to ~20 wt% after storage for ten<br />
days in open air. Fast release of atomic chlorine is observed on heating<br />
in helium up to 600°C at 10°Cmin –1 .Attempts to measure SSA of CDC<br />
produced at 300 °C by the BET method resulted in the unreasonably<br />
low values of 162 m 2 g –1 for N 2 and 382 m 2 g –1 for Ar. This clearly shows<br />
the selectivity of CDC to different gases. A significant volume of<br />
nano<strong>pore</strong>s inaccessible to large molecules may allow for the separation<br />
of hydrogen from N 2 and other gases. It is also worth noting that the<br />
combination of near-final shape and very mild chlorination<br />
temperatures are not only unique to Ti 3 SiC 2 , but also bode well for the<br />
inexpensive mass production of CDC components, which, unlike<br />
zeolites, can have a large <strong>size</strong> and complex shape.<br />
METHODS<br />
The total <strong>pore</strong> volume and average <strong>pore</strong> <strong>size</strong> were calculated from Ar and CH 3 Cl adsorption isotherms<br />
according to Horvath–Kawazoe theory. Specific surface area—according to BET (Brunauer, Emmet and<br />
Teller) theory and nano<strong>pore</strong> volume—was calculated by using t-plots based on the CH 3 Cl or Ar sorption<br />
isotherms. Nitrogen adsorption did not produce reliable results on samples <strong>with</strong> a <strong>pore</strong> <strong>size</strong> smaller than<br />
1 nm. Ar adsorption (Micromeretics ASAP Pore Analyzer) was used to measure <strong>pore</strong> <strong>size</strong>s above and<br />
under 1 nm, but the technique required long periods of time (5 days) for equilibration and could not<br />
produce the full distribution when the <strong>pore</strong> <strong>size</strong> approached 0.5 nm. The methyl chloride adsorption<br />
isotherms 26 were used to measure the <strong>pore</strong> <strong>size</strong> below 0.7 nm assuming a slit <strong>pore</strong> shape.<br />
Small-angle X-ray scattering (SAXS) was performed on a multi-angle diffractometer equipped <strong>with</strong> a<br />
Cu rotating anode, double-focusing optics, evacuated flight path and two-dimensional wire detector.<br />
Data were collected over the Q range 0.005–1.4 Å –1 . Powder samples were loaded into 1.5-mm-diameter<br />
quartz capillary tubes and measured in transmission for 1 hour. The scattering intensity from an empty<br />
capillary was then collected and subtracted <strong>with</strong> sample absorption corrected. Expecting a finite but<br />
narrow distribution of radii of gyration R g , we used a modified Guinier analysis to obtain the mean <strong>pore</strong><br />
<strong>size</strong> and distribution 16 . The fraction volume of <strong>pore</strong>s of a given <strong>size</strong> was then estimated for each sample.<br />
By deconvoluting the experimental ln(I) versus Q 2 curves into components corresponding to <strong>pore</strong>s <strong>with</strong><br />
different R g , distribution functions of R g were found.<br />
Raman microspectroscopy (Renishaw 1000, Ar ion laser, 514.5 nm), transmission electron microscopy<br />
(TEM, JEOL 2010F), energy-dispersive spectroscopy (EDS) and X-ray diffraction (XRD, Siemens), were<br />
used to study the structure of CDC powders. The in-plane crystal <strong>size</strong> of graphite L a (nm) was calculated by<br />
the Tuinstra and Koenig equation 27 : 0.44/L a = I D /I G ,where I D and I G are intensities of disorder-induced D<br />
band and graphite G band, assigned to zone centre phonons of E 2g symmetry 17 .<br />
Received 11 March 2003; accepted 10 July 2003; published 3 August 2003.<br />
References<br />
1. Davis, M. E. Ordered porous materials for emerging applications. Nature 417, 813–821 (2002).<br />
2. Joo, S. H. et al. Ordered nanoporous arrays of <strong>carbon</strong> supporting high dispersions of platinum<br />
nanoparticles. Nature 412, 169–172 (2001).<br />
3. Gogotsi, Y. G. & Yoshimura, M. Formation of <strong>carbon</strong> films on <strong>carbide</strong>s under hydrothermal<br />
conditions. Nature 367, 628–630 (1994).<br />
4. Gogotsi, Y. G., Jeon, J. D. & McNallan, M. J. Carbon coatings on silicon <strong>carbide</strong> by reaction <strong>with</strong><br />
chlorine-containing gases. J. Mater. Chem. 7, 1841–1848 (1997).<br />
5. Ersoy, D., McNallan, M. J. & Gogotsi, Y. G. Carbon coatings produced by high temperature<br />
chlorination of silicon <strong>carbide</strong> ceramics. Mater. Res. Innov. 5, 55–62 (2001).<br />
6. Hutchins, O. Method for the production of silicon tetrachlorid. US patent 1,271,713 (1918).<br />
7. Boehm, H. P. & Warnecke, H. H. in Proc. 12th Biennial Conf. Carbon 149–150 (Pergamon, Oxford,<br />
1975).<br />
8. Gordeev, S. K., Kukushkin, S. A., Osipov, A. V. & Pavlov, Y. V. Self-organization in the formation of a<br />
nanoporous <strong>carbon</strong> material. Phys. Solid State 42, 2314–2317 (2000).<br />
9. Fedorov, N. F. Untraditional solutions in chemical technology of <strong>carbon</strong> adsorbents. Russ. Chem. J. 39,<br />
73–83 (1995).<br />
10. Claye, A. & Fischer, J. E. Short-range order in disordered <strong>carbon</strong>s: where does the Li go? Electrochim.<br />
Acta 45, 107–120 (1999).<br />
11. Shiflett, M. B. & Foley, H. C. Ultrasonic deposition of high-selectivity nanoporous <strong>carbon</strong><br />
membranes. Science 285, 1902–1905 (1999).<br />
12. Rodriguez-Reinoso, F. & Sepulveda-Escribano, A. in Handbook of Surfaces and Interfaces of Materials<br />
(ed. Nalwa, H. S.) 309–355 (Academic, San Diego, 2001).<br />
13. Derycke, V., Martel, R., Radosavljević, M., Ross, F. M. & Avouris, P. Catalyst-free growth of ordered<br />
single-walled <strong>carbon</strong> nanotube networks. Nano Lett. 2, 1043–1046 (2002).<br />
14. Gogotsi, Y., Welz, S., Ersoy, D. A. & McNallan, M. J. Conversion of silicon <strong>carbide</strong> to crystalline<br />
diamond-structured <strong>carbon</strong> at ambient pressure. Nature 411, 283–287 (2001).<br />
15. Barsoum, M. W. The M n+1 AX n phases: a new class of solids. Prog. Solid State Chem 28, 201–281 (2000).<br />
16. Kyutt, R. N., Smorgonskaya, E. A., Danishevski, A. M., Gordeev, S. K. & Grechinskaya, A. V. Structural<br />
study of nanoporous <strong>carbon</strong> produced from polycrystalline <strong>carbide</strong> materials: small-angle X-ray<br />
scattering. Phys. Solid State 41, 1359–1363 (1999).<br />
17. Ferrari, A. C. & Robertson, J. Interpretation of Raman spectra of disordered and amorphous <strong>carbon</strong>.<br />
Phys.Rev.B61, 14095–14107 (2000).<br />
18. El-Raghy, T. & Barsoum, M. W. Diffusion kinetics of the carburization and silicidation of Ti 3 SiC 2 . J.<br />
Appl. Phys. 83, 112–119 (1998).<br />
19. Leis, J., Perkson, A., Arulepp, M., Nigu, P. & Svensson, G. Catalytic effect of metals of the iron<br />
subgroup on the chlorination of titanium <strong>carbide</strong> to form nanostructural <strong>carbon</strong>. Carbon 40,<br />
1559–1564 (2002).<br />
20. Gogotsi, Y. et al. Formation of <strong>carbon</strong> coatings on SiC fibers by selective etching in halogens and<br />
supercritical water. Ceram. Eng. Sci. Proc. 19, 87–94 (1998).<br />
21. Yanul’, N. A. et al. <strong>Nanoporous</strong> <strong>carbon</strong> materials <strong>with</strong> varied porosity and specific features of their<br />
interaction <strong>with</strong> water. Russ. J. Appl. Chem. 72, 2159–2163 (1999).<br />
22. Baughman, R. H., Zakhidov, A. A. & de Heer, W. A. Carbon nanotubes - the route toward<br />
applications. Science 297, 787–792 (2002).<br />
23. Burke, A. Ultracapacitors: why, how, and where is the technology? J. Power Sources 91, 37–50 (2000).<br />
24. Nijkamp, M. G., Raaymakers, J. E. M. J., van Dillen, A. J. & de Jong, K. P. Hydrogen storage using<br />
physisorbtion — materials demands. Appl. Phys. A. 72, 619–623 (2001).<br />
25. Schlapbach, L. & Züttel, A. Hydrogen-storage materials for mobile applications. Nature 414, 353–358<br />
(2001).<br />
26. Mariwala, R. K. & Foley, H. C. Calculation of micro<strong>pore</strong> <strong>size</strong>s in carbogenic materials from the methyl<br />
chloride adsorption isotherm. Ind. Eng. Chem. Res. 33, 2314–2321 (1994).<br />
27. Tuinstra, F. & Koenig, J. L. Raman spectrum of graphite. J. Chem. Phys. 53, 1126–1130 (1970).<br />
Acknowledgements<br />
Thanks are due to W.-H. Shih, Drexel University, for help <strong>with</strong> nitrogen BET measurements. The work at<br />
Drexel University was supported by the Defence Advanced Research Projects Agency through an Office of<br />
Naval Research (ONR) contract. The TEM used is operated by the Regional Materials Characterization<br />
Facility at the University of Pennsylvania. Purchase of the Raman spectrometer and SEM were supported<br />
by National Science Foundation (NSF) grants DMR-0116645 and BES-0216343. The work at<br />
Pennsylvania State University was supported by ONR grant N00014-00-1-0720 and NSF grant DMR-<br />
0103585. M.B. was supported by NSF grant DMR-0072067.<br />
Correspondence and requests for materials should be addressed to Y.G.<br />
Supplementary Information accompanies the paper on http://www.nature.com/naturematerials<br />
Competing financial interests<br />
The authors declare that they have no competing financial interests.<br />
594 nature materials | VOL 2 | SEPTEMBER 2003 | www.nature.com/naturematerials<br />
© 2003 Nature Publishing Group