articles - the School of Engineering and Applied Science - University ...
articles - the School of Engineering and Applied Science - University ...
articles - the School of Engineering and Applied Science - University ...

You also want an ePaper? Increase the reach of your titles
YUMPU automatically turns print PDFs into web optimized ePapers that Google loves.
ARTICLES<br />
a<br />
0.5<br />
0.4<br />
0.3<br />
0.2<br />
0.1<br />
0<br />
–60 –40 –20 0 20 40 60<br />
Distance from <strong>the</strong> bilayer centre (Å)<br />
b<br />
0.54<br />
Slope = 0.67<br />
Hydrophobic density<br />
10<br />
0.5<br />
EO 10 EE 9<br />
EO 19 EE I8<br />
EO 29 EE 28<br />
EO 40 EE 37<br />
EO 56 EE 60<br />
EO 73 EE 71<br />
Lipid<br />
τ (dyn cm –1 )<br />
20<br />
0<br />
–20<br />
k a ≈ 152<br />
Simulation<br />
EO m EE n<br />
Experiment<br />
m = 10,<br />
m = 29,<br />
m = 40,<br />
m = 56,<br />
m = 73,<br />
m = 30,<br />
m = 80,<br />
m = 150,<br />
Lipid<br />
n = 9<br />
n = 28<br />
n = 37<br />
n = 60<br />
n = 71<br />
n = 40<br />
n = 125<br />
n = 250<br />
–0.1 0 0.1 0.2<br />
∆ A /A O<br />
{<br />
{<br />
d (nm)<br />
1<br />
1<br />
MW phob (kDa)<br />
Experiment<br />
Simulation<br />
Lipid<br />
10<br />
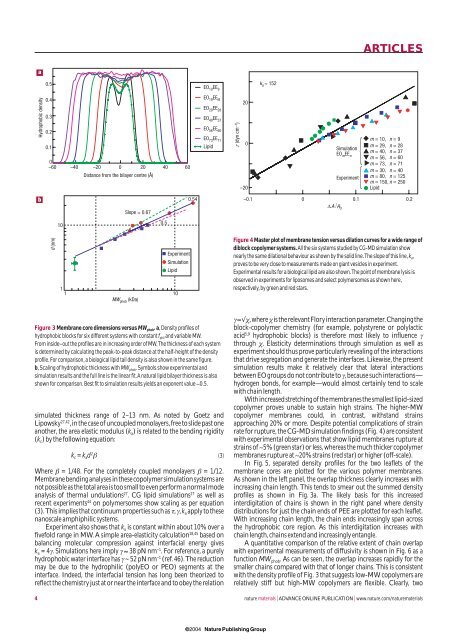
Figure 4 Master plot <strong>of</strong> membrane tension versus dilation curves for a wide range <strong>of</strong><br />
diblock copolymer systems.All <strong>the</strong> six systems studied by CG-MD simulation show<br />
nearly <strong>the</strong> same dilational behaviour as shown by <strong>the</strong> solid line.The slope <strong>of</strong> this line,k a ,<br />
proves to be very close to measurements made on giant vesicles in experiment.<br />
Experimental results for a biological lipid are also shown.The point <strong>of</strong> membrane lysis is<br />
observed in experiments for liposomes <strong>and</strong> select polymersomes as shown here,<br />
respectively,by green <strong>and</strong> red stars.<br />
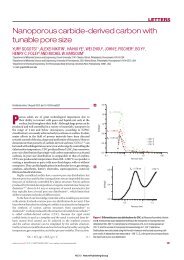
Figure 3 Membrane core dimensions versus MW phob .a,Density pr<strong>of</strong>iles <strong>of</strong><br />
hydrophobic blocks for six different systems with constant f phil <strong>and</strong> variable MW.<br />
From inside–out <strong>the</strong> pr<strong>of</strong>iles are in increasing order <strong>of</strong> MW.The thickness <strong>of</strong> each system<br />
is determined by calculating <strong>the</strong> peak-to-peak distance at <strong>the</strong> half-height <strong>of</strong> <strong>the</strong> density<br />
pr<strong>of</strong>ile.For comparison,a biological lipid tail density is also shown in <strong>the</strong> same figure.<br />
b,Scaling <strong>of</strong> hydrophobic thickness with MW phob .Symbols show experimental <strong>and</strong><br />
simulation results <strong>and</strong> <strong>the</strong> full line is <strong>the</strong> linear fit.A natural lipid bilayer thickness is also<br />
shown for comparison.Best fit to simulation results yields an exponent value ∼0.5.<br />
simulated thickness range <strong>of</strong> 2–13 nm. As noted by Goetz <strong>and</strong><br />
Lipowsky 27,42 ,in <strong>the</strong> case <strong>of</strong> uncoupled monolayers,free to slide past one<br />
ano<strong>the</strong>r, <strong>the</strong> area elastic modulus (k a ) is related to <strong>the</strong> bending rigidity<br />
(k c ) by <strong>the</strong> following equation:<br />
k c = k a d 2 β (3)<br />
Where β = 1/48. For <strong>the</strong> completely coupled monolayers β = 1/12.<br />
Membrane bending analyses in <strong>the</strong>se copolymer simulation systems are<br />
not possible as <strong>the</strong> total area is too small to even perform a normal mode<br />
analysis <strong>of</strong> <strong>the</strong>rmal undulations 27 . CG lipid simulations 27 as well as<br />
recent experiments 44 on polymersomes show scaling as per equation<br />
(3).This implies that continuum properties such as τ,γ,k a apply to <strong>the</strong>se<br />
nanoscale amphiphilic systems.<br />
Experiment also shows that k a is constant within about 10% over a<br />
fivefold range in MW. A simple area-elasticity calculation 18,45 based on<br />
balancing molecular compression against interfacial energy gives<br />
k a =4γ. Simulations here imply γ ≈ 38 pN nm –1 . For reference, a purely<br />
hydrophobic water interface has γ ~ 52 pN nm –1 (ref.46).The reduction<br />
may be due to <strong>the</strong> hydrophilic (polyEO or PEO) segments at <strong>the</strong><br />
interface. Indeed, <strong>the</strong> interfacial tension has long been <strong>the</strong>orized to<br />
reflect <strong>the</strong> chemistry just at or near <strong>the</strong> interface <strong>and</strong> to obey <strong>the</strong> relation<br />
γ≈√χ,where χis <strong>the</strong> relevant Flory interaction parameter.Changing <strong>the</strong><br />
block-copolymer chemistry (for example, polystyrene or polylactic<br />
acid 5,9 hydrophobic blocks) is <strong>the</strong>refore most likely to influence γ<br />
through χ. Elasticity determinations through simulation as well as<br />
experiment should thus prove particularly revealing <strong>of</strong> <strong>the</strong> interactions<br />
that drive segregation <strong>and</strong> generate <strong>the</strong> interfaces. Likewise, <strong>the</strong> present<br />
simulation results make it relatively clear that lateral interactions<br />
between EO groups do not contribute to γ,because such interactions—<br />
hydrogen bonds, for example—would almost certainly tend to scale<br />
with chain length.<br />
With increased stretching <strong>of</strong> <strong>the</strong> membranes <strong>the</strong> smallest lipid-sized<br />
copolymer proves unable to sustain high strains. The higher-MW<br />
copolymer membranes could, in contrast, withst<strong>and</strong> strains<br />
approaching 20% or more. Despite potential complications <strong>of</strong> strain<br />
rate for rupture,<strong>the</strong> CG-MD simulation findings (Fig. 4) are consistent<br />
with experimental observations that show lipid membranes rupture at<br />
strains <strong>of</strong> ∼5% (green star) or less,whereas <strong>the</strong> much thicker copolymer<br />
membranes rupture at ∼20% strains (red star) or higher (<strong>of</strong>f-scale).<br />
In Fig. 5, separated density pr<strong>of</strong>iles for <strong>the</strong> two leaflets <strong>of</strong> <strong>the</strong><br />
membrane cores are plotted for <strong>the</strong> various polymer membranes.<br />
As shown in <strong>the</strong> left panel, <strong>the</strong> overlap thickness clearly increases with<br />
increasing chain length. This tends to smear out <strong>the</strong> summed density<br />
pr<strong>of</strong>iles as shown in Fig. 3a. The likely basis for this increased<br />
interdigitation <strong>of</strong> chains is shown in <strong>the</strong> right panel where density<br />
distributions for just <strong>the</strong> chain ends <strong>of</strong> PEE are plotted for each leaflet.<br />
With increasing chain length, <strong>the</strong> chain ends increasingly span across<br />
<strong>the</strong> hydrophobic core region. As this interdigitation increases with<br />
chain length,chains extend <strong>and</strong> increasingly entangle.<br />
A quantitative comparison <strong>of</strong> <strong>the</strong> relative extent <strong>of</strong> chain overlap<br />
with experimental measurements <strong>of</strong> diffusivity is shown in Fig. 6 as a<br />
function MW phob . As can be seen, <strong>the</strong> overlap increases rapidly for <strong>the</strong><br />
smaller chains compared with that <strong>of</strong> longer chains. This is consistent<br />
with <strong>the</strong> density pr<strong>of</strong>ile <strong>of</strong> Fig. 3 that suggests low-MW copolymers are<br />
relatively stiff but high-MW copolymers are flexible. Clearly, two<br />
4 nature materials | ADVANCE ONLINE PUBLICATION | www.nature.com/naturematerials<br />
© 2004 Nature Publishing Group