

Total marine fisheries extractions by country in the Baltic Sea
Total marine fisheries extractions by country in the Baltic Sea
Total marine fisheries extractions by country in the Baltic Sea

You also want an ePaper? Increase the reach of your titles
YUMPU automatically turns print PDFs into web optimized ePapers that Google loves.
Catch (t)<br />
Catch ( t x 10 3 )<br />
<strong>Total</strong> <strong>mar<strong>in</strong>e</strong> <strong>fisheries</strong> <strong>extractions</strong> <strong>by</strong> <strong>country</strong> <strong>in</strong> <strong>the</strong> <strong>Baltic</strong> <strong>Sea</strong>: 1950-present, Ross<strong>in</strong>g, Booth and Zeller 71<br />
Herr<strong>in</strong>g was estimated to have <strong>the</strong> highest<br />
amount of discards, total<strong>in</strong>g 136,333 t from<br />
1950-2007, and account<strong>in</strong>g for<br />
approximately 6% of our reconstructed<br />
herr<strong>in</strong>g catch. From 1950-1994, herr<strong>in</strong>g<br />
discards averaged 2,351 t·year -1 , and this<br />
<strong>in</strong>creased <strong>in</strong> <strong>the</strong> latter part of <strong>the</strong> time period<br />
to an average of approximately 4,100 t·year -1<br />
from 1995-2007. Sprat was <strong>the</strong> next largest<br />
contributor to total discards, with a total of 87,526 t over <strong>the</strong> entire time period, account<strong>in</strong>g for<br />
approximately 6% of our reconstructed sprat catch. There were two periods of lower sprat discards, with<br />
an average of 370 t·year -1 from 1950-1964, and an average of 674 t·year -1 from 1980-1995. Time periods of<br />
higher sprat discards were from 1965-1979,<br />
when <strong>the</strong> average was 1,825 t annually, and<br />
1996-2007, when <strong>the</strong> average was 3,652<br />
t·year -1 . Sprat discards peaked <strong>in</strong> 2005 at<br />
4,918 t. The group ‗o<strong>the</strong>rs‘ contributed a<br />
total of 9,597 t over <strong>the</strong> time period<br />
(account<strong>in</strong>g for 4.2% of our reconstructed<br />
total), and peaked at 357 t <strong>in</strong> 1968. Cod<br />
discards, approximately 3% of total<br />
discards, totaled 6,701 t over <strong>the</strong> time<br />
period. From 1979-1987, cod discards were<br />
significantly higher than <strong>the</strong> rest of <strong>the</strong><br />
time period, with average annual discards<br />
of 535 t (with a peak of 818 t <strong>in</strong> 1983).<br />
Prior to this, cod discards averaged 14 t<br />
annually, and from 1988-2007 averaged 74<br />
t annually. Flatfish discards had <strong>the</strong> second<br />
lowest tonnage, and accounted for 5% of<br />
our reconstructed flatfish catch. Flatfish<br />
discards totaled 2,949 t from 1950-2007,<br />
and from 1950-1995 averaged 41 t<br />
annually. This <strong>in</strong>creased to an average of<br />
87 t·year -1 for <strong>the</strong> rest of <strong>the</strong> time period<br />
(with a peak of 112 t <strong>in</strong> 2002). Salmon<br />
discards were estimated to be <strong>the</strong> smallest<br />
contributor to discards, yet were <strong>the</strong><br />
highest percentage of discards relative to<br />
total reconstructed catch at an estimated<br />
243,635 t from 1950-2007. At <strong>the</strong> beg<strong>in</strong>n<strong>in</strong>g of <strong>the</strong> time series, discards were estimated to be 1,095 t. This<br />
was followed <strong>by</strong> a period of <strong>in</strong>crease, and annual discards averaged 4,238 t from 1968-1980. From 1981-<br />
1995, average discards decreased to 3,496<br />
t·year -1 12<br />
, but <strong>the</strong>n <strong>in</strong>creased and peaked at<br />
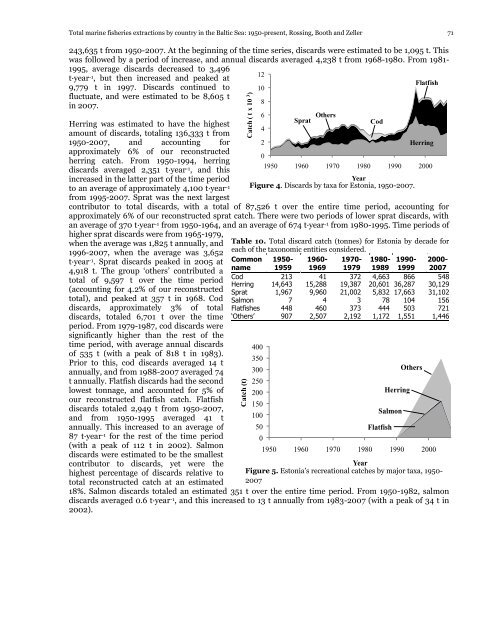
Flatfish<br />
9,779 t <strong>in</strong> 1997. Discards cont<strong>in</strong>ued to 10<br />
fluctuate, and were estimated to be 8,605 t<br />
8<br />
<strong>in</strong> 2007.<br />
Table 10. <strong>Total</strong> discard catch (tonnes) for Estonia <strong>by</strong> decade for<br />
each of <strong>the</strong> taxonomic entities considered.<br />
Common<br />
name<br />
1950-<br />
1959<br />
1960-<br />
1969<br />
1970-<br />
1979<br />
1980-<br />
1989<br />
1990-<br />
1999<br />
2000-<br />
2007<br />
Cod 213 41 372 4,663 866 548<br />
Herr<strong>in</strong>g 14,643 15,288 19,387 20,601 36,287 30,129<br />
Sprat 1,967 9,960 21,002 5,832 17,663 31,102<br />
Salmon 7 4 3 78 104 156<br />
Flatfishes 448 460 373 444 503 721<br />
‘O<strong>the</strong>rs’ 907 2,507 2,192 1,172 1,551 1,446<br />
400<br />
350<br />
300<br />
250<br />
200<br />
150<br />
100<br />
50<br />
0<br />
1950 1960 1970 1980 1990 2000<br />
0<br />
Salmon<br />
Flatfish<br />
Herr<strong>in</strong>g<br />
O<strong>the</strong>rs<br />
1950 1960 1970 1980 1990 2000<br />
Year<br />
Figure 5. Estonia‘s recreational catches <strong>by</strong> major taxa, 1950-<br />
2007<br />
18%. Salmon discards totaled an estimated 351 t over <strong>the</strong> entire time period. From 1950-1982, salmon<br />
discards averaged 0.6 t·year -1 , and this <strong>in</strong>creased to 13 t annually from 1983-2007 (with a peak of 34 t <strong>in</strong><br />
2002).<br />
6<br />
4<br />
2<br />
Sprat<br />
O<strong>the</strong>rs<br />
Cod<br />
Year<br />
Figure 4. Discards <strong>by</strong> taxa for Estonia, 1950-2007.<br />
Herr<strong>in</strong>g


![Nacion.com, San José, Costa Rica [Nacionales] - Sea Around Us ...](https://img.yumpu.com/26166123/1/190x245/nacioncom-san-josac-costa-rica-nacionales-sea-around-us-.jpg?quality=85)


