

Total marine fisheries extractions by country in the Baltic Sea
Total marine fisheries extractions by country in the Baltic Sea
Total marine fisheries extractions by country in the Baltic Sea

Create successful ePaper yourself
Turn your PDF publications into a flip-book with our unique Google optimized e-Paper software.
Catch ( x 10 3 t)<br />
260 <strong>Total</strong> <strong>mar<strong>in</strong>e</strong> <strong>fisheries</strong> <strong>extractions</strong> <strong>by</strong> <strong>country</strong> <strong>in</strong> <strong>the</strong> <strong>Baltic</strong> <strong>Sea</strong>: 1950-present, Ross<strong>in</strong>g, Booth and Zeller<br />
averag<strong>in</strong>g 5,300 t∙year -1 (rang<strong>in</strong>g from a total of 45,000 t per decade <strong>in</strong> <strong>the</strong> 1950s to 58,000 t per decade <strong>in</strong><br />
<strong>the</strong> 1970s, Table B4), before <strong>in</strong>creas<strong>in</strong>g to around 11,000 t∙year -1 dur<strong>in</strong>g <strong>the</strong> 1980s (Figure B3). This<br />
<strong>in</strong>crease was ma<strong>in</strong>ly driven <strong>by</strong> <strong>in</strong>creased discard<strong>in</strong>g of cod. While discard<strong>in</strong>g of cod decreased <strong>in</strong> <strong>the</strong> early<br />
1990s, discard<strong>in</strong>g of sprat <strong>in</strong>creased substantially <strong>in</strong> that period, lead<strong>in</strong>g to <strong>the</strong> all-time peak <strong>in</strong> estimated<br />
discards of 21,700 t <strong>in</strong> 1998 (Figure B3), before decl<strong>in</strong><strong>in</strong>g to <strong>the</strong> levels of <strong>the</strong> mid- late- 1980s of around<br />
11,000 t∙year -1 <strong>by</strong> 2007 (Figure B3, Table B4)<br />
Prior to 1980, <strong>the</strong> average discards of cod were about 2,500 t∙year -1 and <strong>the</strong>n <strong>in</strong>creased to around 7,100<br />
t∙year -1 dur<strong>in</strong>g <strong>the</strong> 1980s. Dur<strong>in</strong>g <strong>the</strong> 1990s, cod discards decl<strong>in</strong>ed to an average of approximately 4,100<br />
t∙year -1 , and 2,500 t∙year -1 from 2000-2007 (Figure B3).<br />
Discards of herr<strong>in</strong>g dur<strong>in</strong>g <strong>the</strong> 1950s were on average 650 t∙year -1 and <strong>in</strong>creased steadily to around 3,800<br />
t∙year -1 dur<strong>in</strong>g <strong>the</strong> 1990s, and <strong>the</strong>reafter decl<strong>in</strong>ed to an average of 3,000 t∙year -1 after 2000 (Figure B3).<br />
Dur<strong>in</strong>g <strong>the</strong> first four decades of <strong>the</strong> time series, sprat discards were very small, but <strong>in</strong>creased substantially<br />
after 1990 to an estimated 6,600 t∙year -1 between 1990-1999. Discards of sprat decreased after 2000 and<br />
were on average about 4,800 t∙year -1 for <strong>the</strong> last eight years (Figure B3).<br />
Table B4. Estimates of decadal total discards (t) for <strong>the</strong> major taxonomic entities<br />
of Swedish <strong>fisheries</strong> <strong>in</strong> <strong>the</strong> <strong>Baltic</strong> <strong>Sea</strong>.<br />
Common<br />
name<br />
Flatfishes had <strong>the</strong> highest<br />
proportion of discards due to<br />
large <strong>by</strong>-catches <strong>in</strong> bottom<br />
trawl<strong>in</strong>g. The estimated<br />
discards were about 780<br />
t∙year -1 dur<strong>in</strong>g <strong>the</strong> 1950s, and<br />
830 t∙year -1 dur<strong>in</strong>g <strong>the</strong> 1960s.<br />
Discards of flatfishes<br />
apparently decreased to about<br />
490 t∙year -1 dur<strong>in</strong>g <strong>the</strong> 1970s,<br />
and to <strong>the</strong> all time low of 200<br />
t∙year -1 dur<strong>in</strong>g <strong>the</strong> 1980s.<br />
After 1990 <strong>the</strong> discards were<br />
estimated to 520 t∙year -1 . Prior<br />
lavaretus).<br />
to 2000, flatfish discards were equal to about 80% of reported flatfish land<strong>in</strong>gs, and for <strong>the</strong> last years,<br />
2000-2007, discards were 670 t∙year -1 , which was equal to about 160% of reported flatfish land<strong>in</strong>gs for <strong>the</strong><br />
same period (Figure B3). Decadal total discards of salmon ranged between 500 t and 700 t prior to 1980<br />
(Table B4). After 1980 <strong>the</strong> seal population <strong>in</strong>creased and contributed to <strong>in</strong>creased discards of salmon<br />
which were estimated to about 100 t∙year -1 . The discards of salmon peaked with an annual average of 220<br />
t∙year -1 dur<strong>in</strong>g <strong>the</strong> 1990s, ma<strong>in</strong>ly due to <strong>the</strong> seal-based discards. After 2000, salmon discards decreased to<br />
an annual average of 120 t∙year -1 , much due to <strong>the</strong> development of <strong>the</strong> push-up trap that decreased sealbased<br />
discards (Table B4).<br />
Discards of o<strong>the</strong>r species fluctuated, and were a m<strong>in</strong>or component of total discards (Figure B3). These<br />
discards ranged between <strong>the</strong> peak of around 750 t∙year -1 dur<strong>in</strong>g <strong>the</strong> 1960s and <strong>the</strong> lowest annual average of<br />
260 t∙year -1 dur<strong>in</strong>g <strong>the</strong> 1980s (Figure B3).<br />
Recreational catches<br />
Discards (t)<br />
1950s 1960s 1970s 1980s 1990s 2000s a<br />
Cod 25,186 27,744 22,470 70,697 40,664 20,115<br />
Herr<strong>in</strong>g 6,515 12,136 24,466 34,711 37,508 23,705<br />
Sprat 428 1,021 1,701 2,288 66,337 38,178<br />
Flatfishes 7,763 8,276 4,918 2,004 5,184 5,332<br />
Salmons 698 543 773 1,053 2,205 994<br />
O<strong>the</strong>rs b 4,344 7,516 3,870 2,630 5,242 2,278<br />
a <strong>the</strong> 2000s only <strong>in</strong>clude data from 2000-2007.<br />
b<br />
Includes sea trout (Salmo trutta), eel (Anguilla anguilla), whitefishes (Coregonus<br />
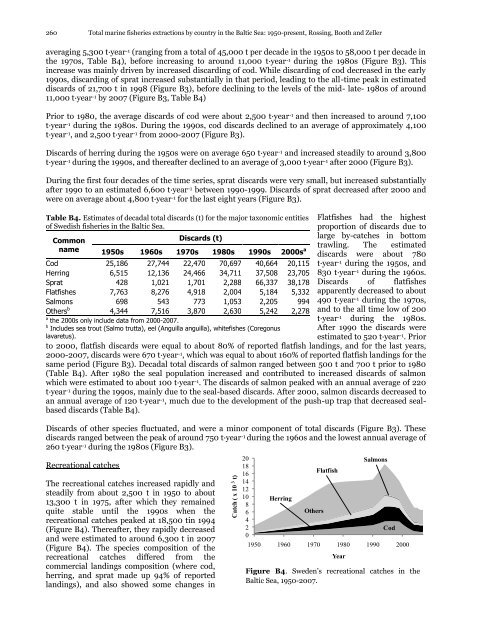
The recreational catches <strong>in</strong>creased rapidly and<br />
steadily from about 2,500 t <strong>in</strong> 1950 to about<br />
13,300 t <strong>in</strong> 1975, after which <strong>the</strong>y rema<strong>in</strong>ed<br />
quite stable until <strong>the</strong> 1990s when <strong>the</strong><br />
recreational catches peaked at 18,500 t<strong>in</strong> 1994<br />
(Figure B4). Thereafter, <strong>the</strong>y rapidly decreased<br />
and were estimated to around 6,300 t <strong>in</strong> 2007<br />
(Figure B4). The species composition of <strong>the</strong><br />
recreational catches differed from <strong>the</strong><br />
commercial land<strong>in</strong>gs composition (where cod,<br />
herr<strong>in</strong>g, and sprat made up 94% of reported<br />
land<strong>in</strong>gs), and also showed some changes <strong>in</strong><br />
20<br />
Salmons<br />
18<br />
16<br />
Flatfish<br />
14<br />
12<br />
10<br />
8<br />
Herr<strong>in</strong>g<br />
6<br />
O<strong>the</strong>rs<br />
4<br />
2<br />
Cod<br />
0<br />
1950 1960 1970 1980 1990 2000<br />
Year<br />
Figure B4. Sweden‘s recreational catches <strong>in</strong> <strong>the</strong><br />
<strong>Baltic</strong> <strong>Sea</strong>, 1950-2007.


![Nacion.com, San José, Costa Rica [Nacionales] - Sea Around Us ...](https://img.yumpu.com/26166123/1/190x245/nacioncom-san-josac-costa-rica-nacionales-sea-around-us-.jpg?quality=85)


