

Total marine fisheries extractions by country in the Baltic Sea
Total marine fisheries extractions by country in the Baltic Sea
Total marine fisheries extractions by country in the Baltic Sea

Create successful ePaper yourself
Turn your PDF publications into a flip-book with our unique Google optimized e-Paper software.
Catch (t)<br />
152 <strong>Total</strong> <strong>mar<strong>in</strong>e</strong> <strong>fisheries</strong> <strong>extractions</strong> <strong>by</strong> <strong>country</strong> <strong>in</strong> <strong>the</strong> <strong>Baltic</strong> <strong>Sea</strong>: 1950-present, Ross<strong>in</strong>g, Booth and Zeller<br />
The largest contributor to overall discards was cod, with an estimated total of 35,400 t from 1950-2007,<br />
which is an average discard rate of 5.8%. Cod discards were estimated to be 434 t <strong>in</strong> 1950, and fluctuated<br />
below 1,000 t until 1995 (average cod discards for <strong>the</strong> period 1950-1994, were 477 t·year -1 ).<br />
Cod discards were estimated to have risen to<br />
1,488 t <strong>in</strong> 2000, and from 1995-2007, average<br />
cod discards were estimated at 1,072 t·year -1 .<br />
The next largest contributors to discards were<br />
sprat and herr<strong>in</strong>g, with totals of 12,705 t and<br />
11,306 t respectively, over <strong>the</strong> entire time<br />
series. Herr<strong>in</strong>g and sprat discards rates<br />
averaged approximately 5%.<br />
Table 7. Decadal totals of <strong>the</strong> estimated discards for<br />
Lithuania (t).<br />
Common<br />
name<br />
1950-<br />
1959<br />
1960-<br />
1969<br />
1970-<br />
1979<br />
1980-<br />
1989<br />
1990-<br />
1999<br />
2000-<br />
2007<br />
Cod 4,681 4,883 3,962 6,685 6,993 8,184<br />
Herr<strong>in</strong>g 663 1,213 3,033 2,924 2,688 785<br />
Sprat 241 1,664 3,464 1,506 2,688 3,146<br />
Flatfishes 52 113 102 51 2,027 3,686<br />
Salmon 0 0 0 17 20 6<br />
O<strong>the</strong>rs 734 136 429 734 93 266<br />
Sprat discards were estimated at 3 t <strong>in</strong> 1953,<br />
and <strong>in</strong>creased to an average annual discard rate<br />
of 232 t·year -1 (with a peak value of 1,098 t <strong>in</strong> 2007). Herr<strong>in</strong>g discards were estimated at 9 t <strong>in</strong> 1950, and<br />
averaged 196 t annually throughout <strong>the</strong> time series (with a peak of 454 t <strong>in</strong> 1995).<br />
Flatfish discards contributed <strong>the</strong> next largest<br />
amount to <strong>the</strong> total, with an estimated 6,030 t<br />
over <strong>the</strong> time series. The discard rate for flatfish<br />
is <strong>the</strong> highest out of all <strong>the</strong> species categories,<br />
with an average discard rate of 29%. Flatfish<br />
discards were estimated to have been 5 t <strong>in</strong> 1950<br />
and averaged approximately 8 t annually from<br />
1950-1990. For 1991-2007, average annual<br />
flatfish discards rose to an estimated 339 t<br />
(range from 26 t <strong>in</strong> 1991, to 667 t <strong>in</strong> 2001).<br />
‗O<strong>the</strong>rs‘ discards were an estimated 2,395 t over<br />
<strong>the</strong> time period, with an average discard rate of<br />
4%. Salmon discards are estimated to have<br />
totaled 43 t over <strong>the</strong> time period, with an average<br />
discard rate of 6%.<br />
700<br />
600<br />
500<br />
400<br />
300<br />
200<br />
100<br />
Herr<strong>in</strong>g<br />
Flatfish<br />
Cod<br />
0<br />
1950 1960 1970 1980 1990 2000<br />
Year<br />
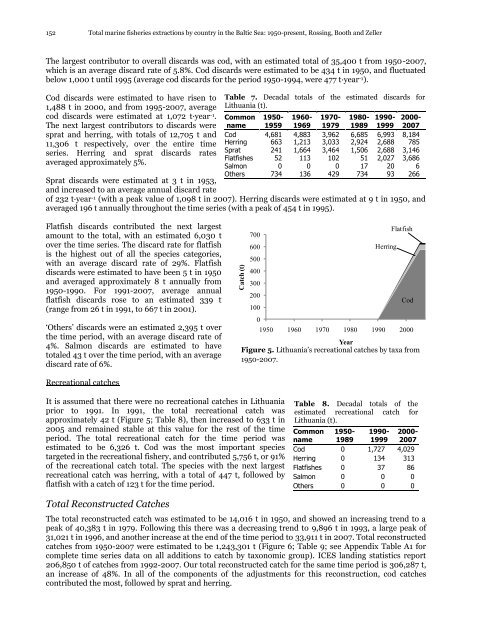
Figure 5. Lithuania‘s recreational catches <strong>by</strong> taxa from<br />
1950-2007.<br />
Recreational catches<br />
It is assumed that <strong>the</strong>re were no recreational catches <strong>in</strong> Lithuania<br />
prior to 1991. In 1991, <strong>the</strong> total recreational catch was<br />
approximately 42 t (Figure 5; Table 8), <strong>the</strong>n <strong>in</strong>creased to 633 t <strong>in</strong><br />
2005 and rema<strong>in</strong>ed stable at this value for <strong>the</strong> rest of <strong>the</strong> time<br />
period. The total recreational catch for <strong>the</strong> time period was<br />
estimated to be 6,326 t. Cod was <strong>the</strong> most important species<br />
targeted <strong>in</strong> <strong>the</strong> recreational fishery, and contributed 5,756 t, or 91%<br />
of <strong>the</strong> recreational catch total. The species with <strong>the</strong> next largest<br />
recreational catch was herr<strong>in</strong>g, with a total of 447 t, followed <strong>by</strong><br />
flatfish with a catch of 123 t for <strong>the</strong> time period.<br />
Table 8. Decadal totals of <strong>the</strong><br />
estimated recreational catch for<br />
Lithuania (t).<br />
Common<br />
name<br />
1950-<br />
1989<br />
1990-<br />
1999<br />
2000-<br />
2007<br />
Cod 0 1,727 4,029<br />
Herr<strong>in</strong>g 0 134 313<br />
Flatfishes 0 37 86<br />
Salmon 0 0 0<br />
O<strong>the</strong>rs 0 0 0<br />
<strong>Total</strong> Reconstructed Catches<br />
The total reconstructed catch was estimated to be 14,016 t <strong>in</strong> 1950, and showed an <strong>in</strong>creas<strong>in</strong>g trend to a<br />
peak of 40,383 t <strong>in</strong> 1979. Follow<strong>in</strong>g this <strong>the</strong>re was a decreas<strong>in</strong>g trend to 9,896 t <strong>in</strong> 1993, a large peak of<br />
31,021 t <strong>in</strong> 1996, and ano<strong>the</strong>r <strong>in</strong>crease at <strong>the</strong> end of <strong>the</strong> time period to 33,911 t <strong>in</strong> 2007. <strong>Total</strong> reconstructed<br />
catches from 1950-2007 were estimated to be 1,243,301 t (Figure 6; Table 9; see Appendix Table A1 for<br />
complete time series data on all additions to catch <strong>by</strong> taxonomic group). ICES land<strong>in</strong>g statistics report<br />
206,850 t of catches from 1992-2007. Our total reconstructed catch for <strong>the</strong> same time period is 306,287 t,<br />
an <strong>in</strong>crease of 48%. In all of <strong>the</strong> components of <strong>the</strong> adjustments for this reconstruction, cod catches<br />
contributed <strong>the</strong> most, followed <strong>by</strong> sprat and herr<strong>in</strong>g.


![Nacion.com, San José, Costa Rica [Nacionales] - Sea Around Us ...](https://img.yumpu.com/26166123/1/190x245/nacioncom-san-josac-costa-rica-nacionales-sea-around-us-.jpg?quality=85)


