

Total marine fisheries extractions by country in the Baltic Sea
Total marine fisheries extractions by country in the Baltic Sea
Total marine fisheries extractions by country in the Baltic Sea

You also want an ePaper? Increase the reach of your titles
YUMPU automatically turns print PDFs into web optimized ePapers that Google loves.
Catch ( t x 10 3 )<br />
Catch ( t x 10 3 )<br />
<strong>Total</strong> <strong>mar<strong>in</strong>e</strong> <strong>fisheries</strong> <strong>extractions</strong> <strong>by</strong> <strong>country</strong> <strong>in</strong> <strong>the</strong> <strong>Baltic</strong> <strong>Sea</strong>: 1950-present, Ross<strong>in</strong>g, Booth and Zeller 151<br />
Unreported land<strong>in</strong>gs<br />
Unallocated catches are described for some<br />
species <strong>in</strong> ICES work<strong>in</strong>g group reports, and<br />
form <strong>the</strong> basis of this section of our<br />
unreported land<strong>in</strong>gs estimates (see<br />
Methods section for details). Unreported<br />
land<strong>in</strong>gs are estimated to have begun<br />
follow<strong>in</strong>g Lithuania‘s <strong>in</strong>dependence, and <strong>in</strong><br />
1991, estimated unreported land<strong>in</strong>gs were<br />
1,195 t (Table 6). This <strong>the</strong>n <strong>in</strong>creased to a<br />
peak of 7,750 t <strong>in</strong> 1996, before decreas<strong>in</strong>g<br />
overall to 2,660 t <strong>in</strong> 2004 (Figure 3). For<br />
<strong>the</strong> rema<strong>in</strong>der of <strong>the</strong> time period,<br />
unreported land<strong>in</strong>gs showed an <strong>in</strong>creas<strong>in</strong>g<br />
trend, and ended <strong>the</strong> time period at 4,531 t.<br />
<strong>Total</strong> unreported land<strong>in</strong>gs from 1991-2007<br />
were an estimated 66,322 t, or 20% of our<br />
reconstructed total from 1991-2007.<br />
9.0<br />
Flatfish<br />
8.0<br />
7.0<br />
6.0<br />
Sprat O<strong>the</strong>rs<br />
5.0<br />
4.0<br />
3.0<br />
Herr<strong>in</strong>g<br />
2.0<br />
1.0<br />
Cod<br />
0.0<br />
1950 1960 1970 1980 1990 2000<br />
Year<br />
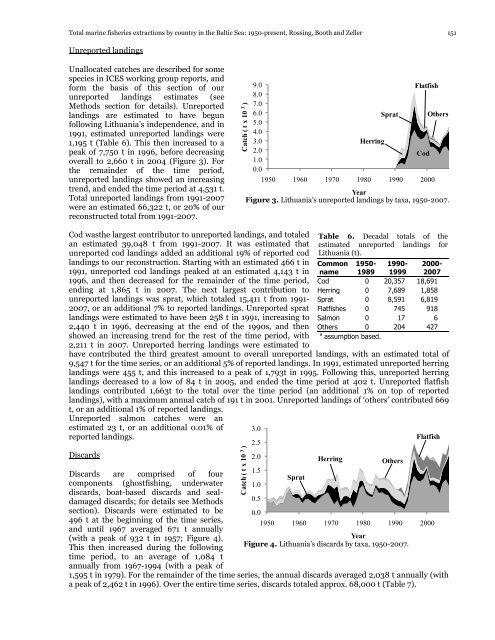
Figure 3. Lithuania‘s unreported land<strong>in</strong>gs <strong>by</strong> taxa, 1950-2007.<br />
Cod was<strong>the</strong> largest contributor to unreported land<strong>in</strong>gs, and totaled<br />
an estimated 39,048 t from 1991-2007. It was estimated that<br />
unreported cod land<strong>in</strong>gs added an additional 19% of reported cod<br />
land<strong>in</strong>gs to our reconstruction. Start<strong>in</strong>g with an estimated 466 t <strong>in</strong><br />
1991, unreported cod land<strong>in</strong>gs peaked at an estimated 4,143 t <strong>in</strong><br />
1996, and <strong>the</strong>n decreased for <strong>the</strong> rema<strong>in</strong>der of <strong>the</strong> time period,<br />
end<strong>in</strong>g at 1,865 t <strong>in</strong> 2007. The next largest contribution to<br />
unreported land<strong>in</strong>gs was sprat, which totaled 15,411 t from 1991-<br />
2007, or an additional 7% to reported land<strong>in</strong>gs. Unreported sprat<br />
land<strong>in</strong>gs were estimated to have been 258 t <strong>in</strong> 1991, <strong>in</strong>creas<strong>in</strong>g to<br />
2,440 t <strong>in</strong> 1996, decreas<strong>in</strong>g at <strong>the</strong> end of <strong>the</strong> 1990s, and <strong>the</strong>n<br />
showed an <strong>in</strong>creas<strong>in</strong>g trend for <strong>the</strong> rest of <strong>the</strong> time period, with<br />
2,211 t <strong>in</strong> 2007. Unreported herr<strong>in</strong>g land<strong>in</strong>gs were estimated to<br />
have contributed <strong>the</strong> third greatest amount to overall unreported land<strong>in</strong>gs, with an estimated total of<br />
9,547 t for <strong>the</strong> time series, or an additional 5% of reported land<strong>in</strong>gs. In 1991, estimated unreported herr<strong>in</strong>g<br />
land<strong>in</strong>gs were 455 t, and this <strong>in</strong>creased to a peak of 1,793t <strong>in</strong> 1995. Follow<strong>in</strong>g this, unreported herr<strong>in</strong>g<br />
land<strong>in</strong>gs decreased to a low of 84 t <strong>in</strong> 2005, and ended <strong>the</strong> time period at 402 t. Unreported flatfish<br />
land<strong>in</strong>gs contributed 1,663t to <strong>the</strong> total over <strong>the</strong> time period (an additional 1% on top of reported<br />
land<strong>in</strong>gs), with a maximum annual catch of 191 t <strong>in</strong> 2001. Unreported land<strong>in</strong>gs of ‗o<strong>the</strong>rs‘ contributed 669<br />
t, or an additional 1% of reported land<strong>in</strong>gs.<br />
Unreported salmon catches were an<br />
estimated 23 t, or an additional 0.01% of<br />
reported land<strong>in</strong>gs.<br />
3.0<br />
2.5<br />
Table 6. Decadal totals of <strong>the</strong><br />
estimated unreported land<strong>in</strong>gs for<br />
Lithuania (t).<br />
Common<br />
name<br />
1950-<br />
1989<br />
1990-<br />
1999<br />
2000-<br />
2007<br />
Cod 0 20,357 18,691<br />
Herr<strong>in</strong>g 0 7,689 1,858<br />
Sprat 0 8,591 6,819<br />
Flatfishes 0 745 918<br />
Salmon 0 17 6<br />
O<strong>the</strong>rs 0 204 427<br />
a assumption based.<br />
Flatfish<br />
Discards<br />
2.0<br />
Herr<strong>in</strong>g<br />
O<strong>the</strong>rs<br />
1.5<br />
Discards are comprised of four<br />
Sprat<br />
components (ghostfish<strong>in</strong>g, underwater 1.0<br />
discards, boat-based discards and sealdamaged<br />
discards; for details see Methods<br />
0.5<br />
section). Discards were estimated to be 0.0<br />
496 t at <strong>the</strong> beg<strong>in</strong>n<strong>in</strong>g of <strong>the</strong> time series,<br />
1950 1960 1970 1980 1990 2000<br />
and until 1967 averaged 671 t annually<br />
(with a peak of 932 t <strong>in</strong> 1957; Figure 4).<br />
Year<br />
This <strong>the</strong>n <strong>in</strong>creased dur<strong>in</strong>g <strong>the</strong> follow<strong>in</strong>g<br />
Figure 4. Lithuania‘s discards <strong>by</strong> taxa, 1950-2007.<br />
time period, to an average of 1,084 t<br />
annually from 1967-1994 (with a peak of<br />
1,595 t <strong>in</strong> 1979). For <strong>the</strong> rema<strong>in</strong>der of <strong>the</strong> time series, <strong>the</strong> annual discards averaged 2,038 t annually (with<br />
a peak of 2,462 t <strong>in</strong> 1996). Over <strong>the</strong> entire time series, discards totaled approx. 68,000 t (Table 7).


![Nacion.com, San José, Costa Rica [Nacionales] - Sea Around Us ...](https://img.yumpu.com/26166123/1/190x245/nacioncom-san-josac-costa-rica-nacionales-sea-around-us-.jpg?quality=85)


