

Total marine fisheries extractions by country in the Baltic Sea
Total marine fisheries extractions by country in the Baltic Sea
Total marine fisheries extractions by country in the Baltic Sea

Create successful ePaper yourself
Turn your PDF publications into a flip-book with our unique Google optimized e-Paper software.
112 <strong>Total</strong> <strong>mar<strong>in</strong>e</strong> <strong>fisheries</strong> <strong>extractions</strong> <strong>by</strong> <strong>country</strong> <strong>in</strong> <strong>the</strong> <strong>Baltic</strong> <strong>Sea</strong>: 1950-present, Ross<strong>in</strong>g, Booth and Zeller<br />
Ghostfish<strong>in</strong>g: Catches (mortality) of<br />
fish due to ghostfish<strong>in</strong>g were treated<br />
as discards. Tschernij and Larsson<br />
(2003) studied <strong>the</strong> capture of cod<br />
due to <strong>the</strong> loss of fish<strong>in</strong>g gear<br />
(gillnets) <strong>in</strong> Sweden‘s <strong>mar<strong>in</strong>e</strong> waters<br />
and related it to commercial<br />
land<strong>in</strong>gs. Here we use <strong>the</strong> mean<br />
value (1.65%) between <strong>the</strong> low<br />
(0.01%) and high (3.2%) estimates<br />
as presented <strong>in</strong> Brown (2005).<br />
Ghostfish<strong>in</strong>g rates were applied to<br />
<strong>the</strong> catches of all species, exclud<strong>in</strong>g<br />
herr<strong>in</strong>g and sprat, dur<strong>in</strong>g <strong>the</strong> entire<br />
time period, 1950-2007 and were<br />
applied to ICES land<strong>in</strong>gs statistics +<br />
adjustments + unreported catches.<br />
Boat-based discards: Boat-based<br />
discards usually result<strong>in</strong>g from<br />
fishers‘ behavior were also<br />
estimated. However, dur<strong>in</strong>g <strong>the</strong><br />
period before re-unification,<br />
estimates of East and West<br />
Germany‘s discard<strong>in</strong>g rates were<br />
treated <strong>in</strong> a different manner<br />
because of political and economic<br />
differences. In East Germany it was<br />
assumed that discard<strong>in</strong>g was<br />
m<strong>in</strong>imal due to <strong>the</strong> lack of economic <strong>in</strong>centives for discard<strong>in</strong>g as it was officially illegal to discard and<br />
same price was paid for all edible species, hence it is likely that only damaged or unpalatable fish were<br />
discarded (R. Oerberst, pers. comm., Johann He<strong>in</strong>rich von Thünen-Institut). Therefore, we assumed a<br />
discard rate of 2% for <strong>the</strong> 1950-1990 time period, applied to all species. We l<strong>in</strong>early <strong>in</strong>terpolated from 2%<br />
to <strong>the</strong> first anchor po<strong>in</strong>t established <strong>in</strong> 1993. This is<br />
conservative <strong>in</strong> comparison with discard rates of 6% observed<br />
<strong>in</strong> Norway, where it is illegal to discard (Krog, 2001).<br />
Boat-based discard rates for West Germany were considered<br />
to be higher than those for East Germany due to its marketoriented<br />
economy, and associated discard<strong>in</strong>g <strong>in</strong>centives.<br />
Discard rates of <strong>the</strong> eastern and western cod stocks, and<br />
salmon followed <strong>the</strong> assumption-based approach as outl<strong>in</strong>ed<br />
<strong>in</strong> Zeller et al. (this volume), with anchor po<strong>in</strong>ts be<strong>in</strong>g<br />
developed from ICES work<strong>in</strong>g group data (Table 4, 5). Taxa<br />
that formed part of our groups ‗o<strong>the</strong>rs‘ and flatfish were<br />
assigned discard rates accord<strong>in</strong>g to taxa-specific <strong>in</strong>formation<br />
from a Danish study which documented <strong>the</strong> discard<strong>in</strong>g<br />
practices over a one-year period for <strong>the</strong> entire Danish fleet<br />
(Anon., 2006a), and here we use <strong>the</strong>se rates throughout <strong>the</strong><br />
time period (1950-2007). Rates of discards for brill and turbot<br />
had <strong>the</strong> average rate (38.5%) from dab (33.4%), European<br />
flounder (48.0%) and European plaice (34.0%) applied, and<br />
we also used this average rate for our flatfish group (Zeller et<br />
al., this volume). Whit<strong>in</strong>g, which formed part of our group<br />
‗o<strong>the</strong>rs‘, had a species-specific discard rate of 36.1% and all<br />
o<strong>the</strong>r taxa had a discard rate of 6.2%.<br />
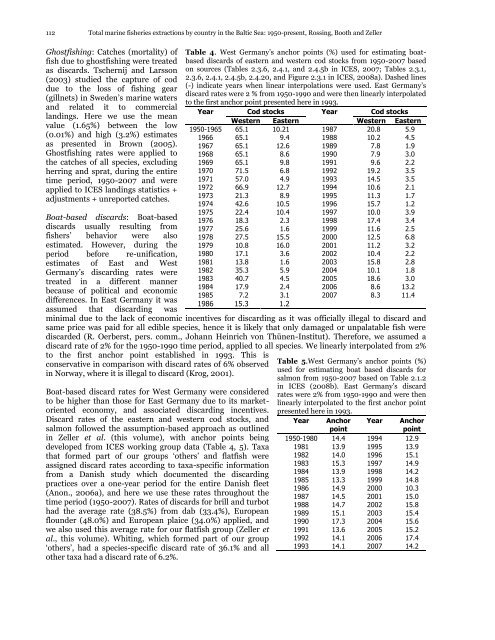
Table 4. West Germany‘s anchor po<strong>in</strong>ts (%) used for estimat<strong>in</strong>g boatbased<br />
discards of eastern and western cod stocks from 1950-2007 based<br />
on sources (Tables 2.3.6, 2.4.1, and 2.4.5b <strong>in</strong> ICES, 2007; Tables 2.3.1,<br />
2.3.6, 2.4.1, 2.4.5b, 2.4.20, and Figure 2.3.1 <strong>in</strong> ICES, 2008a). Dashed l<strong>in</strong>es<br />
(-) <strong>in</strong>dicate years when l<strong>in</strong>ear <strong>in</strong>terpolations were used. East Germany‘s<br />
discard rates were 2 % from 1950-1990 and were <strong>the</strong>n l<strong>in</strong>early <strong>in</strong>terpolated<br />
to <strong>the</strong> first anchor po<strong>in</strong>t presented here <strong>in</strong> 1993.<br />
Year Cod stocks Year Cod stocks<br />
Western Eastern Western Eastern<br />
1950-1965 65.1 10.21 1987 20.8 5.9<br />
1966 65.1 9.4 1988 10.2 4.5<br />
1967 65.1 12.6 1989 7.8 1.9<br />
1968 65.1 8.6 1990 7.9 3.0<br />
1969 65.1 9.8 1991 9.6 2.2<br />
1970 71.5 6.8 1992 19.2 3.5<br />
1971 57.0 4.9 1993 14.5 3.5<br />
1972 66.9 12.7 1994 10.6 2.1<br />
1973 21.3 8.9 1995 11.3 1.7<br />
1974 42.6 10.5 1996 15.7 1.2<br />
1975 22.4 10.4 1997 10.0 3.9<br />
1976 18.3 2.3 1998 17.4 3.4<br />
1977 25.6 1.6 1999 11.6 2.5<br />
1978 27.5 15.5 2000 12.5 6.8<br />
1979 10.8 16.0 2001 11.2 3.2<br />
1980 17.1 3.6 2002 10.4 2.2<br />
1981 13.8 1.6 2003 15.8 2.8<br />
1982 35.3 5.9 2004 10.1 1.8<br />
1983 40.7 4.5 2005 18.6 3.0<br />
1984 17.9 2.4 2006 8.6 13.2<br />
1985 7.2 3.1 2007 8.3 11.4<br />
1986 15.3 1.2<br />
Table 5.West Germany‘s anchor po<strong>in</strong>ts (%)<br />
used for estimat<strong>in</strong>g boat based discards for<br />
salmon from 1950-2007 based on Table 2.1.2<br />
<strong>in</strong> ICES (2008b). East Germany‘s discard<br />
rates were 2% from 1950-1990 and were <strong>the</strong>n<br />
l<strong>in</strong>early <strong>in</strong>terpolated to <strong>the</strong> first anchor po<strong>in</strong>t<br />
presented here <strong>in</strong> 1993.<br />
Year Anchor<br />
po<strong>in</strong>t<br />
Year Anchor<br />
po<strong>in</strong>t<br />
1950-1980 14.4 1994 12.9<br />
1981 13.9 1995 13.9<br />
1982 14.0 1996 15.1<br />
1983 15.3 1997 14.9<br />
1984 13.9 1998 14.2<br />
1985 13.3 1999 14.8<br />
1986 14.9 2000 10.3<br />
1987 14.5 2001 15.0<br />
1988 14.7 2002 15.8<br />
1989 15.1 2003 15.4<br />
1990 17.3 2004 15.6<br />
1991 13.6 2005 15.2<br />
1992 14.1 2006 17.4<br />
1993 14.1 2007 14.2


![Nacion.com, San José, Costa Rica [Nacionales] - Sea Around Us ...](https://img.yumpu.com/26166123/1/190x245/nacioncom-san-josac-costa-rica-nacionales-sea-around-us-.jpg?quality=85)


