Zbornik - SDR
Zbornik - SDR
Zbornik - SDR

Create successful ePaper yourself
Turn your PDF publications into a flip-book with our unique Google optimized e-Paper software.
2000 Maribor, Vetrinjska ul. 16/I, Slovenija<br />
PETNAJSTO MEDNARODNO POSVETOVANJE<br />
FIFTEENTH INTERNATIONAL SYMPOSIUM<br />
RAZSVETLJAVA 2006<br />
LIGHTING ENGINEERING 2006<br />
ZBORNIK<br />
PROCEEDINGS<br />
Razsvetljava delovnih mest<br />
Lighting of Work places<br />
12. - 13. oktober, 2006<br />
BLED, SLOVENIJA
Posvetovanje: RAZSVETLJAVA 2006, Bled, 12.-13. oktober 2006<br />
Organizacija: Slovensko društvo za razsvetljavo / <strong>SDR</strong><br />
Urednik zbornika: mag. Andrej ORGULAN<br />
Organizacijski odbor<br />
predsednik: mag. Matej B. KOBAV<br />
člani: doc. dr. Grega BIZJAK, mag. Matej B. KOBAV, mag. Andrej ORGULAN<br />
Programski odbor in recenzenti<br />
predsednik: doc. dr. Grega BIZJAK<br />
člani:<br />
Tehnična ureditev:<br />
Tisk:<br />
Naklada:<br />
dr. Grega BIZJAK, Marko BIZJAK, Stanko ERŠTE, dr. Marc FONTOYNONT,<br />
mag. Gorazd GOLOB, dr. Marta KLANJŠEK GUNDE, Matej B. KOBAV,<br />
mag. Andrej ORGULAN, Peter RAYNHAM, dr. Raša URBAS<br />
Andrej ORGULAN<br />
Založniško tiskarska dejavnost Univerze v Mariboru<br />
150 izvodov<br />
CIP – Kataložni zapis o publikaciji<br />
Univerzitetna knjižnica Maribor<br />
628.976(082)<br />
Mednarodno posvetovanje Razsvetljava (15 ; 2006 ;<br />
Bled)<br />
Razsvetljava delovnih mest : zbornik = Lighting<br />
of work places : proceedings / Petnajsto<br />
mednarodno posvetovanje Razsvetljava 2006 =<br />
Fifteenth International Symposium Lighting<br />
Engineering 2006, 12. - 13. oktober, 2006, Bled,<br />
Slovenija ; [organizacija] Slovensko društvo za<br />
razsvetljavo = Lighting Engineering Society of<br />
Slovenia ; [urednik zbornika Andrej Orgulan]. -<br />
Maribor : Slovensko društvo za razsvetljavo, 2006<br />
ISBN 86 - 435 - 0799 - 7<br />
1. Vzp. stv. nasl. 2. Orgulan, Andrej 3. Slovensko<br />
društvo za razsvetljavo (Maribor)<br />
COBISS.SI – ID 57549313
RAZSVETLJAVA 2006 / LIGHTING ENGINEERING 2006<br />
CILJI IN VSEBINA POSVETOVANJA<br />
Letos skušamo že trinajsto leto zapored s strokovno obravnavo svetlobne tehnike približati to<br />
problematiko javnosti. Osnovne teme na dosedanjih posvetovanjih so bile:<br />
leta 1992 – RAZSVETLJAVA '92 – Več svetlobe ob manjši porabi energije;<br />
leta 1993 – RAZSVETLJAVA '93 – Energijsko optimiranje razsvetljave;<br />
leta 1994 – RAZSVETLJAVA '94 – Vzdrževanje razsvetljave in ekološki problemi;<br />
leta 1995 – RAZSVETLJAVA '95 – Energijska učinkovitost v sistemih za notranjo in zunanjo<br />
razsvetljavo<br />
leta 1996 – RAZSVETLJAVA '96 – Meritve v svetlobni tehniki kot funkcija učinkovite rabe energije<br />
leta 1997 – RAZSVETLJAVA '97 – Razsvetljava in energija<br />
leta 1998 – RAZSVETLJAVA '98 – Svetila in svetlobna tehnika<br />
leta 1999 – RAZSVETLJAVA '99 – Razsvetljava prodajnih prostorov<br />
leta 2000 – RAZSVETLJAVA 2000 – Novosti v zunanji razsvetljavi<br />
leta 2001 – RAZSVETLJAVA 2001 – Razsvetljava ambientov<br />
leta 2002 – RAZSVETLJAVA 2002 – Svetloba in okolje<br />
leta 2003 – RAZSVETLJAVA 2003 – Učinkovita kombinacija umetne in dnevne svetlobe<br />
leta 2004 – RAZSVETLJAVA 2004 – Učinkovita kombinacija umetne in dnevne svetlobe<br />
leta 2005 – RAZSVETLJAVA 2005 – Svetloba in okolje<br />
S posvetovanjem je seznanjen Centralni urad Mednarodne komisije za razsvetljavo – CIE.<br />
OBJECTIVES THROUGH THE YEARS<br />
The basic topics of the symposia in particular have been the following:<br />
in 1992 – LIGHTING ENGINEERING '92 – More Light with Less Energy Consumption;<br />
in 1993 – LIGHTING ENGINEERING '93 – Energy optimised Lighting;<br />
in 1994 – LIGHTING ENGINEERING '94 – Maintenance and Environmental Problems;<br />
in 1995 – LIGHTING ENGINEERING '95 – Energy Efficiency in Building and Public Lighting Systems.<br />
in 1996 – LIGHTING ENGINEERING '96 – Lighting Engineering and Energy Efficiency<br />
in 1997 – LIGHTING ENGINEERING '97 – Lighting and Energy<br />
in 1998 – LIGHTING ENGINEERING '98 – Lights and Lighting<br />
in 1999 – LIGHTING ENGINEERING '99 – Retail Lighting<br />
in 2000 – LIGHTING ENGINEERING 2000 – Outdoor Lighting<br />
in 2001 – LIGHTING ENGINEERING 2001 – Ambience Lighting<br />
in 2002 – LIGHTING ENGINEERING 2002 – Light and Environment<br />
in 2003 – LIGHTING ENGINEERING 2003 – Effective Combination of Artificial Lighting with Daylight<br />
in 2004 – LIGHTING ENGINEERING 2004 – Effective Combination of Artificial Lighting with Daylight<br />
in 2005 – LIGHTING ENGINEERING 2005 – Light and Environment<br />
The symposium has been noted by the International Commission on Illumination – CIE.<br />
POKROVITELJI POSVETOVANJA / SPONSORS OF THE SYMPOSIUM<br />
INTRA LIGHTING d.o.o., SITECO d.o.o.,<br />
JAVNA RAZSVETLJAVA d.d., MTS International<br />
SPONZORJI / CONTRIBUTORS TO THE SYMPOSIUM<br />
ISKRA ISD, d.d., Adria-Lighting, GE, Salonit Anhovo d.d. in drugi<br />
Univerza v Ljubljani, FE, Univerza v Mariboru, FERI
VSEBINA / CONTENTS<br />
R-1 Prof. dr. Marc Fontoynont, ENTPE, Lyon, podpredsednik CIE, Francija:<br />
Novi izzivi v razsetljavi / *New Challenges in Lighting ...................................................... 1<br />
R-2 Prof. dr. Liisa Halonen, Eino Tetri, Tehnološka univerza Helsinki, Finska:<br />
IEA ECBCS Aneks 45 – Energetsko učinkovita razsvetljava v stavbah /<br />
*IEA ECBCS Annex 45 – Energy Efficient Electric Lighting for Buildings ......................... 5<br />
R-3 Prof. dr. Florin Pop, Tehnična univerza Cluj-Napoca, Romunija:<br />
Energetska učinkovitost v notranji razsvetljavi – Romunski primer /<br />
*Energy efficiency in INTERIOR Lighting – a Romanian Case Study ............................. 11<br />
R-4 dr. Janos Schanda, častni profesor na Univerzi v Veszprému, Madžarska:<br />
Indeks barvnega videza svetil s svetlečimi diodami /<br />
*Colour Rendering Index of LED Light Sources............................................................. 27<br />
R-5 dr. Anna Pellegrino, Politehnika v Torinu, Italija:<br />
Sistemi nadzora razsvetljave za izboljšanje energetske učinkovitosti in<br />
okoljske kakovosti zgradb: omejitve in potenciali /<br />
*Lighting Control Systems to Improve Energy Performance and<br />
Environmental Quality of Buildings: Limits and Potentials .............................................. 37<br />
R-6 Prof. Christian Bartenbach, Bartenbach Lichtlabor, Nemčija:<br />
Razsvetljava prostorov s svetlobnimi zasloni upoštevaje zahteve in<br />
procese vidnega zaznavanja / *Lighting of Spaces with VDTs considering<br />
Requirements and Processes of Visual Perception ....................................................... 47<br />
R-7 Henri Juslen, Philips Idman, Philips Lighting BV, Mäntsälä, Finska:<br />
Razsvetljava in produktivnost na industrijskih delovnih mestih/<br />
*Lighting and Productivity in the Industrial Working Place .............................................. 53<br />
R-8 dr. Martine Knoop, LiDAC International - Philips Lighting, Mathildelaan, NL:<br />
Dinamična razsvetljava za dobro počutje na delovnem mestu: upoštevanje<br />
vidnih, čustvenih in bioloških vidikov razsvetljave /<br />
*Dynamic Lighting for Well-Being in Work Places: Addressing the Visual,<br />
Emotional and Biological Aspects of Lighting Design ..................................................... 63<br />
R-9 Tommy Govén, Fagerhult, Švedska:<br />
Vpliv svetlosti ozadja in barvne temperature na budnost in duševno zdravje /<br />
*The background luminance and colour temperatures influence on alertness<br />
and mental health............................................................................................................ 75<br />
R-10 László Beke, MSc, Peter Bodrogi, Youngshin Kwak, Peter Bodrogi, Seong Deok Lee,<br />
Du-Sik Park, Chang Yeong Kim, University of Pannonia, Veszprém:<br />
Optimalne osnovne barve za tri- in večbarvne ekrane s širokim barvnim obsegom /<br />
*Optimal Color Primaries For Three- And Multi-Primary Wide Gamut Displays.............. 81
R-11 dr. Richard Kittler, Slovaška akademija znanosti, Slovaška:<br />
značilne porazdelitve svetlosti neba in njihova standardizacija kot osnova za izračune<br />
osvetljenosti z dnevno svetlobo /<br />
*Typical Sky Luminance Patterns and Their New Standardisation as Basis for<br />
Daylight Calculations........................................................................................................ 91<br />
R-12 dr. Stanislav Darula, Slovaška akademija znanosti, Slovaška:<br />
Izračun svetlosti neba in osvetljenosti na delovnih mestih ob oknu /<br />
*Calculation of Window Luminances and Sky Illuminance in Side-lit Working<br />
Places ........................................................................................................................... 103<br />
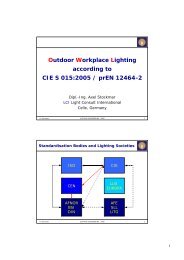
R-13 Axel Stockmar, LCI Light Consult International, Nemčija:<br />
Razsvetljava delovnih mest na prostem v skladu s standardom EN 12464-2 / CIE S 015 /<br />
*Outdoor Work Place Lighting According to EN 12464-2 / CIE S 015 .......................... 109<br />
R-14 Peter Raynham, University College London, Anglija<br />
Javna razsvetljava, kako in zakaj / *Public Lighting, How and Why ..............................113<br />
R-15 Torsten Onasch, Siteco Beleuchtungstechnik, Traunreut, Nemčija:<br />
Svetloba v areni, arena v svetlobi / *Light in Arenas – Arenas in Light......................... 123<br />
R-16 Primož Gspan, Ljubljana:<br />
Obvezna ali prostovoljna uporaba standardov za razsvetljavo pri delu ........................ 139<br />
R-17 mag. Gorazd Golob, dr. Marta Klanjšek Gunde, Marko Jankovec, Jure Ahtik, Matej<br />
Vaupotič:<br />
Problem uporabe LED svetil v tiskarni .......................................................................... 147<br />
R-18 mag. Andrej Orgulan, Tomaž Slatinek, FERI, Univerza v Mariboru:<br />
Vpliv osvetljenih površin na svetlobno onesnaženje..................................................... 149<br />
R-19 Primož Puhar, dr. Grega Bizjak, FE, Univerza v Ljubljani:<br />
Meritev odsevnosti cestnih površin ............................................................................... 157<br />
R-20 mag. Matej B. Kobav, FE, Univerza v Ljubljani:<br />
Uporaba digitalnega fotoaparata s širokokotnim objektivom v funkciji merilnika<br />
porazdelitve svetlosti neba............................................................................................ 167<br />
* prispevki so v angleškem jeziku (op. ur.)
“New Challenges in Lighting” R-1<br />
Marc Fontoynont<br />
NEW CHALLENGES IN LIGHTING<br />
Keywords: Lamps, Indoor lighting, lighting quality, luminous environment.<br />
2 Novi izzivi v razsvetljavi<br />
Ključne besede: svetilke, notranja razsvetljava, kakovost razsvetljave, svetlobno okolje<br />
Interest in lighting techniques is growing wordwide, due to the combination of three major<br />
factors. 1) the higher understanding of the consequences of good/bad lighting in buildings and<br />
cities, 2) the growing concern for energy conservation 3) the revolution of lamp technologies.<br />
On the side of supply of lamps and luminaires, the major challenge today is to prepare the<br />
progressive replacement in the next 20 years of most tungsten-halogen sources in buidings by<br />
three lamp technologies : very compact fluorescent lamps, very compact metal-halide, LED and<br />
OLED technologies. In street lighting, the plan is to get rid of mercury lamps and replace them by<br />
lamps such as metal-halide.<br />
In indoor lighting, good lighting design, and good control strategy (in response to daylight and<br />
occupancy) can lead to very substantial energy savings, higher than 50% of current practice with<br />
improved lighting quality. This means 1 to 3 Euros of electricity saved per square meter of floor<br />
area per year.<br />
Europe is a territory where consideration for lighting quality are quite high, although large<br />
differences exist between countries. It is a place where major multinational lighting and electrical<br />
equipment companies are based (Philips, OSRAM, Schneider-Electric, Siemens, etc.) and where a<br />
large amount of very innovative SME propose lightings solutions. These companies are strong<br />
actors in the field of evolution or lighting techniques. Their challenge is to propose solutions of<br />
higher performance: more durable, higher light quality, lower glare, higher compacity, possible<br />
dimming and management.<br />
Fig 1. Example of computer generated images of various lighting schemes for cubicles tested to identify<br />
preferences among observers (source: Charton, ENTPE)<br />
At work places, this progress needs to be clearly compared with the consequences, both for<br />
the users and the building managers. The annual cost of energy for lighting required per worker is<br />
“Lighting engineering 2006” stran 1
R-1 “Opening paper / Uvodno vabljeno predavanje”<br />
of the order of 1 or 2 hours of salary cost for the employer. The amortizing cost of the lighting<br />
equipment is of the same order. This is very low. It means two things.<br />
First, that the investment cost and running cost of a lightings installation is cheap in<br />
comparison with the general costs involved in the activity of a company.<br />
Second, that the consequences of a bad or good lighting are probably much higher that the<br />
cost of the installation. Which is to say that an investment in a high quality lighting scheme may<br />
be a very good and profitable investment.<br />
We can design lighting keeping in mind two major objectives:<br />
A) the highest satisfaction of the users<br />
B) the lowest energy consumption and running costs.<br />
We have conducted a campaign of testing efficient lighting installations during 6 months in the<br />
area of Lyon, France. 26 work places were tested, each of them with a specific lighting scheme. The<br />
goal was to identify directions in preferred lighting schemes requiring less electrical power. Users<br />
could adjust their lighting conditions thanks to different control systems : dimmer, daylight and<br />
occupancy sensors, separate ambient/task luminaires. The preferred lighting schemes were carefully<br />
recorded through measurements of illuminance distribution, luminance values in the field of view,<br />
electric power required by the lighting installation for the selected lighting scheme.<br />
Selected electric power densities and lighting quality parameters were compared. No<br />
correlation was found between perceived lighting quality parameters and electric power densities,<br />
but some solutions were found, with the best assessment in quality with less than 10W/m 2 of<br />
installed electric power.<br />
Fig 2. Perceived visual quality as a function of the electric power density for lighting for 26 lighting<br />
schemes. This graphs shows that there are various solutions, well accfpted by the users, of lighting schemes<br />
using less than 10W/m 2 of electric power density.<br />
stran 2 Posvetovanje “Razsvetljava 2006”
“New Challenges in Lighting” R-1<br />
3 MOST EFFICIENT SCHEMES<br />
Fig 3. Direct-indirect stand alone luminaire. Its independence with the ceiling allow to locate the luminaire<br />
very precisely near the work space. The users appreciated the dimming option associated to the daylightingoccupancy<br />
sensor. Can be shared with another occupant. Considered as high standing. Typically 100W per<br />
work space required, less than 8W/m 2 in open plan office. Typical light sources about 2 CFL 55W per<br />
occupant, partly dimmed.<br />
Fig 4. Direct-indirect suspended luminaire. Allow usage of 1.20 or 1.50m fluorescent tube. But work place<br />
cannot move if luminaire position is fixed. Leads to the lowest electrical consumption: 6W/m 2 . In open plan<br />
office. Could use 2x54 W fluorescent tubes for two people.<br />
4 CONCLUSION<br />
Here are in summary the possible specifications of lighting installations in offices where the<br />
concern is of high perceived light quality and very low energy consumption.<br />
Hide sources so that the maximum luminance of the luminaire, in all direction is below 7000<br />
cd/m 2 . Reduce uniformity on work plane to a value between 0.6 and 0.8 to provide a feeling of<br />
contrast while avoiding shadows. Allow individual control (dimming) so that the user get the<br />
exact illuminance he/she wishes. Select equipment with good optical performance. Prefer single<br />
“Lighting engineering 2006” stran 3
R-1 “Opening paper / Uvodno vabljeno predavanje”<br />
fluorescent tube to compact fluorescent lamps to lower electric power requirement. Share<br />
luminaries between work places: best performance are obtained with one luminaire providing<br />
light for two workplaces.<br />
Our study is being compared with other such experiences among participants of IEA Annex<br />
45. We expect to develop more robust guidelines for highly efficient, high quality, lighting options<br />
for work places.<br />
Fig 5. Indirect luminaire integrated to the furniture. Judged as very comfortable, the ceiling luminances are<br />
moderate, but the general feeling tends to have a work plane looking darker that the rest of the room.<br />
Requires about 2x35 W fluorescent tubes per work place.<br />
5 REFERENCES<br />
1. VEITCH, J.A. & NEWSHAM, G.R., Lighting quality and energy-efficiency effects on task performance,<br />
mood, health, satisfaction and comfort, Journal of the Illuminating Engineering Society. 1998, Vol.27, n°1,<br />
pp.107-129.<br />
2. CHARTON, V., Etude comparative de la perception d'ambiances lumineuses en milieu naturel réel et en<br />
milieu virtuel, Thèse de doctorat, Mécanique, Energétique, Génie Civil, Acoustique, INSA Lyon, ENTPE,<br />
263 p., 2002.<br />
3. COUTELIER, B., Caractérisation de la qualité d'un environnement lumineux à l'aide d'outils de mesure<br />
vidéo-photométriques et de simulations en milieux virtuels., Thèse de doctorat, Ecole doctorale MEGA,<br />
spécialité Génie Civil, INSA de Lyon, ENTPE, 300 p., 2006.<br />
4. IEA ANNEX 45, Energy Efficient Lighting, http://www.lightinglab.fi/IEAAnnex45/<br />
6 ACKNOWLEGEMENTS<br />
This study was conducted within a contract involving Ingelux Consultants, ENTPE, Sonepar<br />
Group for ADEME, the French Energy and Environment Agency. Equipment was kindly provided<br />
by some lighting manufacturers: Artemide, Flos, Luxo, Optelma, Osram, Philips, SLI, Targetti.<br />
Naslov avtorja / Author's address:<br />
Marc Fontoynont,<br />
National Engineering School of State Public Works, Vaulx-en-Velin, Lyon, France<br />
stran 4 Posvetovanje “Razsvetljava 2006”
“IEA ECBCS Annex 45 – Energy Efficient Electric Lighting for Buildings” R-2<br />
Liisa Halonen & Eino Tetri<br />
IEA ECBCS ANNEX 45 –<br />
ENERGY EFFICIENT ELECTRIC LIGHTING FOR BUILDINGS<br />
Summary<br />
The Executive Committee of the Energy Conservation in Buildings and<br />
Community Systems (ECBCS) program established a new research project<br />
(Annex) in June 2004 called Energy Efficient Electric Lighting for Buildings.<br />
The objectives of Annex 45 are to identify and accelerate the use of energyefficient<br />
high-quality lighting technologies and their integration with other<br />
building systems, to assess and document the technical performance of<br />
existing and future lighting technologies, as well as to assess and document<br />
barriers preventing the adoption of energy-efficient technologies, and to<br />
propose means to resolve these barriers.<br />
Povzetek<br />
IEA ECBCS ANNEX 45 – Energetsko učinkovita električna<br />
razsvetljava v stavbah; Izvršni komite Programa za varčevanje z energijo v<br />
stavbah in komunalnih sistemih (ECBCS) je ustanovil raziskovalni program<br />
(Annex) »Energetsko učinkovita električna razsvetljava v stavbah« v juniju<br />
2004. Cilji programa so: poiskati energetsko varčne visoko kakovostne<br />
razsvetljavne naprave ter pospešiti njihovo uporabo in povezovanje z<br />
drugimi sistemi v zgradbah, določiti in dokumentirati tehnično kakovost in<br />
zmožnosti obstoječe in prihodnje razsvetljavne tehnologije ter določiti in<br />
dokumentirati ovire, ki preprečujejo uporabo energetsko učinkovitih<br />
tehnologij in predlagati ukrepe za odpravo teh ovir.<br />
1 Introduction<br />
International Energy Agency (IEA) is an intergovernmental body committed to advancing<br />
security of energy supply, economic growth and environmental sustainability through energy policy<br />
co-operation. IEA has Implementing Agreements (IA) to organize research. One of these IAs is<br />
Energy Conservation in Buildings and Community Systems (ECBCS). The function of ECBCS is to<br />
undertake research and provide an international focus for building energy efficiency. Tasks are<br />
undertaken through a series of annexes that are directed at energy saving technologies and activities<br />
that support their application in practice. Results are also used in the formulation of energy<br />
conservation policies and standards.<br />
“Lighting engineering 2006” stran 5
R-2 “IEA ECBCS Aneks 45 – Energetsko učinkovita razsvetljava v stavbah”<br />
The Executive Committee of the ECBCS program established a new Annex in June 2004 called<br />
Energy Efficient Electric Lighting for Buildings. Professor Liisa Halonen from Lighting Laboratory<br />
of Helsinki University of Technology was elected for the Operating Agent of the Annex 45.<br />
2 Background<br />
Lighting is a large and rapidly growing source of energy demand and greenhouse gas emissions.<br />
In 2005 grid-based electric lighting consumed was 2 650 TWh. That means 133 petalumen-hours<br />
(Plmh) of electric light was used, an average of 20 megalumenhours/person. In addition each year 55<br />
billion litres of gasoline and diesel are used to operate vehicle lights. More than one-quarter of<br />
world’s population uses liquid fuel (kerosene) to provide lighting. [1] Global lighting electricity use<br />
is distributed approximately 28 % to the residential sector, 48 % to the service sector, 16 % to the<br />
industrial sector, and 8 % to street and other lighting. For the industrialized countries national<br />
lighting electricity use ranges from 5 % to 15 %, while in developing countries the value can be as<br />
high as 86 % of the total electricity use. [2]<br />
More efficient use of lighting energy would limit the rate of increase of electric power<br />
consumption, reduce the economic and social costs resulting from constructing new generating<br />
capacity, and reduce the emissions of greenhouse gases and other pollutants. At the moment<br />
fluorescent lamps dominate in office lighting. In domestic lighting the dominant light source is still<br />
the more than a century old, inefficient incandescent lamp. New aspects of desired lighting are<br />
energy savings, daylight use, individual control of light, quality of light, emissions during life cycle<br />
and total costs.<br />
The building sector in the EU consumes over 40 % of energy use in EU and is responsible for<br />
over 40 % of its carbon dioxide emissions. Lighting is a substantial energy consumer, and a major<br />
component of the service costs in many buildings. The percentage of the electricity used for lighting<br />
in European buildings is 50 % in offices, 20-30 % in hospitals, 15 % in factories, 10-15 % in schools<br />
and 10 % in residential buildings [3]. To promote the improvement of the energy performance of<br />
buildings within the community, the European Parliament has adopted the Directive 2002/91/EC on<br />
the energy performance of buildings. [4]<br />
3 Trends in energy efficient lighting<br />
Electric light is obtained as a result of combination of lighting equipment. Modern lighting<br />
system needs light sources, ballasts, luminaires and controls. Part of the power input to the lighting<br />
unit is transformed into light, while the rest is considered as loss. Energy is lost in lamps, luminaires<br />
and ballasts in the form of heat. The saving of lighting energy requires the use of energy efficient<br />
components as well as the application of control, dimming, and the use of daylight.<br />
A 35 % improvement has been presented in efficiency of T5 fluorescent lamp using mirror louvre<br />
fixture over an equivalent T8 mirror louvre fixture while using a high-frequency ballast and a<br />
standard aluminum reflector. The corresponding improvement in efficiency shown over a luminaire<br />
of the same type with conventional ballast was about 65 %. [5]<br />
As part of the IEA Annex 45 pone objective is to develop a lighting control system with high<br />
level of intelligence and multiple levels of control that learn and adapt to user’s preferences and<br />
behavior. The usage of wireless sensors and actuators is a key component for new lighting control<br />
systems. This is justified by the fact of the easy installation in a way that you do not have to lay<br />
stran 6 Posvetovanje “Razsvetljava 2006”
“IEA ECBCS Annex 45 – Energy Efficient Electric Lighting for Buildings” R-2<br />
cables and damage walls. In this sense it is also possible to integrate such a system into existing<br />
buildings. On the other hand is it impossible to realize an intelligent lighting system without a lot of<br />
sensors and actuators to capture and control the environment.<br />
Directive 2000/55/EC gives energy efficiency requirements for ballasts for fluorescent lamps.<br />
The maximum power of ballast-lamp circuit, for example, of a 36 W fluorescent lamp should be less<br />
than 45 W after 21 May 2002 and less than 43 W after 21 November 2005. [6]<br />
High pressure discharge lamps are very energy-efficient lamp types. Their small discharge body<br />
allows an efficient reflector design for luminaires so that the luminous flux leaving the luminaire can<br />
be distributed effectively in the room. Typically, it takes 3 minutes to reach 80% of the nominal<br />
luminous flux of a high pressure discharge lamp. For automotive lamps, this time has been reduced<br />
to 3 seconds already [7]. At present, high pressure discharge lamps cannot replace other lamp types.<br />
Reasons are given in the start performance and in restricted dimming performance. Research on the<br />
interaction of ballast electronics and high pressure discharge lamps may significantly improve the<br />
performance of this lamp type.<br />
LEDs (Light Emitting Diodes) are new alternative light sources, which are foreseen to<br />
revolutionise the lighting technology in the near future. According to Agilent Technologies the<br />
lumens/package value of red LEDs has been increasing 30 times per decade whereas the price is<br />
decreasing 10 times per decade [8]. The use of LED based lighting could decrease the lighting energy<br />
consumption by 50 % by 2025 [9]. The future entrance of LEDs in the lighting market is dependent<br />
on improvements in conversion efficiency and optical power per package. Although most of the<br />
high-power LEDs (HP-LEDs) nowadays convert between 15 to 20% of the input power into light,<br />
their efficiency potential is far better. In fact the best AlInGaP (aluminum indium gallium phosphide)<br />
red LED and InGaN (indium gallium nitride) green and blue LEDs can have internal quantum<br />
efficiencies which can reach almost 100% and 50%, respectively. To achieve external quantum<br />
efficiencies close to that magnitude, the light extraction has to be improved. By allowing more<br />
photons to escape from the LED chip without been absorbed by the surrounding structure, is one of<br />
the main design challenges which has to be addressed in order to increase the device conversion<br />
efficiency and the radiant power per device. New technologies have been developed in order to<br />
address this issue. The most promising one is the use of quantum dots or nanoparticles. Quantum<br />
dots are characterized by having a large absorption spectral range characteristic and a tunable<br />
spectral emission. This makes them ideal to substitute conventional and inefficient phosphors used<br />
on today white LEDs. However improvements have to be done especially in the quantum efficiency<br />
of quantum dots.<br />
The importance of LED lighting was acknowledged this year also by the Millennium Prize<br />
Foundation. The 2006 Millennium Technology Prize of one million euros, the world’s largest<br />
technology award, was awarded to Professor Shuji Nakamura for his invention of the blue LED. [10]<br />
4 Objectives<br />
The goal is to identify and to accelerate the widespread use of appropriate energy efficient highquality<br />
lighting technologies and their integration with other building systems, making them the<br />
preferred choice of lighting designers, owners and users.<br />
The aim is to assess and document the technical performance of the existing promising, but<br />
largely underutilized, innovative lighting technologies as well as future lighting technologies and<br />
their impact on other building equipment and systems (ie: daylighting, HVAC). These novel lighting<br />
system concepts have to meet functional, aesthetic, and comfort requirements of building occupants.<br />
“Lighting engineering 2006” stran 7
R-2 “IEA ECBCS Aneks 45 – Energetsko učinkovita razsvetljava v stavbah”<br />
The aim is to assess and document the barriers preventing the adoption of these promising<br />
existing and future technologies (ie: technical, economic, risk factors, resistance to change,<br />
legislative, etc.) and propose means to resolve these barriers.<br />
5 Structure<br />
The Annex 45 will run between 2005 and 2008. The work of Annex 45 is divided to four<br />
Subtasks.<br />
• Subtask A Targets for energy performance and human well-being<br />
• Subtask B Innovative technical solutions<br />
• Subtask C Energy-efficient controls and integration<br />
• Subtask D Documentation and dissemination.<br />
Subtask A: Targets for Energy Performance and Human Well-Being<br />
The objective are to document the effect of design and targets for energy use, lighting quality and<br />
human well-being. To propose an upgrade of lighting recommendations and codes to improve the<br />
energy performance of indoor lighting installations.<br />
The performance criteria include the spectral, electrical and user related issues. The energy<br />
criteria include energy efficiency, life cycle energy considerations, maintenance and operation. The<br />
economical criteria include cost of devices and of application.<br />
Subtask B: Innovative Technical Solutions<br />
The objective is to identify, assess and document the performance, energy and economical criteria<br />
of the existing promising and innovative future lighting technologies and their impact on other<br />
building equipment and systems. The purpose is to reduce the energy use of buildings by<br />
investigating the saving potential by comparing the existing and future technologies and by applying<br />
information on concepts, products and lighting solutions. The technical solutions cover power<br />
supply, light sources, luminaries and concepts of controls.<br />
Subtask C: Energy-Efficient Controls and Integration<br />
The Subtask C focuses to optimal use of controls that enables energy savings whilst the user<br />
(occupant, facility manager, operation and maintenance team…) has the possibility to modify the<br />
electric lighting according to personal needs and preferences, within acceptable building operative<br />
requirements. Subtask C gives guidelines to designer, installers, manufacturers to achieve the abovementioned<br />
aim.<br />
Subtask D: Documentation and Dissemination<br />
The objective of Subtask D is to improve current lighting practices in a manner that accelerates<br />
the use of energy efficient products, improves overall building performance and enhances the<br />
occupants’ environmental satisfaction. The objective of Subtask D is to compile and widely<br />
disseminate the Annex research results of Subtasks A, B and C and to identify the means to influence<br />
the energy policies and regulations in order to promote the use of energy efficient lighting. The main<br />
deliverables of the Annex will be Energy-Efficient Lighting Guidebook, semi-annual Newsletter,<br />
seminars and a website (http://lightinglab.fi/IEAAnnex45).<br />
stran 8 Posvetovanje “Razsvetljava 2006”
“IEA ECBCS Annex 45 – Energy Efficient Electric Lighting for Buildings” R-2<br />
Information<br />
Change to Practice<br />
Subtask A<br />
Targets for Energy<br />
Performance and<br />
Human Well-being<br />
A1 Lighting quality criteria with<br />
energy requirements<br />
A2 Review of recommendations<br />
worldwide<br />
A3 Review of energy codes worldwide<br />
A4 Proposals to upgrade<br />
recommendations and codes<br />
A5 Coordinate research programs<br />
on lighting quality with innovative<br />
lighting solutions<br />
A6 Supply of deliverables<br />
Simulation<br />
Subtask B<br />
Innovative Technical Solutions<br />
B1 Identifying knowledgeable people in the industry and<br />
collecting information<br />
B2 Performance criteria of lighting technologies<br />
B3 Trends in existing and future lighting technologies<br />
B4 Comparison of installations<br />
B5 Proofing of technology information (case studies)<br />
Subtask C<br />
Energy-efficient Controls and<br />
Integration<br />
C1 Definition of requirements and constraints linked to the<br />
different players<br />
C2 State of art of lighting control systems<br />
C3 Case studies on existing and innovative lighting control<br />
strategies<br />
C4 Impact of the whole environment concept on lighting control<br />
C5 Commissioning process for lighting / lighting control systems<br />
Case Studies<br />
Subtask D<br />
Documentation and Dissemination<br />
Measurements<br />
Figure 1. Structure of the Annex 45.<br />
6 Management of the Annex<br />
The Annex is managed by the Operating Agent with the assistance of the Subtask Leaders.<br />
Currently there are 20 participating and corresponding countries and 37 organizations in the Annex.<br />
• Operating Agent<br />
Helsinki University of Technology, Finland<br />
Professor Liisa Halonen<br />
• Subtask A Leader<br />
École Nationale des Travaux Publics de l'État, France<br />
Professor Marc Fontoynont<br />
• Subtask B Leader<br />
Bartenbach LichtLabor, Austria<br />
General Manager Wilfried Pohl<br />
• Subtask C Leader<br />
Centre Scientifique et Technique du Batiment, France<br />
Mireille Jandon and Ahmad Husaunndee<br />
• Subtask D Leader<br />
Helsinki University of Technology, Finland<br />
D.Sc. Eino Tetri.<br />
“Lighting engineering 2006” stran 9
R-2 “IEA ECBCS Aneks 45 – Energetsko učinkovita razsvetljava v stavbah”<br />
7 Deliverables<br />
Deliverables of the Annex 45 will be Newsletter (published twice a year), seminars, website and<br />
guidebook of energy-efficient lighting.<br />
More information of the Annex can be found from the Annex web-site:<br />
http://lightinglab.fi/IEAAnnex45 or from Liisa Halonen (liisa.halonen@tkk.fi) or Eino Tetri<br />
(eino.tetri@hut.fi) from Helsinki University of Technology.<br />
8 REFERENCES<br />
5. International Energy Agency. 2006. Light’s Labour’s Lost. IEA Publications, France. 360 p.<br />
6. Mills E. 2002. Why we’re here: The $320-billion global lighting energy bill. Right Light 5, Nice,<br />
France. pp. 369-385.<br />
7. http://www.europa.eu.int/comm/energy_transport/atlas/html/lightdintro.html, accessed on 24.4.2004.<br />
8. Directive 2002/91/EC of the European Parliament and of the Council of 16 December 2002 on the<br />
energy performance of buildings,<br />
9. Govén T. 1997. Energy savings through improved lighting design and engineering. Right Light 4.<br />
Proceedings of the 4th European Conference on Energy-Efficient Lighting. Copenhagen, Denmark..<br />
pp. 17-22.<br />
10. Directive 2000/55/EC of the European parliament and of the council of 18 September 2000 on energy<br />
efficiency requirements for ballasts for fluorescent lighting.<br />
11. Kaase H. 2004. Entwicklungstendenzen, Strategien und Visionen der Lichttechnik; LICHT 4/04;<br />
Germany.<br />
12. Haitz R. 2001. Another Semiconductor Revolution: This Time it’s Lighting; Proceedings of 9th<br />
International Symposium on the Science and technology of Light Sources; Ithaca, NY, USA.<br />
13. Edited by Tsao J. Y. 2002. Light Emitting Diodes (LEDs) for General Illumination An OIDA<br />
Technology Roadmap Update 2002 September 2002 Optoelectronics Industry Development<br />
Association (OIDA) Sandia National Laboratories.<br />
14. The Millennium Technology Prize. http://www.millenniumprize.fi/ accessed on 12.9.2006.<br />
Naslov avtorja / Authors’ address:<br />
Liisa Halonen, Professor, D.Sc.(Tech.)<br />
Helsinki University of Technology<br />
Lighting Laboratory<br />
P.O.Box 3000, FIN-02015 TKK, Finland<br />
Tel. : +358 9 451 2418<br />
Fax : +358 9 451 4982<br />
Email : liisa.halonen@tkk.fi<br />
Eino Tetri, D.Sc. (Tech.)<br />
Helsinki University of Technology<br />
Lighting Laboratory<br />
P.O.Box 3000, FIN-02015 TKK, Finland<br />
Tel. : +358 9 451 2420<br />
Fax : +358 9 451 4982<br />
Email : eino.tetri@tkk.fi<br />
stran 10 Posvetovanje “Razsvetljava 2006”
“ Energy efficiency in INTERIOR Lighting – a Romanian Case Study ” R-3<br />
Florin Pop, Dorin Beu<br />
ENERGY EFFICIENCY IN INTERIOR LIGHTING –<br />
A ROMANIAN CASE STUDY<br />
Summary<br />
The paper analyses the concordance between the regulations concerning the energy<br />
efficiency of interior lighting in buildings and the state-of-the-facts of the existing<br />
installations.<br />
On the first part are presented the outcomes of a study based on the data revealed by<br />
the measurements in some residential and commercial buildings and the statistics and<br />
peoples’ opinions (designers-constructors-owners surveys). There are also presented two<br />
studies related with the impact of the obstructions on the day-light illuminance level on<br />
the interiors and with the evaluation of interior lighting systems quality.<br />
The second part is targeted to the involvement of the Lighting Engineering Center of<br />
the Technical University of Cluj-Napoca, Romania in two programs for promoting the<br />
lighting energy efficiency and saving measures in residential buildings: EnERLIn -<br />
European Efficient Residential Lighting Initiative, an EIE - SAVE program to promote the<br />
compact fluorescent lamps in the residential area, and CREFEN – Integrated Software<br />
System for Energy Efficiency and Saving in Residential Sector, a Romanian CEEX<br />
program. The efficient use of electric energy is still a neglected issue in residential sector,<br />
with a lack of both the necessary statistic data and the methodologies and tools for<br />
assessing, prognosis and training the specialists and consumers.<br />
Povzetek<br />
Energetska učinkovitost notranje razsvetljave – romunski primer; Članek analizira<br />
skladnost predpisov na področju učinkovite rabe energije pri notranji razsvetljavi v<br />
zgradbah z dejanskim stanjem obstoječih inštalacij. V prvem delu so predstavljeni<br />
rezultati raziskave, temelječe na meritvah v stanovanjskih in poslovnih stavbah ter na<br />
statistiki in mnenju ljudi (načrtovalec – izvajalec – lastnik). Predstavljeni sta tudi dve<br />
študiji o vplivu ovir pred stavbo na nivo osvetljenosti z dnevno svetlobo v stavbi ter o<br />
oceni kakovosti notranje razsvetljave. Drugi del članka pa predstavlja vključevanje<br />
Centra za razsvetljavo na Tehnični univerzi v Cluj-Napoca, Romunija v programe za<br />
promocijo energetsko učinkovite razsvetljave in varčevanja z energijo v stanovanjskih<br />
stavbah: EnERLIn – Evropska iniciativa za učinkovito razsvetljavo v stanovanjskih<br />
prostorih, EIE-SAVE – program za promocijo uporabe kompaktnih fluorescenčnih sijalk v<br />
stanovanjih in CREFEN - integrirani programski sistem za energetsko učinkovitost in<br />
varčevanje z energijo v stanovanjskem sektorju, romunski CEEX program. Učinkovita<br />
raba električne energije v stanovanjskem sektorju je še vedno zapostavljeno področje, kjer<br />
primanjkuje tako ustreznih statističnih podatkov kot tudi metodologij in orodja za<br />
določevanje in napovedovanje razmer kot tudi za šolanje strokovnjakov in potrošnikov.<br />
“Lighting engineering 2006” stran 11
R-3 “Energetska učinkovitost v notranji razsvetljavi – Romunski primer”<br />
1 Introduction<br />
The building sector, particularly that of civil buildings, shows promising prospects of future<br />
development. The energy consumption for buildings systems - heating, cold and/or warm water<br />
supply, lighting and electric households - are two – two and half times greater in Romania then in EU<br />
countries. In the last years, there were developed specific regulations and norms to improve the<br />
thermal insulation of the building envelop. Many projects were and are financed by the WB (World<br />
Bank), BERD (European Bank for Reconstruction and Development), PHARE and ISPA programs to<br />
improve or refurbish the water supply network in many Romanian cities, the thermal insulation of the<br />
buildings, to enhance the thermal energy savings, the modernization of the schools, to improve the<br />
quality of the environment. Special laws were adopted by the Romanian Parliament to guarantee the<br />
obtaining of a higher level of the buildings quality – the Law nr. 10/1995 concerning the quality in<br />
constructions field and the Law 199/2000 concerning the energy efficiency in buildings. The legal<br />
frame for rehabilitation and modernisation of the buildings and their installations/services is a main<br />
component of the State Energy Policy of the government and it has to be harmonized with the<br />
international conventions related to the energy efficiency and environment protection. Based on the<br />
State Energy Policy, there will be established annually National Programs for the buildings<br />
rehabilitation, together with their installations/services. Therefore, there is a great demand for up-todate<br />
technology and know-how for a resource-conscious building, renovation and energy planning.<br />
2 A status of energy efficient lighting in Romania<br />
Performances on efficient lighting in European Union. The EN 12464 (Lighting of work places)<br />
and EN 12665 (General terms and criteria for specifying lighting requirements) offer a new quality<br />
of further lighting installations – responsibility of the illumination design author for results of his<br />
work and responsibility of the users for proper maintenance of the installations. Their responsibilities<br />
will be under the legally and financially pressure. A minimum daylight factor is specified on the<br />
work plane so that at 3 m from the windows does not fall below 1%; this daylight will allow the use<br />
of suitable lighting controls to help manage and limit the energy use by electric lighting. The<br />
standard considers two zones on the working area – respectively the task and its immediate<br />
surrounding, the second being illuminated to at least 60% of that on the task. Comparative with a<br />
lighting system based on general lighting, a localised lighting system (for task area) with additional<br />
ambient lighting (for immediate surrounding) may fall the specific power from 10-15 W/m 2 to 6-10<br />
W/m 2 , representing about 50% savings (Govén 2001). Four EU countries - Belgium, France, Greece,<br />
and Netherlands – had a detailed calculation procedure for lighting as part of their building energy<br />
requirement (Littlefair & Slater 2002).<br />
Lighting represents an important part of building energy consumption in the EU – around 10% of<br />
the total electricity consumption, ranging from 5% (Belgium, Luxemburg) to 15% (Denmark,<br />
Netherlands, and also Japan). The global electric lighting energy use may be split in four sectors:<br />
services 48%, residential 28%, industrial 16% and street lighting and other 8% (Mills 2002).<br />
Lighting systems design trends are dynamics both in time and between countries. The recommended<br />
illuminance level represents only one of the design parameters, but it is determinant for a lighting<br />
system and its energy consumption (Mills & Borg 1998)<br />
Lighting electricity consumption accounts for about 20 to 30% of the total energy required by an<br />
office building (Fontoynont, Escaffre & Marty 2002). On average, the investment cost of lighting<br />
facilities for an office building works out at around 1 to 2% of total investment. The power density<br />
stran 12 Posvetovanje “Razsvetljava 2006”
“ Energy efficiency in INTERIOR Lighting – a Romanian Case Study ” R-3<br />
for standard fluorescent lighting installations varies from 13 to 20 W/m 2 . Recent progress in<br />
equipment and design demonstrates the possibility to reduce these values in the range of 7 to 10<br />
W/m 2 (Fontoynont, Escaffre & Marty 2002). A minimum acceptable lighting power density of about<br />
7 W/m 2 will leads to annual lighting consumption of 16 kWh/m 2 . Dimming or extinction of lamps of<br />
ambient lighting may lead to annual consumption below 10 kWh/m 2 (Fontoynont, Escaffre & Marty<br />
2002). Based on the few comprehensive estimates studies, there is stipulated an approximate<br />
commercial sector lighting savings potential in the range of 25% to 40% (Mills 2002). In practice<br />
savings will vary by country, depending on existing baseline conditions. Energy saving measures in<br />
lighting must be accepted by the users and must be associated with an improvement of their<br />
standards working condition, having in mind even the fact that the annual lighting consumption of an<br />
office worker is of the order of one hour of the his/her salary cost (Fontoynont, Escaffre & Marty<br />
2002).<br />
National building energy regulations. The legal frame for an energy efficient lighting approach is<br />
constituted by the general set of laws, referring to the whole building or energy consumer: • Law<br />
10/1995 “The Quality in Constructions Act” which establish the quality system, one of its<br />
compulsory regulations to be achieved and maintained during the entire life of construction referring<br />
to the law energy level of consumption and energy savings. • Law 199/2000 “The Energy Efficiency<br />
Act” according to the national policy on efficient use of energy, in conformity to the Energy Charta<br />
and Energy Efficiency and Environmental Protocol, which establish duties and stimulating measures<br />
for the energy producers and consumers regarding to its efficient use. The interior lighting<br />
installations are guided by two national recommendations – SR 6646-97 - Artificial lighting and NP-<br />
061-02 - Guide for design and execution of the buildings artificial lighting systems, following the<br />
CIE recommendations. Romanian norms include the recommended values of the illumination levels,<br />
maintenance factors and other parameters, but do not stipulate the specific requirement on energy<br />
efficiency for lighting equipment and systems, only the functional performance statement mentioned<br />
before: ‘to provide lighting systems which are energy efficient’.<br />
Energy aspects. The average electric energy consumption was 515 kWh/person in 2003. At the<br />
level of the EU, according to “Energy efficiency indicators in Europe” – Odysee [1], the residential<br />
consumption in 2003 was 2533 kWh/household/year. We remark that in Romania this consumption is<br />
of about 40% of the EU level (see Figure 3 a). There is currently no information with respect to the<br />
electric lighting use in offices.<br />
A measurement campaign at the local area in schools and offices (Pop&Beu 1998) stated a<br />
critical situation of the lighting systems, very old and out of right norms. Then, we promoted a long<br />
term information campaign through designers and building/electrical installations constructors, with<br />
the support of the national dealers and manufacturers, to improve their knowledge and to disseminate<br />
the results of the European programmes Thermie, Peco-Joule, Save.<br />
A questionnaire related with the energy efficiency in lighting was spread through the local area of<br />
the Lighting Engineering Center U.T.C.-N., at about 50 lighting designers and dealers, receiving<br />
back 30 of them (Pop 2003). The answers refer to the offices and small manufacturers. The installed<br />
specific power was in the range of 13–22 W/m 2 , and 3-5 W/m 2 /100 lx for offices, too higher than<br />
standard values. There was no correlation with the daylight availability and users needs/presence due<br />
to the lack of interest from the owners. Some designers did not know the infrared control system. The<br />
weighted factors (in a 1-3 scale) for lighting features were the following: • importance of the control<br />
facilities – individual or building central - 1, zones of activity - 3; • mention the specific power – 3; •<br />
high tech ballasts and lamps – 2 to 3; • mention/use of the proper lamps (efficiency, colour<br />
temperature, colour rendering index) – 3; • energy labels – 1; • maintenance schedule – 1; •<br />
photometric measurements – 1 to 2; • lighting installation history book – 1. The national norms were<br />
considered unsatisfactory to acceptable.<br />
“Lighting engineering 2006” stran 13
R-3 “Energetska učinkovitost v notranji razsvetljavi – Romunski primer”<br />
This bad image of lighting efficiency is currently changing. The electric projects for modern<br />
buildings - offices, showrooms, commercial centres, schools - promote state of the art electric and<br />
lighting equipments, with high tech lamps, luminaries, control systems. High efficiency, standard<br />
levels of illuminances, the Buildings Energy Managements systems are the proof of this evolution.<br />
Romanian Educational Ministry promotes an intensive campaign, with the financial support of EU<br />
and WB, to modernise all the schools, at city or county locations.<br />
3 Obstructions impact on office day-lighting illuminance<br />
The design of an office lighting systems has to take into account the increasing number of<br />
furniture and equipment (obstructions) and the flexibility to suit to frequent changes. New design<br />
methods considering obstructions, were analysed under the frame of the CIE Technical Committee<br />
TC 3-31 ‘Electric lighting for real interiors’, chaired by Dr. Carter. Based on surveys and computer<br />
simulation, it was proposed a modified lumen method by using an obstruction factor. It is a function<br />
of the luminaries class and the ratio between vertical surface of obstructions and room area, being<br />
defined three kind of standard obstructions: light, medium and heavy (Carter, Leung & Lupton,<br />
1995).<br />
OL [%]<br />
65<br />
60<br />
55<br />
50<br />
45<br />
40<br />
35<br />
30<br />
25<br />
20<br />
8 10 12 14 16<br />
Overcast S Clear E Clear W Clear N Clear<br />
(a)<br />
OL [%]<br />
65<br />
60<br />
55<br />
50<br />
45<br />
40<br />
35<br />
30<br />
25<br />
20<br />
8 10 12 14 16<br />
Overcast SClear E Clear<br />
(b)<br />
OL [%]<br />
65<br />
60<br />
55<br />
50<br />
45<br />
40<br />
35<br />
30<br />
25<br />
20<br />
8 10 12 14 16<br />
Overcast S Clear E Clear W Clear N Clear<br />
.<br />
c) d)<br />
Figure 1: Obstruction Losses from 8 to 16<br />
(a) on January 15th; (b) on April 15th; (c) on July 15th; (d) on October 15th<br />
OL [%]<br />
65<br />
60<br />
55<br />
50<br />
45<br />
40<br />
35<br />
30<br />
25<br />
20<br />
8 10 12 14 16<br />
Overcast S Clear E Clear W Clear N Clear<br />
A research was targeted to the impact of obstructions on daylight average illuminance in offices<br />
based on computer simulation, using Lumen Micro software (Beu 2000, Beu & Pop 2002).<br />
Obstruction Losses (OL) factor was defined as the percentage reduction of the average working plane<br />
illuminance of furnished rooms compared with empty situation. The study was concerned to several<br />
parameters: standard obstructions; CIE sky conditions: clear, cloudy and partially cloudy; windows<br />
orientation: North, South, East and West; time of the day: 8, 10, 12, 14 and 16 for January, April, July<br />
and October 15th; presence or absence of electric lighting; obstructions orientation in relation with<br />
stran 14 Posvetovanje “Razsvetljava 2006”
“ Energy efficiency in INTERIOR Lighting – a Romanian Case Study ” R-3<br />
the windows; obstruction density and reflection; windows transmittance and dimensions; windows<br />
on one or two sides of the room. The results show important drops in average illuminance till 60%,<br />
which is a factor of concern for offices real illuminance.<br />
Influence of the time of the year and obstruction type. Figure 1 shows the OL fluctuations during<br />
a day, from 8 a.m. to 4 p.m. for January, April, July and October 15th. It can be seen from these<br />
charts that OL for overcast sky is constant, but for clear sky there are high fluctuations. It also can be<br />
noticed that no matter the sky type, the OL are lower around 10 and 12 a.m., when sun altitude is<br />
near the maximum. From here a dependence relation between sun altitude and OL for South and<br />
West windows. For North windows there are minor daily fluctuations for clear and partially clear<br />
sky.<br />
The chart shapes are changed for each period of the year. In some periods of the year, at 8 a.m.<br />
there are the highest OL, and in other periods there are the lowest OL The illuminance level reduction<br />
for overcast sky is not dependent of the time of the year, with average values of 32.81% for heavy<br />
obstructions, 27.37% for medium obstructions and 12.3% for light obstructions. In the morning, for<br />
partially overcast or clear sky and for North or West window orientation, illuminance reduction is not<br />
significantly influenced by the time. The highest fluctuation of illuminance reduction for 10 a.m.<br />
appears in the case of South or East windows, with a peak in the winter.<br />
Figure 2: Obstruction Losses as<br />
function of VFR || , VFR ⊥ and VFR (for<br />
overcast sky)<br />
Influence of obstruction orientation in relation to the window. In the studies about obstructions in<br />
the case of electric lighting the Vertical to Floor Ratio – VFR factor was introduced as an expression<br />
of room content [5]. VFR is the ratio between obstructions vertical surface area above the floor area.<br />
We proposed for daylight to decompose VFR in VFR || for parallel surfaces with windows, and VFR ⊥<br />
for perpendicular surfaces with windows. (NB: VFR || + VFR ⊥ = VFR). When the obstructions are<br />
rotated with 90°, the VFR || and VFR ⊥ swap, VFR remains constant, but OL drops in average with<br />
3.6% for overcast sky and heavy obstructions and with 4% for partially overcast and heavy<br />
obstructions. So, the OL for overcast sky can be interpreted as function of VFR || , VFR ⊥ and VFR. The<br />
chart from Figure 2 shows that the trend is different from the linear slope of OL/VFR, which is<br />
characteristic for electric lighting. However there is a relation of proportionality between VFR and<br />
OL, especially for light and medium obstructions, but which is no longer valid for heavy obstructions<br />
(presence of partitions). Despite these problems, the simulations have proved that a reduction of<br />
obstruction density lead to smaller OL, as the orientation of partitions from parallel to perpendicular<br />
to windows wall.<br />
“Lighting engineering 2006” stran 15
R-3 “Energetska učinkovitost v notranji razsvetljavi – Romunski primer”<br />
4 The Interior Lighting Evaluation System - ILES<br />
The quality of a lighting installation would be described by several parameters: illuminance level<br />
and uniformity; direct glare control or avoidance (luminance distribution); appearance colour and<br />
colour rendition; modelling. The qualitative parameters have different weight, related to the room<br />
destination and architecture. The accent should be on: visual performance, choosing the right<br />
illuminance level and the glare avoidance; visual comfort, by the colour rendering and the luminance<br />
distribution; visual environment, by the selection of the light colour and direction and modelling.<br />
Lighting quality is a multi-faceted concept. We assess it directly, by measuring its photometrical<br />
parameters, and, indirectly, using behaviour measures – for instance, responses to semantic<br />
differential scales or Likert-scale responses to statements of opinion. There are also many research<br />
studies proposing new methods and surveys devoted to identify a proper modality to refine visual<br />
performance and comfort models. However, since there are yet no comprehensive and objective<br />
measures of visual comfort; occupant surveys remain the most accurate way to assess the lighting<br />
installation not only by its photometric properties, but also by economic parameters and human<br />
behaviour. It is useful to simultaneously estimate photometric and economic (cost and energy)<br />
parameters, maintenance program and subjective evaluation of visual comfort.<br />
Energy efficiency and quality do not automatically go hand in hand Greater lighting comfort for<br />
people in offices, for example, is often combined with a higher energy consumption. If a measurable<br />
(energy consumption) and a non-measurable (lighting comfort) parameter have to be weighted<br />
against each other, the non-measurable parameter comes under pressure (Zeguers, Jacobs 1997).<br />
A lighting installation with good quality is energy-efficient whether permits a high level of<br />
performance without creating discomforts. The light quality is not directly measurable, but it is a<br />
state generated by the link between environment and users. A lighting has a good quality when: (1)<br />
there is a good visual condition; (2) it permits the accomplishment of the task or determines the<br />
behaviour in accordance with the environment; (3) assures the availability of the interactions and<br />
desired communication between the participants; (4) contributes to the aesthetics of the space. The<br />
evaluation of the lighting quality has to be made by the evaluation of its effect on the people, having<br />
in mind all the characteristics of the room space and the users.<br />
Designed to be inexpensive, simple to administer, to score, and easy to interpret, the ILES covers<br />
a reduced number of parameters, but most important ones, and a rough scale of preferences. The<br />
system has two components - an objective photometric and energetic analysis LQED - Lighting<br />
Quality & Economic Diagnose and a subjective survey ULCS - Users’ Lighting Comfort Survey.<br />
(a) Its objective component – LQED – evaluates the photometric and energetic of the lighting<br />
system. This module may be used for in design to compare different variants and to offer an<br />
objective criterion to choose the better one.<br />
Photometrical measurements. The physical data collection includes a general space inventory as<br />
well as measures of lighting – illuminance, luminance, daylight factor, and surface reflectance<br />
following the CIE standards.<br />
Questionnaire concept. It is proposed a questionnaire following the reference models and<br />
answering to the specific questions, presented below:<br />
Room: Destination; Dimensions; Daylight factor – average value; Ceiling/walls reflexivity<br />
Equipment: Luminaries; Lamps - type, power, colour; Ballast; Installed power = Number of<br />
lamps x (Power + Ballast loses)<br />
stran 16 Posvetovanje “Razsvetljava 2006”
“ Energy efficiency in INTERIOR Lighting – a Romanian Case Study ” R-3<br />
Photometric measurement: Average illuminance - norm/measured (designed); Illuminance<br />
uniformity - min/av.; Lighting source luminance; Luminance contrast - source/ceiling<br />
Electric measurement: Voltage<br />
Technical state: Lighting source - clean/dirty/painted; Installed power per unit - W/m 2<br />
and/or W/(m 2·100 lx); Switching control – wall mounted/local, manual/automatic control<br />
Maintenance programme: Is there a scheduled activity? Last date of the change of the<br />
lamps/luminaries - Yes / No; Cleaning period of the room/installation - Yes / No<br />
The Quality Value Method. The quality of the lighting installation is influenced by different<br />
parameters. They cover the lighting quality – referred by its photometric parameters -, the lighting<br />
energy-effectiveness – referred by its economic parameters -, and the benefit of final users – referred<br />
by their comfort, pleasantness and productivity. The importance of different parameters varies inside<br />
of each of these groups and also between them. Following the Krochmann study (1990), there are<br />
proposed a method and a model for quantifying them into a final “quality value” number, by<br />
weighting the meaning of parameters and by evaluation of their levels.<br />
The photometric parameters targeted to the lighting quality are: average illuminance, illuminance<br />
uniformity, modelling (cylindrical illuminance), lighting source luminance, luminance distribution<br />
(contrast) on the visual field, reflectance of the room surfaces – walls, ceiling, ground, luminaries<br />
protection angle, correlated colour temperature, colour rendering index and a lot of many others.<br />
Each of the parameters – noted with x – has a certain importance on the quality assembly, noticed by<br />
the weighting factor w(x), valued from 1 (lowest) to 10 (highest importance). Each of the parameters<br />
is evaluated in function with its effective value, compared with the standard, recommended or<br />
optimum value by the scaling factor s(x), valued from 1 to 10. Each of the parameters contribute to<br />
define the quality value of the lighting installation by the quality factor q(x), product of both specific<br />
factors<br />
q(x)=w(x)·s(x).<br />
The effective quality factor of the installation is the sum of the quality factors of each component<br />
parameters q ef =∑ w(x)·s(x), having the minimum - min q ef =∑ w(x) -, and, respectively, the maximum<br />
value - max q ef =10 ∑ w(x).<br />
The optimum quality factor of the installation is corresponding to the standard, recommended or<br />
optimum values, being the maximum value q opt =max q ef =10 ∑ w(x).<br />
The Quality Value, describing the overall quality of the lighting installation, is the ratio:<br />
q<br />
Q =<br />
q<br />
opt<br />
⋅10<br />
=<br />
∑ w(<br />
∑<br />
x)<br />
⋅ s(<br />
x)<br />
ef .<br />
w(<br />
x)<br />
The scaling factor of each parameter x is defined by comparing the effective value, measured or<br />
designed, to the normalised value, recommended or admissible, and introducing the<br />
minimal/maximal values ratio:<br />
( seff<br />
, snorm<br />
)<br />
( s , s )<br />
min<br />
s( x)<br />
= 10 ⋅<br />
.<br />
max<br />
eff<br />
norm<br />
By using the ratio of the two illuminances, we take into account the following aspects: on one<br />
side, an installation which assures an illuminance level lower than the normalised value is under<br />
standard, but the rules concerning the illuminance are, as we all know, very elastic and conjectural<br />
(there are many working installations with illuminance levels well under the normalised values,<br />
accepted by the users); on the other side, an installation which assures an illuminance level higher<br />
than the normalised value does this by consuming extra electrical energy over the right balance. In<br />
“Lighting engineering 2006” stran 17
R-3 “Energetska učinkovitost v notranji razsvetljavi – Romunski primer”<br />
both cases, the lighting installation will be qualitatively under-marked due to the involvement either<br />
of the photometrical aspect, or of the energetically aspect. The illuminance measured in a new<br />
installation is of 600 lx, designed for a normalised level of E norm =400 lx. Introducing the maintenance<br />
factor of 0.8, the effective illuminance is considered E eff =0.8·600=480 lx. The scaling factor becomes<br />
s(E)=10·400/480=8.3.<br />
Of course, we may suppose that an installation is designed, executed or maintained so that its<br />
parameters should conform to the admissible/reasonable specific limits. For example, for offices it is<br />
recommended the use of some electrical (fluorescent) lamps with a colour rendering index of at least<br />
80; it is absolutely improbable to design or keep in working state an installation equipped with lamps<br />
with an index of 50...60, because we may easily obtain the necessary lighting sources.<br />
Evaluation of the weighting factors. The importance of different parameters is variable. The<br />
ILES user, according to the particular data of the room and the importance of the relevant component<br />
fixes the values of the weighting factors for the lighting system analysed.<br />
A simple computer program allows us to obtain quickly the information necessary to evaluate the<br />
analysed lighting installation and its energetic balance.<br />
A survey (Pop Mihaela&Pop 2002) with 100 people revealed the following values for the<br />
weighting factors of the quality parameters submitted to their attention:<br />
1) Illuminance level on the working plane 9<br />
2) Illuminance uniformity on the working plane 8<br />
3) Space modelling 7<br />
4) Luminance contrast - light source/ceiling 7<br />
5) Luminance contrast - visual task/background 8<br />
6) Distribution of illuminances in the visual field 8<br />
7) Reflectance of the room surfaces (average weighted value) 6<br />
8) (Correlated) Colour temperature of the lighting sources 8<br />
9) Colour rendering index 7<br />
10) Energetic efficiency 9<br />
We would like to identify how lighting condition affect lighting economics and visual comfort of<br />
the users. The LQED module will be used to evaluate different variants of designed installations, to<br />
compare them on multiple aspects for having an objective criterion for choosing the best one.<br />
(b) The subjective component – ULCS – must be simple to administer and score. For this a<br />
large number of former proposals have been analysed (some of them are presented in the mentioned<br />
bibliography) to identify the most important questions for defining a visual performance and comfort<br />
model. The complexity level of the corresponding parameters, and, implicitly, of the questions asked<br />
to the users, are determined by the knowledge level and, respectively, of education. It is useless to<br />
ask an uninformed user about certain aspects related to illuminance contrasts, colour rendering or<br />
interior space modelling.<br />
The fulfilment of the comfort from a lighting installation is determined by parameter values that<br />
affect the visual task, visual comfort and environment. Some of them may be accurately measured,<br />
but others should be very subjective. The visual satisfaction describes on which measure the real<br />
visual conditions of the lighting are accepted by the users; it is determined the easiness which the<br />
work is performed and the pleasantness of the environment, both in the period when the attention is<br />
targeted to the visual task, and in the relax time. Of course, the luminous environment and the<br />
individual preferences affect the visual satisfaction.<br />
stran 18 Posvetovanje “Razsvetljava 2006”
“ Energy efficiency in INTERIOR Lighting – a Romanian Case Study ” R-3<br />
To obtain the subjective opinions of the users there were selected the following questions. The<br />
answers are included in five options: inadequate, acceptable, good, very good, excellent or with two<br />
options: Yes/No, Comfortable/Uncomfortable, Disagree with/Agree with:<br />
Is the day lighting sufficient?<br />
Is the electric lighting sufficient?<br />
The illuminance (light) is uniform on the working room surface?<br />
Are you satisfied by the switching on/off modality?<br />
Is the light appearance (brightness) of the luminaries adequate?<br />
How do you appreciate the maintenance schedule of the lighting installation (cleaning,<br />
replacement of the failed equipment)?<br />
Is the available light sufficient to read/write by hand/computer use/draw?<br />
How do you appreciate the light environment of the room?<br />
How do you appreciate the work lighting at your place (stand, desk)?<br />
How do you appreciate the lighting in your working room comparing with the others?<br />
Please notify on which room would you like to work/do you like the lighting installation?<br />
5 EnERLIn - European Efficient Residential Lighting Initiative<br />
The European Climate Change Programme (ECCP) identified residential lighting as an important<br />
area to CO 2 emission reductions. After a considerable number of promotion and rebate schemes,<br />
about 135 million CFLs are used today in European homes. However, only 30% of EU households<br />
have at least one CFL, with those households that own them having an average of three or four. The<br />
EnERLIn EIE SAVE program is aiming at promoting to all the stakeholders a quality charter to<br />
assure that the CFL that are marketed and promoted can deliver savings which last overtime and meet<br />
the customer expectations of high quality lighting, and the ultimate objective of the program is to<br />
substantially increase the efficiency of residential lighting in a number of Member States and<br />
Candidate Countries.<br />
The residential lighting market is still dominated by inefficient Incandescent Lamps (GSL –<br />
General Service Lamps). The EnERLIn EIE SAVE program proposes to develop and validate robust<br />
scenarios for CFL promotional campaigns in European, national and regional levels. Concerning<br />
energy savings from CFLs, assuming that there is 150 million households in Europe the energy<br />
economy by replacing only one additional 75 W GSL by one 15 W CFL is in the order of 22.5 TWh<br />
or 4 MTEP per annum, this corresponds to 1.2 Mtonnes of less CO 2 per annum. We should add at<br />
these savings that a high quality CFL has a life span higher than 10,000 work hours, compared to<br />
2000 work hours for a GSL.<br />
The European Union initiated numberless campaigns to promote compact fluorescent lamps with<br />
the purpose of increasing the market share of compact fluorescent lamps at 15%. In this case, the<br />
estimated energy saving would amount to 15 TWh per year. This energy saving is similar to a<br />
reduction of annual CO 2 emissions of about 800 kTones CO 2 .<br />
Objectives of the EnERLIn action. Improving the energy efficiency is a central theme of<br />
energy policy within the European Community, as indicated in the White Paper “An Energy Policy<br />
for the European Union”, since improved energy efficiency meets all the three goals of energy policy,<br />
namely security of supply, competitiveness and protection of the environment. Lighting represents an<br />
important part of building energy consumption in the EU – around 10% of the total electricity<br />
“Lighting engineering 2006” stran 19
R-3 “Energetska učinkovitost v notranji razsvetljavi – Romunski primer”<br />
consumption, ranging from 5% (Belgium, Luxemburg) to 15% (Denmark, Netherlands, and also<br />
Japan).<br />
The global electric lighting energy use may be split in four sectors: services 48%, residential<br />
28%, industrial 16% and street lighting and other 8% (Mills 2002).<br />
Overall electric appliances in households, industry and the tertiary sector represent 40% of the<br />
EU’s total electricity consumption, its generation being one of the most important sources of CO 2<br />
emissions. Within the EU, the households and private and public services sector buildings are<br />
important power consumers. In both cases lighting represents a large part of their energy<br />
consumption. Several EU and National Initiatives and Directives tented to promote energy efficient<br />
lighting for services sector buildings. These efforts can be judged as very successful because<br />
nowadays the Compact Fluorescent Lamp (CFL) market share represent 20% of the global European<br />
market whereas the same figure in world scale is limited to 17%. The rate of the households owning<br />
a CFL covers the range from 0.8 CFLs per household in UK to more than 3 CFLs per household in<br />
Denmark; the SAVE projects have found that there is at least room for 8 CFLs per home (Kofod<br />
2002, Loe & Jones 2002, DELight 1998). An analysis on the lighting pattern in 100 Danish homes<br />
denotes that the monthly average lighting consumption varies between 5% and 21% of the total<br />
respective monthly consumption, and 24% of the lamps are energy efficient lamps (linear fluorescent<br />
lamps or CFLs). However, the same market analysis from Lighting Companies show that in Western<br />
Europe energy inefficient incandescence lamps (including halogens) still represent 30% of the sales<br />
[13]. The bulk of these inefficient light sources concern the residential sector. In Romania there are<br />
two natural barriers to implement an energy efficient lighting by using CFLs: economical - the low<br />
level of average people income - and educational - the lack of common lighting knowledge even<br />
through educated people.<br />
There are several reasons explaining that residential sector still use a large amount of GSLs:<br />
• It seems difficult to convince individual customers that the payback time is so rapid.<br />
• There are still many customers unaware of the environmental and economic benefits of CFLs.<br />
• Low quality (and probably lower cost) CFLs are widely available in the European markets, the<br />
customers buying these devices due to the attractive price are very rapidly disappointed by the<br />
reduced lifetime, bad lumen output due to wrong information from manufactures about how to<br />
replace incandescent lamps, and bad lumen maintenance of these lamps.<br />
• Older generation of CFLs were almost unable to offer to customers an acceptable ambiance<br />
within the residence, this due to poor colour rendering index, limited choice of colour<br />
temperatures, ungracious shapes and aesthetic incompatibility with luminaries; most of these<br />
inconveniences are now overcame but there is still a large part of customer unaware of that<br />
progress.<br />
• For households lighting can be purely practical or a very architectural feature or a combination of<br />
both, therefore energy efficiency is often just one consideration and probably not the prevailing<br />
one.<br />
• CFL lamps are not suitable for applications with short on-off cycles as this reduces lamp life;<br />
therefore it is necessary to educate the customer on how to use them effectively.<br />
• The warm up time of the CFL before full lumen output does that the user should not use in a<br />
staircase or elsewhere where they need the full lumen output immediately.<br />
• The common CFL lamps are very sensitive to voltage variation; of course, in many countries the<br />
mains voltage is very well regulated, but in other countries and especially eastern European<br />
regions the voltage may fluctuate and this is still an important issue for CFLs.<br />
• Finding luminaries with nice design, suitable for CFLs, is in nearly all countries, a difficult issue;<br />
many nicely designed luminaries for incandescent lamps do not look equally nice if they are used<br />
with CFLs.<br />
stran 20 Posvetovanje “Razsvetljava 2006”
“ Energy efficiency in INTERIOR Lighting – a Romanian Case Study ” R-3<br />
Promoting CFLs by using solid argumentation, which answer to the specific individual questions<br />
and fears of the customer and then add imitative measures seems to be the right way to act. It should<br />
be noticed here that “rational” arguments are not appropriate for all customer segments. To reach the<br />
last customer segment we need new CFL solution and new control features that create added value.<br />
To identify all possible reasons of using CFLs, compile them and provide the good answers<br />
(scientifically proved) and then translate them to a clear and understandable argumentation for the<br />
non-specialist, is the main barrier that needs to be addressed. Furthermore, barriers to information<br />
about energy-efficient technologies (including lighting) exist on several levels, each of which has<br />
implications for penetration rates. The most widespread problem in many countries, to varying<br />
degrees, is that of a lack of awareness of energy efficiency. Members of the general public simply<br />
cannot define what it means for a technology to be energy efficient. Information barriers are important<br />
to policy makers as well.<br />
The ultimate objective of this program is to substantially increase the efficiency of residential<br />
lighting in a number of Member States and Candidate Countries, and this can be done by offering<br />
them good arguments necessary to overcome the above cited barrier. It is also important to promote<br />
the wide-scale availability of a high spectrum of low-cost CFLs suiting a wide range of needs<br />
including different sizes, shapes, colour rendering, wattage (particular problem in some counties like<br />
Hungary is that the typical good CFLs are of lower wattage and therefore provide limited<br />
illumination levels), and bases. Furthermore, to achieve successful residential market transformation<br />
we should promote that both light fixture outlets as well as design and specialty stores display their<br />
luminaries with CFLs (good and aesthetic ones) rather than GSL. At the same time the program is<br />
aiming at promoting to all the stakeholders a quality charter to assure that the CFL that are marketed<br />
and promoted can deliver savings which last overtime and meet the customer expectations of high<br />
quality lighting.<br />
The major part of the program will design implement and evaluate a common promotional<br />
campaigns for CFLs that meet the European CFL Quality Charter along with dedicated fixtures.<br />
These national or regional campaigns shall be conducted in collaboration with lamp manufacturers,<br />
retailers, consumer and environmental organisations, and electricity utilities. On the other hand the<br />
elaboration of the argumentation should be based as deep as possible to quantitative and scientific<br />
arguments. This last, may lead to the creation or/and use of independent test facilities allowing to<br />
examine different proposed solutions before adopt them in the final argument list.<br />
All the program objectives will lead to a higher market share for the most efficient CFLs and<br />
dedicated luminaries. The main stakeholders concerned by this program are manufacturers’<br />
associations, consumers’ associations, buyer’s groups, energy agencies and other intermediates,<br />
utilities, training institutes, retailers, installers and other professions. The final beneficiaries will be<br />
end-users of equipment mainly in domestic sector.<br />
EnERLIn Consortium. 14 partners from 14 countries constitute the proposed consortium,<br />
covering a large part of Europe form north to south and from east to west. This is an important issue;<br />
because, concerning lighting the reaction of the individual customers is quite different form a country<br />
to the other (north countries prefer low colour temperatures lamps –hot ambiance- and south<br />
countries are more sensitive to high colour temperatures –cold ambiance). The consortium includes<br />
western countries with high GDPs compared to eastern countries that they just integrated EU<br />
(Poland, Hungary, Czech Rep., Latvia and Estonia). These countries are in full market transformation<br />
at this moment. Finally, two candidate countries (Bulgaria and Romania) are also members of the<br />
consortium. The EnERLIn consortium is strongly cross-disciplinary including, National or Regional<br />
Energy Agencies (ADENE, KAPE, ENEA, SEC, SEVEn, BE), one ESCO in Belgium, academic<br />
institutions (France – the coordinator CPAT - University Toulouse 3, Hungary and Romania), a<br />
values-based consultancy focusing on sustainability (Respect) as well as independent consulting<br />
“Lighting engineering 2006” stran 21
R-3 “Energetska učinkovitost v notranji razsvetljavi – Romunski primer”<br />
SMEs (Ekodoma, Energy Saving Bureau). Each partner has solid experience with EU projects<br />
(especially from DG TREN), and strong links with international organisms like CIE and projects like<br />
ELI, other European networks (COST-529) and programs (GreenLight). Some consortium partners<br />
are quite influential for policy-making bodies in both national (regional) and European levels.<br />
6 CREFEN – integrated software system for energy efficiency and saving in<br />
residential sector<br />
The CREFEN project aims to creating an integrated software system-tool focused on the<br />
applications concerning the electric energy efficient use and saving in residential sector in Romania.<br />
The project integrates the consumption assessment and prognosis methodologies, consumption<br />
scenarios, consumers’ guidance and training to the advanced technologies, sustainable electric energy<br />
management and the economical, social and environment impact, as well. A special issue is to<br />
develop the necessary databases of equipment and endowments from residential sector, using the<br />
market surveys and questionnaires.<br />
The project aims to develop an advanced modeling and simulation software system-tool of<br />
electric energy consumption in residential sector and of economical effects, to implement an<br />
application with databases, an interactive educational application and electronic book related to the<br />
energy efficiency use in order to influence the consumers’ options in selecting energy efficient<br />
appliances for environmental protection by reducing the CO 2 emissions.<br />
The National Strategy in the energy efficiency field adopted by the HG 163/2004 underlines<br />
that the residential sector has a primary energy saving potential at 3.6 millions tones equivalent petrol<br />
through 6.8 million tones of the total final consumers; it means more than 50%. This potential can be<br />
capitalized by the rehabilitation of the buildings heating insulation, the improvement of the heating<br />
and lighting systems and of the electric domestic appliances. The legislative frame was created and is<br />
on line with the EU acquis, the EU Directives related to labelling of the energy parameters for many<br />
electric appliances.<br />
The Governmental Program on the following years 2005-2008 states the necessity to<br />
accomplish the legislative and institutional frame in order to apply the flexible mechanisms adopted<br />
by the Kyoto Protocol, to pursue the implementation of the technical and economical measures for<br />
the reduction of the gas emission with the greenhouse effect, in accordance with the features of the<br />
National Plan for the Allocation of the Emission Quotas, the development of the National Plan for<br />
Climatic Changes Action, the improvement of the energy efficiency and the promotion of regenerate<br />
energies.<br />
The specific objectives of the CREFEN project are:<br />
• Drawing up of scenarios and prognosis of electric energy consumption in residential sector;<br />
• Achievement of an advanced modelling and simulation software system-tool of electric energy<br />
consumption in residential sector and of economical and environmental effects;<br />
• Using a tool for defining the potential of energy saving, prognosis and scenarios of consumption<br />
evolution;<br />
• Improvement of the degree of taking into consideration by the consumers, decision factors and<br />
specialists of the opportunities, advantages of promoting new technologies in electric energy<br />
consumption in residential sector, in the framework of a sustainable development integrated at the<br />
European level;<br />
stran 22 Posvetovanje “Razsvetljava 2006”
“ Energy efficiency in INTERIOR Lighting – a Romanian Case Study ” R-3<br />
• Designing and implementation of a web application with databases for domestic and lighting<br />
appliances available on the Romanian market, which include information from the energy label<br />
and sheet;<br />
• Designing and implementation of the software for an interactive system and an electronic book.<br />
The project is connected with energy efficient use according to EU directives from one side and<br />
with the implementation of database applications using web-based technologies for assisting and<br />
influencing the consumers decision in selecting the domestic and lighting appliances from the other<br />
side, that leading to sustainable environment management. The last aim of the project is for<br />
environmental protection by reducing the CO 2 emissions.<br />
The software application architecture will be a modular one, with the possibility of its extension<br />
with new functionalities, without perturbing the other components or requiring the reorganization of<br />
the system data.<br />
Lighting Engineering Center UTC-N work in the CREFEN project aims: (1) to analyze the<br />
Electric Lighting component in the energy balance of the dwelling; (2) to elaborate a simplified<br />
mathematical model for calculation of the inside electric lighting; (3) to present the IT system to<br />
technical background users groups (students, designers, dealers and retailers); (4) to contribute with<br />
the chapter Electric and Natural Lighting of the design specification for IT system; (5) to analyze the<br />
direct energetic and educational benefits and evaluate the importance and the impact of the<br />
improvement of the domestic users education; (6) to design consumption evaluation scenarios based<br />
on the evolution of the technological performances of the new lighting equipments (for 5 and 10<br />
years); (7) to print an informing flyer concerning the electric and natural lighting component; (8) to<br />
promote the project achievements by workshops, the ‘Ingineria Iluminatului’ (Lighting Engineering)<br />
journal and the ILUMINAT international conference.<br />
7 Analysis of electric lighting energy consumption in the residential sector in<br />
Romania<br />
The statistic data [15] for the period 2000 – 2004 allow us to determine the variation of total<br />
household consumption – Figure 3 a –, total number of household consumers – Figure 3 b –, average<br />
consumption per household consumer – Figure 4 – and of the specific consumption per m 2 – Figure 5.<br />
The analysis of the presented data allows us to estimate a few characteristics of electric energy<br />
consumption of households – Table 1.<br />
Consumption [MWh]<br />
8,100,000<br />
7,950,000<br />
7,800,000<br />
7,847,144<br />
7,971,373<br />
8,003,392<br />
Number of households<br />
8,000,000<br />
7,950,000<br />
7,975,522<br />
7,650,000<br />
7,500,000<br />
7,618,181<br />
7,514,703<br />
7,900,000<br />
7,876,671<br />
7,895,032<br />
7,896,651 7,927,416<br />
7,350,000<br />
7,850,000<br />
7,200,000<br />
2000 2001 2002 2003 2004<br />
Year<br />
7,800,000<br />
2000 2001 2002 2003 2004<br />
Year<br />
a) b)<br />
Figure 3 Variation of total household consumption (a) and total number of household consumers (b)<br />
in Romania 2000-2004<br />
“Lighting engineering 2006” stran 23
R-3 “Energetska učinkovitost v notranji razsvetljavi – Romunski primer”<br />
At the level of the EU, according to “Energy efficiency indicators in Europe” – Odysee [1], the<br />
residential consumption in 2003 was of 2533 kWh/household/year. We remark that in Romania this<br />
consumption is of about 40% of the EU level. e currently have little information with respect to the<br />
electric lighting contribution to the total energy consumption of the households in Romania. As<br />
estimation, we may count on the results of the study [4], according to which the electric lighting<br />
consumption represents around 25% of the total electric energy consumption of the studied<br />
households.<br />
Consumption [kWh/household/year]<br />
1100<br />
Consumption [kWh/m2]<br />
29<br />
1000<br />
967<br />
952<br />
994<br />
1006<br />
1003<br />
27<br />
25.87<br />
26.58<br />
26.89<br />
26.84<br />
25.46<br />
900<br />
2000 2001 2002 2003 2004<br />
Year<br />
25<br />
2000 2001 2002 2003 2004<br />
Year<br />
Figure 4 Average energy consumption 2000-2004 Figure 5 Household consumption per m 2 in Romania<br />
* the average value of 37.39 m 2 per household in<br />
Romania has been considered.<br />
Table 1 Characteristics of electric lighting energy consumption in households in Romania.<br />
Year 2000 2001 2002 2003 2004<br />
Total annual electric lighting<br />
consumption<br />
Annual electric lighting<br />
consumption per household<br />
[x10 3 MWh] 1,938 2,028 1,996 2,028 2,036<br />
[kWh/household/year] 246 257 253 256 255<br />
Annual electric lighting<br />
consumption per m 2 [kWh/m 2 /year] 6.58 6.87 6.76 6.84 6.83<br />
Annual cost of electric lighting<br />
consumption per household<br />
[Euro/household/year] 38.57 39.57 39.19 39.47 39.42<br />
Note: The total annual household consumption in Romania has been determined considering the<br />
sales of Electrical National Company towards the household consumers and the average contribution<br />
of the consumption on the lighting circuits (25%); The annual electric lighting household<br />
consumption per m 2 was determined based on the average household surface in Romania in 2002 –<br />
37.39 m 2 /household; an average exchange rate of 3.50 RON/Euro.<br />
A comparison of the information presented in [7] to the data presented in this study is shown in<br />
Table 2. The increase in the annual household electric lighting energy consumption in 2004 vs. 2000,<br />
of 3.61%, correlated with the continuous increase of the number of household subscribers in<br />
Romania of 1.24% (2004 vs. 2000) – Figure 3 a, determine the necessity to adopt measures of energy<br />
efficiency in the household lighting of Romania.<br />
The total energy consumption dropped from 60 TWh/year in 1996 to 33.8 TWh/year in 2005,<br />
according to the data received from the national company of electricity. For the same period, the<br />
weight of the residential consumption increased significantly, partly due to the massive reduction of<br />
industrial consumption after 1989, but as well, to a continuous increase of the number of household<br />
subscribers.<br />
stran 24 Posvetovanje “Razsvetljava 2006”
“ Energy efficiency in INTERIOR Lighting – a Romanian Case Study ” R-3<br />
Table 2 Characteristics of electric lighting energy consumption in the residential sector in<br />
Romania; comparative study based on data in [1] and [7].<br />
Electricity consumption<br />
Total electricity consumption (TWh/an)<br />
Residential electricity consumption (TWh/an)<br />
Residential lighting electricity consumption (TWh/an)<br />
Household lighting – Information<br />
Household lighting electric energy consumption (kWh/an)<br />
Number of lamps per household<br />
Average number of CFL per household<br />
Household ratio using CFL<br />
Average number of CFL per household using CFL<br />
Number of luminaries per household<br />
Households – Information<br />
Number of households (x10 6 )<br />
Number of persons per household<br />
Average surface (m 2 )<br />
Prices<br />
Price of electric energy per kWh<br />
0 – 50 kWh<br />
50 – 100 kWh<br />
>100 kWh<br />
Price of GSL<br />
Price of CFL<br />
Note: The average exchange rate of 3.50 RON/Euro has been used<br />
DELight 1998 UTC-N 2005<br />
60.0 (1996)<br />
7.1<br />
n.a. (1996)<br />
n.a. (1995)<br />
9<br />
0.006 (1995)<br />
0.5 (1995)<br />
1.1 (1995)<br />
5.5<br />
7.78 (1995)<br />
2.91 (1994)<br />
n.a.<br />
1996 (ecu)<br />
0.008<br />
0.019<br />
0.041<br />
0.3 ecu<br />
13.2<br />
33.8<br />
8.001<br />
~2.036<br />
~255.3<br />
11.5<br />
1.11<br />
0.47<br />
4.02<br />
7.16<br />
7.97<br />
2.63 (2002)<br />
37.39<br />
2005 (Euro)<br />
0.38<br />
0.0921<br />
0.43 Euro<br />
4.3<br />
The cost of CFLs mainly depend on their life span, the cheapest having a life of 3 years, the<br />
typical cost in Romania being between 2.9 – 4.3 Euro, and the more expensive ones have a life span<br />
of 8-10 years and a price of 8.6 – 11.4 Euro. Since the electric energy consumption of these lamps is<br />
much lower and has a much smaller cost (only 20% of the cost of GSL, the cost of the initial<br />
investment may be recovered in 3 – 12 months, depending on the cost of the CFL, after which up to<br />
8.0 – 9.0 Euro per lamp per year is saved.<br />
The use rate of CFLs is from 0.8 units per household in Great Britain up to over 3 units per<br />
household in Denmark. Projects from the SAVE programme consider as a reasonable upper limit the<br />
use of up to 8 units per household. An analysis of the residential lighting, realized in 100 households<br />
in Denmark, shows a lighting consumption of between 5% and 21% of the total monthly electric<br />
energy consumption of the household and the use of 24% saving lamps – linear fluorescent lamps<br />
and compact fluorescent lamps.<br />
During November 2005 a study has been realized using feed-back reply forms concerning the<br />
usage degree of GSL and CFLs in households in Western Romania. We received 295 replies, namely<br />
220 apartments (with 1–4 rooms) and 75 houses (with 2–more than 7 rooms). The light source<br />
equipment in these households is presented in Table 3.<br />
Table 3 Light source usage statistics for GSL and CFLs in Romanian households.<br />
Household GSL CFL Installed power<br />
Type No. Units Average Units Average kW<br />
Apartment 220 2624 11.98 367 1.67 0.770<br />
Single-family<br />
house<br />
75 1088 14.51 196 2.61 1.028<br />
Total 295 3712 12.58 563 1.91 0.835<br />
“Lighting engineering 2006” stran 25
R-3 “Energetska učinkovitost v notranji razsvetljavi – Romunski primer”<br />
The installed lighting power has an average value of 0.835 kW/household.<br />
From the analysis of the data presented above we may conclude that the CFL energy saving<br />
lamps are bought by people with high earnings, which own houses. We consider the equipping<br />
degree with CFLs of approximately two units per household is high, and this denotes the interest of<br />
Romanian consumers for buying energy saving lamps.<br />
8 REFERENCES<br />
[1] Alexandru Adriana, coordinator. CREFEN – Informatic integrated system for energy efficiency and saving in<br />
residential sector – CEEX programme, Contract C608/2005, 2005-2008.<br />
[2] Atanasiu B., Bertoldi P. Report on Electricity End Use Consumption in New MS and CC in Tertiary and<br />
Residential Sectors, July 2005, JRC - Ispra.<br />
[3] Berrutto V., Bertoldi P. European Commission energy-efficient lighting initiatives. Proceedings of the 25th<br />
Session of the CIE (San Diego, USA, 25 June - 2 July 2003). ISBN 3901-90621-5.<br />
[4] Beu D., coordinator. Study concerning the energy efficiency of the residential electric appliances – SEEC –<br />
Universitatea Tehnica Cluj-Napoca (RO), grant Gr 6113/2000<br />
[5] Beu, D. Lighting systems in obstructed spaces. Ph.D. Thesis, Technical University of Cluj-Napoca, 2000<br />
[6] Beu, D., Pop F., Residential and Commercial Survey for a Romanian Energy Efficient Lighting Program,<br />
ENEF 2002, Banska Bystrica, 2002<br />
[7] Environmental Change Unit. Domestic Efficient Lighting (DELight), University of Oxford (UK), 1998. ISBN<br />
1-874370-20-6.<br />
[8] European Commission. Commission Directive 98/11/EC of 27 January 1998 implementing Council Directive<br />
92/75/EEC with regard to energy labelling of household lamps, Official Journal L71, 10.03.1998, pp. 01-08.<br />
[9] Leslie RP, Conway Kathryn M., 2000, The Lighting Pattern Book for Homes, Lighting Research Center,<br />
Reansealer Polytechnic Institute<br />
[10] Lewis J.O., coordinator. EnerBuild RTD Network - FP5 programme, 2001-2003.<br />
[11] Pop F. Energy efficiency in lighting between regulations and reality, Proceedings of Workshops Budapest,<br />
Prague, Warsaw, Newly Associated States EnerBuild RTD, 2003, ISBN 80-239-0742-5, pp. 38-42<br />
[12] Pop F., Beu D., Ciugudeanu C. Promoting actions for lighting energy efficiency and saving in residential<br />
buildings in Romania, International Conference on Energy Efficiency in Domestic Appliances and Lighting –<br />
EEDAL’06, London, June 2006<br />
[13] Zissis G., co-ordinator. European Efficient Residential Lighting Initiative - EnERLIn, EIE “Intelligent Energy –<br />
Europe” programme Grant EIE/05/176/SI2.419666, 2006-2008.<br />
[14] Zissis G, Progress accomplished in the frame of EnERLIn project during the first 6-month operation, Ingineria<br />
Iluminatului, vol. 8, No. 17 - Summer, 2006<br />
[15] Statistic data 2003. Romanian Statistic National Institute.<br />
[16] U.S. Department of Energy, EERE Consumer's Guide Compact Fluorescent Lamps, Energy Efficiency and<br />
Renewable Energy<br />
9 Naslov avtorja / Authors’ address:<br />
Dr. Florin Pop, professor<br />
Dr. Dorin Beu, reader<br />
Lighting Engineering Center, Technical University of Cluj-Napoca<br />
RO 400020 Cluj-Napoca, 15 C. Daicoviciu Street<br />
Romania<br />
Tel.: +40745. 516276 (Pop); +40723. 661536 (Beu)<br />
Fax: +40264. 592055<br />
Email: florin.pop@insta.utcluj.ro<br />
dorin_beu@cluj.astral.ro<br />
stran 26 Posvetovanje “Razsvetljava 2006”
“Colour rendering index of LED light sources” R-4<br />
Schanda J. and Madár G.<br />
COLOUR RENDERING INDEX OF LED LIGHT SOURCES<br />
Abstract<br />
LEDs are widely used in signalling applications and in large surface displays. In recent<br />
times white light emitting LEDs start to become used in general lighting as well.<br />
The spectral power distribution of white LEDs differs considerably from the power<br />
distribution of traditional light sources, thus it is not to wonder that the colour rendering<br />
index developed for classical fluorescent lamps does not works properly for LEDs. In our<br />
Laboratory we have investigated the colour rendering of traditional light sources and of<br />
LEDs of different construction (blue chip plus yellow phosphor and Red-, Green-, Blue-LED<br />
combination), both determining the colorimetric characteristics and evaluating their visual<br />
colour rendering properties. We could determine the differences between the mathematical<br />
method and the visual one.<br />
We have developed a number of new methods to investigate the colour rendering<br />
characteristics of LEDs, among others based on colour harmony and a preference type of<br />
study, also using simulation techniques. This paper will show the methods we used, together<br />
with some examples how light sources with different spectral power distribution influence<br />
the visual appearance of an environment, and how this could be described.<br />
Keywords: colour, colour rendering, LEDs.<br />
Povzetek<br />
Indeks barvnega videza svetil s svetlečimi diodami; Svetleče diode (LED) so široko<br />
uporabljajo v signalnih napravah ter v velikih svetlobnih panojih. V zadnjem času pa se bele<br />
svetleče diode vse bolj uporabljajo tudi v splošni razsvetljavi. Spektralna sestava svetlobe<br />
bele svetleče diode precej odstopa od spektralne sestave svetlobe tradicionalnih svetlobnih<br />
virov. Zato ni čudno, če se postopek določevanja indeksa barvnega videza, ki je bil razvit za<br />
klasične fluorescenčne sijalke, pri svetlečih diodah ne obnese najbolje. V našem laboratoriju<br />
smo raziskali reprodukcijo barve pri tradicionalnih svetlobnih virih ter pri belih svetlečih<br />
diodah različnih tipov (modra LED z oranžnim fosforescenčnim premazom ter kombinacija<br />
modre, zelene in rdeče LED). Določili smo kolorimetrične lastnosti in ovrednotili njihovo<br />
vidno reprodukcijo barv ter prišli do ugotovitve, da obstaja razlika med matematično in<br />
optično metodo. Na podlagi tega smo razvili več novih metod za proučevanje barvne<br />
reprodukcije pri svetlečih diodah, med drugim temelječe tudi na barvni harmoniji in<br />
simulacijah. Članek prikazuje metode, ki smo jih uporabili, skupaj z primeri, kako svetlobni<br />
viri z različnimi spektralnimi vsebinami svetlobe vplivajo na vidno zaznavanje okolice in<br />
kako je ta vpliv možno opisati.<br />
Ključne besede: barva (svetlobe), barvna reprodukcija, indeks barvnega videza,<br />
svetleče diode<br />
“Lighting engineering 2006” stran 27
R-4 “Indeks barvnega videza svetil s svetlečimi diodami”<br />
1 Introduction<br />
The light source industry is currently in a major revolution, changing the light source<br />
construction from a glass (or ceramic) bulb and some gas filling construction to solid state. Several<br />
nations (Japan, USA) have started centrally funded projects to develop efficient solid state light<br />
sources: Light emitting diodes (LEDs) and organic light emitters (OLEDs). These sources have very<br />
different spectral power distributions (SPD) compared with traditional light sources, and to optimise<br />
these SPDs one needs the understanding not only of the technological questions of producing these<br />
sources, but also the lighting and visual perception issues coupled to these special SPDs. In the<br />
present paper we will deal only with inorganic LEDs, as these are already in the phase of<br />
development where they provide important competition to traditional light sources, but their<br />
application might end up in frustration if their special spectral characteristics are not well taken into<br />
consideration.<br />
The three most important photometric and colorimetric characteristics of a general purpose lamp<br />
are: efficacy (output lumen per input watts), lamp-light colour (correlated colour temperature) and<br />
colour rendering (colour rendering index). While the first two of these descriptors provide the<br />
possibility to compare LEDs with traditional light sources without any difficulty, colour rendering is<br />
a different issue, due to the very different SPDs of the LEDs.<br />
2 Colour rendering and its traditional descriptor<br />
The CIE defined colour rendering in the International Lighting Vocabulary 1 as:<br />
“Effect of an illuminant on the colour appearance of objects by conscious or subconscious<br />
comparison with their colour appearance under a reference illuminant.”<br />
The first and most difficult problem of this definition is that it requires “a reference illuminant”,<br />
but leaves open the selection of the reference illuminant. The CIE Technical Committee that was<br />
responsible to develop the test method had long discussions on this question, because the selection of<br />
the reference illuminant has profound influence on the calculation result 2 . Finally it was decided to<br />
use black-body radiation of the same CCT as the test source CCT below 5000 K and phases of<br />
daylight above this CCT. This meant on one side that there are an infinite number of reference<br />
illuminants, and that e.g. an incandescent lamp with a CCT of 2900 K will have the same good<br />
colour rendering as natural daylight. Ever since making this decision, the question has been debated,<br />
but no acceptable solution was found.<br />
A second problem was that the definition calls for colour appearance comparison, but no colour<br />
appearance difference metric has been accepted internationally up to now.<br />
For practical reasons the CIE finally decided to describe colour rendering in the form of average<br />
colour differences – in those days in the U*, V*, W* colour space 3 , defining eight test samples with<br />
low chroma and six further ones (high chroma and often encountered colours). A short description of<br />
the history of the colour-rendering index (CRI) can be found in 4 .<br />
First major problems of the current colour rendering index method were encountered at the time<br />
when the three-band fluorescent lamps were introduced: the narrow band emission spectra of these<br />
lamps, developed specially to achieve a high colour rendering index and efficacy, did not give good<br />
visual colour rendering 5,6,7,8,9,10 . As LED sources have also narrow band emission it was not<br />
surprising that the current colour rendering index determination method does not work well with<br />
LEDs.<br />
stran 28 Posvetovanje “Razsvetljava 2006”
“Colour rendering index of LED light sources” R-4<br />
3 Types of white LEDS<br />
LEDs are characteristically narrow band emitters, with spectral bandwidth of 30 nm to 50 nm.<br />
White light can be produced with such sources in two forms: using a short wavelength emitting LED<br />
(near UV or deep blue emitting one) and a phosphor that converts part of this light into longer<br />
wavelength radiation (p-LED), so that the mixture of the radiation of the LED itself and that of the<br />
phosphor layer produce white light. The other possibility is to mix the light of three well selected<br />
LEDs, a red-, a green- and a blue-emitting one (RGB-LED), eventually taking also a fourth, orangeyellow<br />
LED (RYGB-LED) to fill up a gap in the emission spectrum between the green and the red<br />
emission. Spectra of such representative LEDs of high CCT is seen in Figure 1. The p-LED and the<br />
RGB-LED have low CRI, the RYGB-LED has a much higher CRI.<br />
rel. intensity<br />
1<br />
0.9<br />
YAG -white, Ra"81<br />
3-LED, Ra= 83<br />
0.8<br />
4-LED, Ra= 89<br />
0.7<br />
DaylRef., Ra=100<br />
0.6<br />
0.5<br />
0.4<br />
0.3<br />
0.2<br />
0.1<br />
0<br />
350 400 450 500 550 600 650 700 750 800<br />
wav elength, nm<br />
Figure 1: Representative spectra of a p-LED and an RGB-, as well as RYGB-LED, together with the reference<br />
daylight spectrum.<br />
At this place we can not deal with the problems of colour stability of 3 and 4 LED combinations,<br />
we just would like to mention that this needs active feed-back circuits, but from the colour rendering<br />
and efficacy point of view the RYGB-LEDs are very promising.<br />
4 Colour rendering index of the LEDS<br />
Figure 2 shows approximate colour reproductions of the eight basic CIE test samples if<br />
illuminated by the reference and the three LEDs. Figure 3 shows similar colours for the six<br />
supplementary colours: strong red, yellow, green and blue, as well as complexion and leave green. In<br />
every sample the ∆E ab * colour differences between the test sample illuminated by the reference<br />
illuminant and the particular test source can be seen. (The author is indebted Dr. Yoshi Ohno for<br />
lending the program that enabled the reproduction of these colours.)<br />
Figure 2: Approximate colour reproduction of the eight<br />
basic CIE test samples by the three selected LEDs, who’s<br />
SPDs are shown in Figure 1.<br />
“Lighting engineering 2006” stran 29
R-4 “Indeks barvnega videza svetil s svetlečimi diodami”<br />
Figure 3: Approximate colour reproduction of the six<br />
supplementary CIE test samples by the three selected LEDs,<br />
who’ SPD is shown in Figure 1.<br />
As it can be seen the RGB-LED is particularly poor in case of the reddish and blue hues. Visual<br />
inspection not always supports this statement, especially if the reflectance spectrum of the test<br />
sample differs from that of the CIE test sample’s reflectance spectrum, as is often the case if real life<br />
samples are considered. To test this we have prepared metameric samples by printing on two<br />
different ink-jet printers and a laser printer. An example is seen on Figure 4..<br />
Figure 4: Metameric samples used in colour rendering<br />
calculations.<br />
Using such metameric samples colour rendering indices were calculated for a number of light<br />
sources 11 . As can be seen in Figure 5 just in case of the critical R a =75 to 80 range the sample<br />
spectrum has a profound influence on the CRI.<br />
Figure 5: Metameric CRI versus classical CRI for a<br />
number of sources.<br />
stran 30 Posvetovanje “Razsvetljava 2006”
“Colour rendering index of LED light sources” R-4<br />
5 Updating the CIE test method<br />
During the past decades several attempts were made to update the test method for colour<br />
rendering determination.<br />
Investigations were carried out to test the usefulness of the CIE Test Samples 12,13,,14,15 and the<br />
chromatic adaptation formulas 16,17 , testing the method for practical sources as well 18 . CIE tackled the<br />
question several times, technical committees were established, and after five to ten years closed<br />
down, as they could not find a solution that every party would have agreed upon. The last such<br />
committee, CIE TC 1-33, was established in 1991 and closed down in 1999. It was unable to<br />
recommend a new colour rendering index formula, but published its closing remarks 19 , and in this<br />
publication formulated some ideas that could provide guidance for future research.<br />
Visual experiments were performed already before the new proposal (see e.g. 20 ) and further<br />
experiments were started 21,22 partly to get an alternative description of colour rendering 23 . These<br />
experiments have shown that there are certainly better ways to describe the colour rendering<br />
properties of light sources, especially of white LED sources, where the white colour is produced by<br />
mixing the light of some red-, green- and blue LEDs. The CIE Division 1, responsible for light,<br />
colour and vision decided not to change the current colour rendering index calculation method, but to<br />
develop a new descriptor, such as “colour appearance rendering” or “colour quality index”. A<br />
Technical Committee was established in 2006 to investigate this question.<br />
6 Supplementary methods to describe colour quality of light sources<br />
The wish to supplement colour rendering with further quality descriptors is not new. Judd coined<br />
the term flattery index already in 1967 24 . The flattery index was intended to describe whether a light<br />
source renders colours in a more pleasant (flattery) way then an other source. Jerome discussed the<br />
differences between flattery and rendition in detail 25 . Later the word preference was used instead of<br />
flattery 26 . Thornton’s calculation showed that colour rendering and colour preference indices do not<br />
have their optimum value at the same spectral distribution 28 . Some experiments tried to combine the<br />
colour preference and colour rendition aspect in such a way that the maximum of colour rendition<br />
remained if the test source had the same SPD as the reference illuminant, but the worsening of the<br />
index was slower if the colour difference between the sample illuminated by the test source<br />
compared to the illumination by the reference illuminant deviated in the direction of higher chroma,<br />
or e.g. in case of complexion towards redder hues 27 . Other ideas went into the direction to develop a<br />
colour discrimination index, as there are a number of tasks where the discrimination between small<br />
colour differences is important 28,29 . All these can be supported by simulation experiments 30 . Also<br />
Davis and Ohno published on improved colour quality metrics 31 .<br />
The comfort experience in an interior setting is also influenced by the colour quality of the<br />
lighting. Bellchambers investigated visual clarity 32 and found correlation between visual clarity,<br />
illumination and colour rendering. Other investigations tried to correlate the different aspects of<br />
lighting quality as well (see e.g. 33 ).<br />
An interesting new approach is based on the hue shift of many colours that shows which hues are<br />
highly distorted compared to a reference and which are rendered correctly 34,35 .<br />
7 Colour quality simulation<br />
Our recent studies go in a similar direction by starting from the supposition that if a designer has<br />
carefully chosen the colours of an environment to be pleasant under one light source, i.e. the observer<br />
“Lighting engineering 2006” stran 31
R-4 “Indeks barvnega videza svetil s svetlečimi diodami”<br />
gets a harmonious impression of the environment, then an other light source will be accepted if after<br />
chromatic adaptation the colours of the environment stay harmonious 36 . We based our experiments<br />
on McCann’s observation that when the shift of each colour in a set goes in a systematic order (e.g.<br />
all hues shift in the same direction, or all colours get lighter or darker, or all chroma increases or<br />
decreases) the result is more acceptable compared to a colour distortion when the colours move in<br />
different directions in colour space.<br />
Figure 6 shows this on an example of McCann 37 : Compared to the original the copy on the right<br />
side was made lighter and more yellow; in the copy on the left the average colour difference to the<br />
original is of the same value, but hue, lightness and chroma of the single patches was moved in<br />
arbitrary directions.<br />
Figure 6: McCanns experiment demonstrating that a<br />
systematic change in colours (Copy A) looks better then a<br />
random one (Copy B).<br />
Similar effects are produced by changing a reference source to a test source in illuminating a<br />
multi coloured test sample.<br />
Figure 7 shows the shift in hue and chroma for a harmonious set of colours (Munsell “diminshing<br />
series”), due to changing the illumination from the reference illuminant to an LED test illuminant 38 .<br />
Figure 7: Color coordinates of a Munsell harmonious set<br />
called “Diminishing series” under a reference illuminant<br />
(blue squares), and under a white RGB LED light source<br />
(pink circles).<br />
While the rather large change in colour for the yellow and reddish hues would not be perceived<br />
as unpleasant if only the patches Number 1 to 3 would be seen, but the colour shift of patch Number<br />
4, 5 and 6 distorts the harmony of the arrangement.<br />
The development of a reasonable colour appearance model 39 enables the display of scenes<br />
transformed to that under a reference illuminant on a visual display unit. We have performed such<br />
simulated scene comparisons, requesting observers to compare a scene as would look under a<br />
reference illuminant (CIE D65) and under a test illuminant. Table 1 shows the selected sources and<br />
their correlated colour temperature<br />
stran 32 Posvetovanje “Razsvetljava 2006”
“Colour rendering index of LED light sources” R-4<br />
Table 1: Light source characteristics used in the present experiment<br />
Description of<br />
light source<br />
Correlated<br />
colour<br />
temperature, K<br />
Ra<br />
CIE A 2856 100<br />
CIE D65 6505 100<br />
FL 3.5 4086 96<br />
FL 3.12 2984 93<br />
FlLamp 7226 87<br />
CIE FL 7 6497 86<br />
CIE FL 11 3999 83<br />
p-LED (cool) 9310 80<br />
p-LED (warm) 2976 77<br />
CIE FL 2 4225 64<br />
CIE FL 4 2938 51<br />
RGB-LED1 2788 44<br />
RGB-LED2 2788 27<br />
RGB-LED3 2788 -17<br />
In this new experimental paradigm the image of a scene was selected, where the spectral<br />
reflectance was known for every pixel. In the present experiment we used an image kindly supplied<br />
by Nascimento and co-workers 40 . Figure 8 shows the image rendered as it would look under D65<br />
illumination. The test images were calculated from this hyperspectral image, using the SPDs of the<br />
sources enumerated in Table 1.<br />
Figure 8: Image used in the present experiment.<br />
The white point of the generated test image is the white<br />
point of the test illuminant it was calculated under. The main<br />
concept of the simulation is that all images are shown in the<br />
same chromatic adaptation environment (CRT display) to<br />
eliminate factors such as colour memory effects that can<br />
affect the result of the experiments negatively. The<br />
CIECAM02 colour appearance model was used to transform<br />
both images (illuminated by the test and the reference<br />
illuminant) to D65, the white point of the monitor. This way<br />
the differences between the colour appearances produced by<br />
the test illuminants, independently of the CCT of the source<br />
could be observed and judged.<br />
7.1 Experiment<br />
In the experiment to be discussed here three images were shown simultaneously on the screen at<br />
one time in two rows. There were two images in the upper row and there was one in the middle of the<br />
lower row. The lower image was fixed and showed the reference image. The observers’ task was to<br />
“Lighting engineering 2006” stran 33
R-4 “Indeks barvnega videza svetil s svetlečimi diodami”<br />
answer the question that from the two test images shown in the upper row which one was more<br />
similar to the reference image than the other one.<br />
For each test person all images were shown in random order paired with all other images. This<br />
enabled to rank order the light sources, using Thurstone’s method of paired comparisons 41 , to<br />
evaluate lamp-light quality compared to an ideal illuminant (Illuminant D65, as it is generally<br />
accepted that best colour fidelity is achieved under daylight illumination) ∗ .<br />
Table 2: Result of the experiment<br />
Visual<br />
Rank<br />
Order<br />
Description of<br />
light source<br />
Correlated<br />
colour<br />
temperature,<br />
K<br />
Colour<br />
rendering,<br />
Ra<br />
Ref. CIE D65 6505 100<br />
1 FlLamp 7226 87<br />
2 CIE FL 7 6497 86<br />
3 CIE FL 11 3999 83<br />
3 FL 3.5 4086 96<br />
5 p-LED (cool) 9310 80<br />
6 CIE A 2856 100<br />
7 p-LED (warm) 2976 77<br />
8 FL 3.12 2984 93<br />
9 CIE FL 2 4225 64<br />
10 CIE FL 4 2938 51<br />
11 RGB-LED1 2788 44<br />
12 RGB-LED2 2788 27<br />
13 RGB-LED3 2788 -17<br />
Statistical significance of above data will be discussed in a more detailed report.<br />
8 Discussion<br />
Analysing the results shown in Table 2 one can draw the following conclusions:<br />
Sources with high CCT got high ranking, although CCT is not the only factor influencing the<br />
quality index: warm white sources, as p-LED (warm) and FL 3.12 got higher ranking than CIE FL 2,<br />
a source of higher CCT, but with relatively low CRI.<br />
But colour rendering index is also not the ordering parameter: CIE FL 11 and FL 3.5 have almost<br />
the same CCT, but the source with lower CRI was ranked higher than the other. The same can be<br />
seen in case of the p-LED and FL 3.12.<br />
The relatively good ranking of the two p-LEDs shows clearly that CRI is not a good descriptor of<br />
lamp-light quality, a statement often heard as anecdotic remark.<br />
The three RGB-LEDs rank at the bottom of the scale, having also low CRI values.<br />
∗<br />
A second experiment, dealing with colour preference, will be discussed in an other paper.<br />
stran 34 Posvetovanje “Razsvetljava 2006”
“Colour rendering index of LED light sources” R-4<br />
9 Conclusions and work in progess<br />
Our simulation experiment showed clearly that the method of showing the images of one scene as<br />
it would look under different illuminants – but after chromatic adaptation – is a valid method to<br />
investigate lamp-light colour quality.<br />
Experiments are under way in three directions:<br />
1. Using other scenes, especially one where humans are also in the picture, as complexion<br />
colour is one of the most significant colours for both colour rendering and colour preference.<br />
2. Selection of sources will be slightly modified: four colour (RYGB) LEDs will be included,<br />
and both at low and high CCT three and four colour LEDs will be simulated.<br />
3. With the most critical sources the simulation experiment will be supplemented with real-life<br />
situations, using our double booth experimental set-up, that we used to show that the present<br />
CRI test method fails for quite a number of sources, and that the colour difference evaluation<br />
in the CIECAM02 space gives better correlation with visual observation 42 .<br />
We hope that based on such experiments, and using our colour harmony experiment results as<br />
well, it will be possible to come up with a lamp-light quality index that correlates better with visual<br />
evaluation than the present CIE CRI Test Method.<br />
10 Acknowledgements<br />
Authors would like to thank the Miescher Foundation for its continuous support. They are also<br />
indebted to OSRAM Opto Semiconductors for kindly supplying some LEDs used in the oral<br />
demonstration of this paper.<br />
11 References<br />
1<br />
2<br />
3<br />
4<br />
5<br />
6<br />
7<br />
8<br />
9<br />
10<br />
11<br />
12<br />
13<br />
CIE International Lighting Vocabulary. Publication. CIE 17.4-1987.<br />
Ouweltjes JL. (1969) Chromatic adaptation and colour rendering of light sources. Compte Rendu 1st AIC Colour<br />
Congress „Color 69” Stockholm 831-838.<br />
CIE (1974) Method of measuring and specifying colour rendering of light sources. Publication CIE 13.2 (TC-3.2) 1974.<br />
Schanda J (2006) Colour rendering of light sources. Chapter 8 in Colorimetry – Understanding the CIE System, ed.: J<br />
Schanda, Wiley under print.<br />
Thornton WA. (1971) Luminous and colour-rendering capability of white light. J of OSA 61 1155-1163.<br />
Koedam M, Opstelten JJ, Radielovic D (1972) The application of simulated spectral power distributions in lamp<br />
development. J. IES 285-289.<br />
Opstelten JJ, Radielovic D. Wanmaker WL (1973) The choice and evaluation of phosphors for application to lamps with<br />
improved color rendition. J. Electrochem. Soc. 120 1400-1408.<br />
Walter W (1977) Optimum lamp spectra. IES Techn. Conf. Aug. 1977 New York.<br />
Verstegen J. Radielovic D, Vrenken LE. A new generation of "deluxe" fluorescent lamps combining an efficacy of 80<br />
lumens/w or more with a color rendering index of approximately 85. A Survey of Phosphors, 121/12, 1627-1631.<br />
Valberg A; Seim T; Sällström P (1979) Colour rendering and the three-band fluorescent lamp. Annex 6 to Circular 2/80,<br />
Meeting of the CIE 1979, Kyoto, August, 26 p.<br />
Schanda J and Sándor N (2003) Colour rendering, Past - Present – Future. Cap Town Colour Conf.<br />
Opstelten JJ (1980) The dependence of the general colour rendering index on the set of test colours, the standard<br />
observer and the colour-difference formula. Lighting Res. & Technol. 12 186-194.<br />
Schanda J (1985) The influence of the test samples used for calculating colour rendering indices. AIC Congress<br />
COLOUR Monte Carlo, 6 p.<br />
“Lighting engineering 2006” stran 35
R-4 “Indeks barvnega videza svetil s svetlečimi diodami”<br />
14<br />
Rea MS, Robertson AR, Petrusic WM (1990) Colour Rendering of Skin under Fluorescent Lamp Illumination. COLOR<br />
Res. & Appl. 15 80-92.<br />
15<br />
Hisdal B (1993) Colour samples and colour rendering of light sources. Lighting Res. Technol. 25 13-17.<br />
16<br />
Fuchida T, Mori L (1982) Comparison of correcting methods for chromatic adaptation used for color-rendering<br />
specification. COLOR Res. & Appl. 7 294-301.<br />
17<br />
Schanda J (1982) Chromatic adaptation and colour rendering. CIE Journal 1/2 30-37.<br />
18<br />
Guo X, Houser KW (2004) A review of colour rendering indices and their application to commercial light sources,<br />
Lighting Res. Technol. 36 183-197.<br />
19<br />
Commission Internationale de l’Eclairage: Colour rendering, TC 1-33 closing remarks. Publ. CIE 135/2 1999.<br />
20<br />
Kambe N, Mori L (1971) Visual judgements of color rendering properties of light sources. Proceedings of CIE,<br />
Barcelona 21A, 135-140.<br />
21<br />
Sándor N, Bodrogi P, Csuti P, Kránicz B, Schanda J (2003) Direct visual assessment of colour rendering. Proc. CIE<br />
Session San Diego 2003, CIE Publ. CIE 152:2003 D1-42-45.<br />
22<br />
Sándor N, Csuti P, Bodrogi P, Schanda J. Visual observation of colour rendering. Proc. CIE Symposium '04, LED light<br />
sources. CIE x026:2004 16-19.<br />
23<br />
Yaguchi H, Takahashi Y, Shioiri S (2001) A proposal of color rendering index based on categorical color names.<br />
Internat. Lighting Congress, Istanbul 2001.<br />
24<br />
Judd DB (1967) A flattery index for artificial illuminants. Illum. Engng 62 593-598.<br />
25<br />
Jerome CW (1972) Flattery versus rendition. J. of IES April 1972 208-211.<br />
26<br />
Thornton WA (1974) A validation of the color-preference index. J. IES 48-52.<br />
27<br />
Schanda J (1985) A combined colour preference-colour rendering index. Lighting Res. & Technol. 17 31-34.<br />
28<br />
Thornton WA (1972) Color-discrimination index. J. of OSA 62 191-194.<br />
29<br />
Schanda J, Czibula G (1980) New description of color discrimination properties of light sources. Acta Chromatica 3/5<br />
209-211.<br />
30<br />
Davis W, Gardner JL, Ohno Y (2005) NIST facility for color rendering simulation. Proc. AIC Colour 05 Part 1. 519 -<br />
522.<br />
31<br />
Davis W and Ohno Y (2005) Toward an Improved Color Rendering Metric, Proc. Fifth International Conference on<br />
Solid State Lighting, SPIE Vol. 5941, 59411G.<br />
32<br />
Bellchambers HE (1972) Illumination, colour rendering and visual clarity. Lighting Res. & Technol. 4 104-106.<br />
33<br />
Schanda, J (1978) Colour rendering and the impression of comfort with artificial illumination. Information Couleur, 3/2<br />
23-28.<br />
34<br />
Kemenade JTC, Burgt PJM (1988) Light sources and colour rendering: additional information to the Ra-index. Nat.<br />
Lighting Conf. Cambridge – 1988.<br />
35<br />
Kemenade van JTC, Burgt van der PJM (1995) Towards a user oriented description of colour rendition of light sources.<br />
Proc. 23rd Session of the CIE, CIE119/1. 43 - 46.<br />
36<br />
Schanda J, Madár G, Sándor N, Szabó F. (2006) Colour rendering - colour acceptability 6th Internat. Lighting Res.<br />
Symp. On Light and Color, Florida Feb. 2006.<br />
37<br />
McCann J (2002) A spatial colour gamut calculation to optimise colour appearance. In Colour Image Science, Exploiting<br />
Digital Media, ed.: LW MacDonald and MR Luo, John Wiley & Sons, Ltd. Chichester UK.<br />
38<br />
Szabó F, Bodrogi P, Schanda J (2006) Comparison of Colour Harmony Models: Visual Experiment with Reflecting<br />
Samples Simulated on a Colour CRT Monitor. CGIV2006 Conf. Leeds.<br />
39<br />
CIE (2004) A colour appearance model for colour management systems: CIECAM02. CIE Publ. 159:2004.<br />
40<br />
Nascimento SMC, Ferreira F and Foster DH (2002) Statistics of spatial cone-excitation ratios in natural scenes. J. Opt.<br />
Soc. Am. A, 19 1484-1490.<br />
41<br />
Thurstone LL (1927) The Method of Paired Comparisons for Social Values. J. Abnormal and Social Psychology 21 384-<br />
400.<br />
42 Sándor N, Schanda J (2005) Visual colour-rendering experiments. Proc. AIC Conference, Granada pp.: 511-514.<br />
Authors address:<br />
dr. Madár, Gábor<br />
dr. Schanda, János<br />
University of Pannonia<br />
Egyetem u. 10.<br />
H-8200Veszprém, Hungary<br />
stran 36 Posvetovanje “Razsvetljava 2006”
“Lighting Control Systems To Improve energy performance…” R-5<br />
Anna Pellegrino<br />
LIGHTING CONTROL SYSTEMS TO IMPROVE ENERGY PERFORMANCE<br />
AND ENVIRONMENTAL QUALITY OF BUILDINGS: LIMITS AND<br />
POTENTIALS<br />
Summary<br />
Over the last few years, the use of electric lighting controls and, in<br />
particular, daylight responsive controls, has become widespread thanks to<br />
growing interest in strategies and technologies aimed at realising<br />
“sustainable” buildings, where the goal of reducing energy consumption is<br />
associated with achieving high environmental quality. Furthermore, new<br />
international standards underlining the need to reduce energy consumption<br />
as well as the importance of considering lighting control, have increased<br />
interest and attention to these systems - from designers, building owners and<br />
public authorities. Unfortunately, expected results in buildings are rarely<br />
obtained, partly due to technical limits or design, installation or<br />
commissioning mistakes and these systems often prove difficult for users to<br />
accept.<br />
A review of lighting control is covered in the paper.<br />
Povzetek<br />
Sistemi za regulacijo razsvetljave z namenom izboljšanja izkoristka in<br />
okoljske kakovosti stavb; V zadnjih letih se uporaba sistemov za regulacijo<br />
razsvetljave povečuje, še posebej sistemov za regulacijo razsvetljave v<br />
odvisnosti od dnevne svetlobe. Razlog za to je povečan interes za strategije<br />
in tehnologije, povezane z razvojem in izvedbo trajnostnih stavb, kjer je<br />
glavni cilj zmanjšanje porabe energije in doseganje visoke okoljske<br />
kakovosti. Poleg tega je povečan interes za tovrstne stavbe pri načrtovalcih,<br />
lastnikih in javni upravi tudi posledica novih mednarodnih standardov, kjer<br />
se poudarja potreba po varčevanju z energijo ter pomembnost uporabe<br />
regulacije razsvetljave. Na žalost pa je zelo težko doseči pričakovane<br />
rezultate, tudi zaradi tehničnih omejitev, slabega načrtovanja ter napak pri<br />
izvedbi. Tovrstne sisteme pa dostikrat zavračajo tudi uporabniki stavb. V<br />
članku je podan pregled sistemov za regulacijo razsvetljave.<br />
“Lighting engineering 2006” stran 37
R-5 “Sistemi za regulacijo razsvetljave z namenom izboljšanja izkoristka…”<br />
1 Introduction<br />
Use of automatic systems to control buildings, plants and services, in particular in non-residential<br />
buildings, has been proposed as a natural evolution of automation processes developed for industrial<br />
production, since the eighties. The introduction of automatic control systems seemed to offer real<br />
opportunities to raise the overall building quality, in particular concerning the improvement of<br />
building functionality and environmental conditions.<br />
Interior lighting came out as a possible application field for automation systems: lighting<br />
requirements of a space can change during the day or year in relation to its functions, activities<br />
carried out, daylight availability or actual space usage. In order to respond to different lighting<br />
requirements users can manually switch on, off or dim luminaires, but being able to automatically<br />
control lighting, independently from the occupant’s actions, seems to be a potentially interesting<br />
challenge.<br />
Introducing partially or completely automatic systems to control or integrate electric lighting and<br />
daylighting might help, from a theoretical point of view, in getting advantages such as the increase of<br />
visual and thermal comfort or decrease of energy costs. Energy savings can be achieved thanks to<br />
both a reduction of luminaires electrical energy consumption and, in air-conditioned buildings, a<br />
lowering of the thermal load produced by electric light sources.<br />
The problem of energy conservation has been a recurrent topic since the seventies. Over the last<br />
few decades the importance of reducing energy consumption has achieved new implications<br />
concerned with both the need of preserving natural resources and the link that exists between energy<br />
consumption and climatic changes.<br />
Over the last few years, there has been a growth of interest towards strategies and technologies<br />
aimed at realising “sustainable” buildings, where the goal of reducing energy consumption is<br />
associated to achieving high environmental quality. Furthermore, this trend is supported by new<br />
international standards that underline the need to reduce energy consumption as well as the<br />
importance of achieving high environmental quality levels.<br />
Lighting control products have been available on the market since the eighties, however their<br />
popularity has so far been limited and often restricted to industrial or large office buildings.<br />
Recently, interest towards new solutions for electric lighting and daylighting control has been<br />
increased by the diffusion of new architectural design trends and accessibility of new technologies<br />
and products. In building design trends, there has been a significant and growing interest in the use of<br />
highly glazed facades, implying more daylight availability inside buildings and, consequently, the<br />
need for more control of a resource that, beyond its many advantages, can lead, when not controlled,<br />
to considerable discomfort from both visual and thermal points of view (glare, overheating, etc).<br />
With control technologies, the steady diffusion of dimmable electronic ballasts for discharge lamps,<br />
evolution of communication protocols and growing diffusion of new lighting trends such as dynamic<br />
lighting and coloured lighting, have boosted the choice in new control lighting products. At present,<br />
most luminaires manufacturers have a line of products for lighting control in their catalogues.<br />
Depending on the size of the company it can range from very simple devices to complex building<br />
automation systems, and this demonstrates that there are further expectations of growth for the<br />
lighting control systems market.<br />
stran 38 Posvetovanje “Razsvetljava 2006”
“Lighting Control Systems To Improve energy performance…” R-5<br />
2 Lighting control and the quality of lighting design<br />
A new phase of the cultural debate on the significance of a lighting project began in the nineties:<br />
the definition of the concept of lighting quality took on a value that went beyond purely illuminating<br />
engineering aspects [1] [2] [3] [4].<br />
Agreement has traditionally been reached on recognising that light has an influence on:<br />
- vision;<br />
- visual performance in carrying out a task;<br />
- subjective behaviour;<br />
- determination of a state of mind;<br />
- health;<br />
- formulation of an aesthetical evaluation.<br />
An illuminated environment, characterised by a good quality, should therefore:<br />
- create optimal perception conditions;<br />
- create optimal conditions for carrying out an activity or precise visual task;<br />
- favour correct behaviour;<br />
- contribute to the determination of appropriate states of mind;<br />
- favour healthy conditions and avoid phenomena that are dangerous for one’s health;<br />
- contribute to the creation of an appreciable aesthetic environment, taking into<br />
consideration and valorising the architectonic characteristics.<br />
Considerations from the 1998 CIE Symposium on Lighting Quality [1] have made the concept of<br />
lighting quality a more holistic approach, apart from falling back on the sphere of visual comfort and<br />
related criteria (illuminance, light<br />
distribution, glare, etc.), greater<br />
importance has been given to the<br />
HUMAN NEEDS<br />
role of aspects, not directly dealing<br />
Visibility<br />
with lighting, underlying the<br />
Task performance<br />
multidimensional nature of the<br />
Visual comfort<br />
lighting design. In the proposed<br />
Social communication<br />
model (Fig. 1) the definition of<br />
Mood and atmosphere<br />
lighting quality encompasses the<br />
Helth, safety, well being<br />
spheres of human needs,<br />
Aesthetic judgment<br />
architectural integration, and<br />
environmental/ economic con-<br />
LIGHTING<br />
straints.<br />
ECONOMICS AND<br />
QUALITY<br />
ARCHITECTURE<br />
Form<br />
ENVIRONMENT<br />
Installation<br />
Maintenance<br />
Operation<br />
Energy<br />
Environment<br />
Composition<br />
Style<br />
Codes and<br />
standards<br />
Fig. 1 – Lighting Quality definition developed at First CIE<br />
Symposium on Lighting Quality [4]<br />
Within this framework it is<br />
clear that the use of lighting<br />
controls might have a positive<br />
influence on the global quality of<br />
lighting design. These systems are<br />
intended to increase the flexibility<br />
of lighting and optimise energy<br />
consumption, taking into account<br />
actual space occupancy and<br />
daylight availability during<br />
“Lighting engineering 2006” stran 39
R-5 “Sistemi za regulacijo razsvetljave z namenom izboljšanja izkoristka…”<br />
different hours of the day or different periods of the year. In modern buildings lighting needs and<br />
preferences may change from hour to hour and from day to day, different tasks may occur in the<br />
same space, a number of different people may use the same workplace and this requires a flexible<br />
lighting system able to provide variable lighting levels.<br />
An ideal lighting control system increases the quality of lighting design ensuring proper and<br />
constant lighting conditions for different requirements, and eliminating energy waste, with positive<br />
consequences on both the sphere of human needs and the sphere of environmental/economical<br />
implications.<br />
If we move from a theoretical to a practical analysis, we see that the use of control systems<br />
implies greater complexity: their operation depends on the presence of distributed and centralised<br />
“intelligences” (sensors, pc and software etc.) that regulate the behaviour of controlled components<br />
(luminaires, shading devices, etc.). Control device characteristics, installation and commissioning<br />
can heavily influence system performance and then later the actual quality of lighting design.<br />
When assessing the implication of control systems on lighting quality, we should consider users’<br />
response and their degree of acceptance. Lighting conditions automatically generated by control<br />
systems may not correspond to occupants’ requirements; it could lead to physiological or<br />
psychological discomfort and, consequently and in many cases, to deactivating automatisms.<br />
If we take possible design, installation and commissioning errors to the extreme we could easily<br />
imagine cases for which control systems do not ensure comfort conditions and energy costs are<br />
increased, rather then reduced.<br />
3 Lighting control and European energy codes requirements<br />
The issuing of European directives and technical standards underlying the need to reduce energy<br />
consumption in buildings is one of the main factors that contributed, over the last few years, to<br />
increasing the development and application of lighting control systems.<br />
Directive 2002/91/EC of the European Parliament and Council on the energy performance of<br />
buildings, came into force at the beginning of 2003 [5]. The directive was inspired by considerations<br />
on the importance of energy consumption in Europe and aims to contribute to reducing consequent<br />
polluting emissions in order to meet the Kyoto agreed targets. Buildings in Europe use over 40% of<br />
the global amount of energy and, according to the European energy commissioner, a cost-effective<br />
savings potential of around 22% of present consumption can be realised by 2010 [6].<br />
The Directive objective is to improve energy performance of buildings, by requiring:<br />
- a methodology to calculate integrated energy performance of buildings<br />
- minimum energy requirements for new buildings<br />
- minimum energy requirements for large existing buildings being renovated<br />
- energy certification of buildings<br />
- regular inspections of building’s plants (heating and air-conditioning) [7]<br />
As far as a methodology to calculate energy performance of buildings is concerned, every<br />
government shall establish a calculation method based on a general framework incorporating several<br />
aspects: thermal characteristics of the building, heating installation, air-conditioning installation,<br />
ventilation, built-in lighting installation, etc. Where relevant in the calculation, the positive influence<br />
stran 40 Posvetovanje “Razsvetljava 2006”
“Lighting Control Systems To Improve energy performance…” R-5<br />
of free contributions shall be taken into account and daylight availability in buildings can<br />
significantly contribute to improving energy performance of electric lighting installations.<br />
The European Committees for Standardisations (CEN, CENELEC and ETSI) are currently<br />
working on implementing methodologies to calculate the integrated energy performance of buildings.<br />
As far as energy consumption related to electric lighting is concerned, the CEN TC169 is preparing a<br />
standard (prEN 15193: Energy performance of buildings – Energy requirements for lighting) [8]<br />
devised to establish conventions and procedures for the estimation of annual energy requirements of<br />
lighting in buildings. The standard can be used for existing buildings, newly designed or renovated<br />
buildings and it takes a “dynamic” use of electric light into account, considering both daylight<br />
availability and space occupancy. According to European Directive guidelines, the TC 169 is<br />
implementing a method that - despite maintaining the simplification necessary to guarantee design<br />
applicability - sharpens the calculation of energy consumption concerning use of artificial light<br />
management systems based on the integration of natural light or user presence. Once obtained, the<br />
estimate of energy consumption of the lighting plant contributes to defining world energy<br />
performance regarding certifying the building.<br />
Still within the overall framework of tools to implement the indications in the European<br />
Directive, a technical procedure is included that establishes the provisions and methods for<br />
estimating the impact of “building automation” systems on energy performance and energy use in<br />
buildings (prEN 15232: Calculation methods for energy efficiency improvements by the application<br />
of integrated building automation systems) [9]. The standard underlines the role of building<br />
automation systems in increasing functionality and energy efficiency systems, including obviously<br />
artificial lighting plants and screening systems of direct sun radiation.<br />
In addition to indications emerging on energy certification of buildings, greater awareness about<br />
adopting lighting control systems is also due to indications published in a recent technical set of rules<br />
disseminated in lighting-technique circles. The standard CEN 12464 “Light and lighting – Lighting<br />
of work places – Part 1: Indoor work places” [10], in the section Criteria for lighting technique<br />
design at point 4.9 – energy saving – cites that a lighting plant must correspond to lighting<br />
requirements of a particular area without wasting energy. While in the section Lighting requirements<br />
for indoor, visual tasks and activity, use of equipment with adjustable light flow is recommended for<br />
school buildings facilities (school classrooms, evening classrooms and reading rooms).<br />
4 Limits to the popularity of lighting control systems<br />
Despite the potential benefits of using lighting control systems to reduce lighting energy and<br />
enhance lighting quality, their application on a large scale has not yet been achieved, and this lack of<br />
diffusion is particularly true in Italian buildings. Furthermore, it is quite common to come across<br />
buildings where the controls have been disabled because of occupants’ complaints against their use.<br />
Going further into the analysis, it is possible to outline the most relevant aspects that may have<br />
had a negative influence on the use of lighting controls [11]. Often architects or lighting designers are<br />
not well informed about existing control technologies (features and potentials of different solutions,<br />
operating characteristics of each component, etc.). Lighting controls must be compatible with<br />
existing lighting equipment (luminaires, lamps, ballasts and wiring) and since lighting and control<br />
components can be obtained from multiple vendors, the designer must be knowledgeable about their<br />
interactions. Lack of awareness implies a difficulty in choosing and designing appropriate solutions<br />
“Lighting engineering 2006” stran 41
R-5 “Sistemi za regulacijo razsvetljave z namenom izboljšanja izkoristka…”<br />
for each specific application (offices, schools, hospitals, etc.) and, as a consequence, the necessity to<br />
rely completely on systems manufactures’ technical staff.<br />
Other influencing factors can be related to the complexity of the commissioning phase and<br />
occupants’ response. Controls must be reliable and work correctly virtually all the time and most of<br />
them require careful commissioning to ensure that they operate according to design intents. Simple<br />
sensors such as occupancy sensors or daylight sensors should be calibrated in their sensitivity or<br />
delay time; building automation systems, controlling for instance both electric lighting and shading<br />
devices should be carefully programmed, taking into account all influencing factors (building<br />
orientation, obstruction, shading characteristics, space functions, space occupancy, user needs and<br />
preferences, etc.). Initial commissioning is usually done by the system supplier’s technical staff but,<br />
considering the complexity of the application field, it is quite hard to believe that a single<br />
intervention could optimise the system operation. The need for continuous intervention from external<br />
professionals could sometimes induce facility management staff to disable control systems, in<br />
particular if their efficacy in reducing lighting energy costs is not demonstrated or their use causes<br />
occupant complaints.<br />
Occupant complaint is the other relevant issue for successful use of lighting control systems. As<br />
far as environmental conditions are concerned, user needs and preferences are always different, but<br />
this is particularly true for lighting. An automatic lighting control, based on preliminary or standard<br />
calibration, may not take into account the complexity of space articulation, tasks and activities, or<br />
user needs, and may easily fail in achieving the expected results. Over the last few years the issue of<br />
matching users preferences, as far as environmental conditions are concerned, and control behaviour,<br />
has been faced by several research centres with the idea of developing autoadaptive systems, able to<br />
“learn” from occupants behaviour how to control environmental parameters (thermal and lighting<br />
conditions, glare protection, etc.) [12] [13] [14].<br />
Although lighting controls are increasingly considered not just for saving energy, but also for<br />
improving visual comfort, occupant mood and generally as a real amenity for people living and<br />
working in buildings, their efficacy is still mainly assessed on economic benefits related to building<br />
operation costs. Designers, however, can’t easily evaluate actual savings achievable by adopting a<br />
lighting control system, and this may further discourage from introducing them in new projects or<br />
existing buildings.<br />
5 Assessment of lighting control systems performance<br />
Generally speaking, information available to designers to assess a control system’s performance<br />
in saving energy is strictly based on advertising material from manufacturers. Catalogues and<br />
technical product literature frequently publish the percentage of reduction in consumption compared<br />
to the installation of a completely manually controlled plant. This information is very general<br />
concerning the chance of saving energy through using control systems, but it is obvious that it is not<br />
enough to estimate real performance resulting from applying the system to one specific case.<br />
An accurate estimate of energy performance, and therefore the efficiency of a lighting<br />
management system, depends on several factors, linked to the specific characteristics of the building<br />
it is being designed for, as well as the characteristics of the system itself (control strategies, type of<br />
control devices, etc.).<br />
When the system includes interaction by natural and artificial light, the following come into play:<br />
stran 42 Posvetovanje “Razsvetljava 2006”
“Lighting Control Systems To Improve energy performance…” R-5<br />
• exterior daylight availability, that depends on:<br />
- the space’s latitude and longitude,<br />
- day of the month and hour of the day,<br />
- sky conditions (overcast, clear, intermediate, etc.)<br />
• amount of natural light present, that depends on:<br />
- exterior daylight availability,<br />
- presence of exterior obstructions,<br />
- orientation of the environment (if necessary, the presence of direct solar radiation should be<br />
considered)<br />
- presence of shading devices,<br />
- configuration of the environment and layout of work places,<br />
• usage characteristics, eg:<br />
- occupation profile,<br />
- interaction between users and screening components,<br />
- interaction between users and lighting plant,<br />
• characteristics and performance of lighting plant (typologies of luminaires, distribution of light<br />
in the environment, etc.)<br />
• typology and architecture of the control system (control based on occupation, presence of<br />
natural light, user interest, pre-defined settings, etc., typologies of adopted sensors, groupings<br />
of terminals, etc.).<br />
Every estimation method is based on the assumption that energy use depends on power, which is<br />
the rate of electricity consumption, and time, which is the period of consumption.<br />
When the control system includes integration of natural and artificial light, the estimate of its<br />
performance is based on calculating the amount of natural light in the environment and,<br />
consequently, on the estimate of the amount of artificial light necessary for correct integration (ie to<br />
guarantee constant luminance corresponding to conditions of visible comfort).<br />
A simplified calculation can be done starting from the average daylight factor, and availability of<br />
diffused external light, gathered from data concerning the locality in consideration or through<br />
specific calculation algorithms. Comparing the availability of natural light with occupancy times, it is<br />
possible to determine the amount of light that should be emitted from the lighting plant on a time<br />
basis and consequently the electrical power absorbed (having previously defined the artificial<br />
lighting plant’s characteristics). Summing up hour consumption concerning each environment under<br />
control, it is possible to determine the building’s overall annual consumption.<br />
A simplified approach of this type depends on many influencing factors, previously listed like:<br />
- contribution due to direct solar radiation,<br />
- influence of movable shading devices,<br />
- variations linked to different orientation of the space,<br />
- different obtainable performance with different typologies of control systems (eg. combined<br />
presence of day light sensors and occupation sensors)<br />
- user interaction with the space and system.<br />
On the other hand, it makes a simple and relatively quick, general confrontation between design<br />
solutions with and without natural and artificial light integration systems.<br />
A more complete approach is that proposed by the draft European standard (prEN 15193: Energy<br />
performance of buildings – Energy requirements for lighting). This also deals with a relatively<br />
“Lighting engineering 2006” stran 43
R-5 “Sistemi za regulacijo razsvetljave z namenom izboljšanja izkoristka…”<br />
simplified, manual calculation method for the estimate of an indicator of annual energy performance<br />
of a building’s artificial lighting plant.<br />
The draft standard proposes two assessment methods that include the occupation profile of the<br />
environments and potentialities of control systems in exploiting free contributions from natural<br />
sunlight:<br />
- a quick method which allows the estimation of annual lighting energy consumption of a<br />
building. The luminaires power is “weighted” on the basis of dependency factors related to<br />
occupancy, daylight availability and type of control system, and default values for each factor are<br />
provided for different types of buildings.<br />
- a comprehensive method which allows for a more accurate determination of the lighting energy<br />
estimation for each building room or zone and for different periods (monthly or annual). Here too,<br />
the luminaires power is “weighted” on the basis of dependency factors related to:<br />
- natural light coming into the environment (diffused component); determined on the basis of<br />
the real calculation of numbers of hours of daylight autonomy and referring to geographic<br />
position, taking into consideration the building’s geometry, obstructions, transparent<br />
component characteristics, and identifying the spaces that most benefit effectively from<br />
natural light;<br />
- occupation profile; assessed considering environment purpose, possible user behaviour, plant<br />
characteristics, etc.;<br />
- criteria covering light control (manual, automatic, automatic shading, with sub-division of<br />
equipment groups, etc.)<br />
Even though there is greater detail in analysing the building characteristics and designed control<br />
system, the influence of the factors cited is considered in the calculations through use of table values,<br />
referring to certain building typologies, location and control criteria.<br />
Both methods consider the luminaires power, which provide power for functional illumination,<br />
and the parasitic power, which provides power for lighting control systems and charging batteries for<br />
emergency lighting.<br />
Both the methods proposed by the standard depend on some of the aspects that contribute to<br />
determining the system’s performance, ie:<br />
- the influence of components for controlling natural light, (eg. movable shading devices);<br />
- the influence connected to the ways a user interacts with the artificial lighting plant and<br />
shading devices.<br />
Also the availability of natural light and control system characteristics are estimated according to<br />
a tabular approach and therefore a high level of approximation.<br />
On the other hand, the methods proposed by the draft standard provide a standardised approach,<br />
useful for a general estimate of the performances of a lighting plant in the presence of a control<br />
system (quick method), or for a more detailed calculation and a comparison with different design<br />
solutions (comprehensive method).<br />
As well as manual calculation methods, designers can turn to calculation software, developed at<br />
international research centres. These include, by the way, Lightiswitch [15] [16] and Energy Plus<br />
[17]. Despite the fact that this software considers aspects of the problem that are generally neglected<br />
in manual calculation methods, like user control of the systems or the presence of solar screening,<br />
none allows the user to thoroughly assess all possible variables that, in real buildings, compete to<br />
determine lighting plant consumption in the presence of control systems.<br />
stran 44 Posvetovanje “Razsvetljava 2006”
“Lighting Control Systems To Improve energy performance…” R-5<br />
Determining real energy saving potentials of any lighting control device or system is not an exact<br />
science, since their performance depends on how they are applied and used. However more accurate<br />
information on actual potential energy savings and availability of easy and reliable evaluation<br />
methods could increase designers’ awareness and confidence in choosing lighting control systems for<br />
both new or renovated buildings.<br />
6 Conclusions<br />
Interest in control systems and natural and artificial light integration has recently increased, as<br />
has choice in products and solutions by lighting system manufacturers and companies from the<br />
automation sector.<br />
Nevertheless, frequently systems installed in tertiary buildings (office blocks, schools, etc.) have<br />
been deactivated or tampered with following users’ non acceptance and dissatisfaction with<br />
performance, but also by the impossibility or difficulty to interact with the system. This lack of<br />
success is due to an uninformed choice of system or to it being unsuitable for tasks carried out in the<br />
environment or user characteristics, incorrect design of system architecture, choice of components<br />
that don’t always communicate, or not last, the difficulty to programme each component or entire<br />
system. Customers and designers are often doubtful about these systems’ real efficiency when<br />
considering the frequently high installation costs.<br />
The Politecnico di Torino’s Department of Energy research in this sector is in fact inspired by<br />
these considerations. The last objective in this activity is to draw up guidelines for the light control<br />
systems project mostly for use by architects and lighting designers. The guide will cite results of both<br />
specific theoretic and trial studies currently underway as well as aiming at providing support for<br />
designers on:<br />
- state of the art of currently available control systems;<br />
- calculation methods for energy performance;<br />
- information on environmental and energy performance, degree of acceptance and ways of<br />
interaction between systems and user, in real situations.<br />
7 References<br />
1. CIE x015-1998, Proceedings of the First CIE Symposium on Lighting Quality, 9-10 May 1998,<br />
National Research Council Canada, Ottawa/Ontario, Canada<br />
2. Veitch J.A., 2001, Psychological processes influencing Lighting Quality, Journal of the<br />
Illuminating Engineering Society, Vol 30, n.1, pp124-140<br />
3. Boyce P.R., Human factors in lighting, 2nd Edition, Taylor & Francis, London, 2003<br />
4. REA, M. S., The IESNA Lighting Handbook. Reference & application, Ninth Edition, FIES<br />
editor in Chief , New York, 2000<br />
5. http://ec.europa.eu/energy/demand/legislation/buildings_en.html,<br />
6. CIBSE Briefing 6, The Energy Performance of Building Directive, Chartered Institution of<br />
Building Services Engineers, 2003, London (www.diag.org.uk/pdf/CIBSE_Briefing.pdf)<br />
“Lighting engineering 2006” stran 45
R-5 “Sistemi za regulacijo razsvetljave z namenom izboljšanja izkoristka…”<br />
7. Corrado V., Serraino M., Applicazione della nuova normative sull’efficienza energetica degli<br />
edifici. Commenti al nuovo quadro legislativo e alla normativa, Rockwool Italia S.p.A., Milano,<br />
giugno 2006, (www.rockwool.it)<br />
8. CEN-TC 169, prEN 15193 – Energy performance of buildings – Energy requirements for<br />
lighting, Bruxelles, 2006<br />
9. CEN-TC 247, prEN 15232 – Calculation method for energy efficiency improvements by the<br />
application of integrated building automation systems, Bruxelles, 2005<br />
10. CEN 12464, Light and lighting – Lighting of work places – Part 1: Indoor work places<br />
11. AAVV, Advanced lighting guidelines, New Building Institute, California, 2003,<br />
http://www.newbuildings.org/lighting.htm<br />
12. Guillemin A., Morel N., An Energy-Efficient Controller for Shading Devices Self-Adapting to the<br />
User Wishes, Building & Environment 37(11), pp 1091-1097 (2002)<br />
13. Guillemin A., Using genetic algorithms to take into account user whishes in an advanced building<br />
control system, These n° 2778, Ecole Polytechnique Fédérale de Lausanne, (2003)<br />
14. http://www2.polito.it/ricerca/ftarch/symp_IEA/3%b0%20sessione/pdf/Rosemann.pdf<br />
15. Reinhart C., Lightswitch-2002: a model for manual and automated control of electric lighting and<br />
blinds, Solar Energy, 77 (2004)<br />
16. http://www.buildwiz.com/lightswitch/<br />
17. www.eere.energy.gov/buildings/energyplus<br />
Avtorjev naslov / Author's address:<br />
dr. Anna Pellegrino,<br />
Professor at politechnica di Torino,<br />
Italy<br />
stran 46 Posvetovanje “Razsvetljava 2006”
“Lighting of spaces with VDT´s considering requirements and processes of visual perception” R-6<br />
Christian Bartenbach<br />
LIGHTING OF SPACES WITH VDT´S CONSIDERING THE REQUIREMENTS<br />
AND PROCESSES OF VISUAL PERCEPTION<br />
RAZSVETLJAVA PROSTOROV Z VDT UPOŠTEVAJE ZAHTEVE IN PROCESE<br />
VIDNEGA ZAZNAVANJA<br />
Le Corbusier once said: „The right light at the right place at the right time.“<br />
It is not certain if he intended to differentiate between day-lighting and artificial lighting. But one<br />
thing is certain: the appearance of any interior depends largely on the lighting – and most of the time<br />
it is daylight.<br />
Why do we spend so much effort in designing functional and aesthetically pleasing electrical<br />
lighting? Nevertheless, most spaces appear to be quite different at night – when there is no daylight.<br />
Day-lighting is without doubt the preferred option. At least subconsciously we move closer to the<br />
windows whenever we can. Transparent openings should, however, comply with a wide range of<br />
very particular requirements. They should contribute to optimal visual conditions at the work place,<br />
e. g. they have to assure the appropriate amount and distribution of daylight, provide protection<br />
against direct sun, provide optimal conditions regarding glare and visual connection to the outside,<br />
and finally they have to perform the conflicting task of permitting sufficient visible transmission<br />
while blocking out heat.<br />
A number of project examples highlight the different options of how to control daylight by means<br />
of reflectors, louvers and various types of prismatic panels. These examples range from air terminals,<br />
to subway stations, from museums to exhibition halls, from a plenary hall to office buildings, and<br />
even underground parking lots.<br />
A study with the aim to utilise direct sun light in underground spaces shows how to use heliostats<br />
tracing the sun to redirect sunlight via mirrors and lenses for the benefit of people working in<br />
windowless spaces. It is possible to illuminate a room of about 60 – 80 m2 with about 600 – 800 lx<br />
with one heliostat of 1m2 surface area.<br />
Another potential use of sunlight has been realised in narrow courtyards. By using reflectors at<br />
the bottom as well as on the window cladding a virtual image of the sky can be reflected into the<br />
lower floors of a building contributing greatly to the natural illumination of the interior.<br />
One of the difficulties when using computer screens near windows is to find a balance between<br />
the low intrinsic brightness of the screen compared to the high luminance values of the unprotected<br />
window. Besides fixed or adjustable shields installed outside, there is a range of options utilising redirecting<br />
blinds or prismatic panels installed in the windows which provide glare control, sun<br />
protection and plenty of daylight where it is needed – across the entire room.<br />
“Lighting engineering 2006” stran 47
R-6 “Razsvetljava prostorov z VDT upoštevaje zahteve in procese vidnega zaznavanja”<br />
In some cases it is possible to do away with the cooling system altogether. This requires an<br />
intelligent system and excellent collaboration between the architects, lighting designers and the<br />
engineers responsible for the air conditioning system.<br />
During a period of four years Bartenbach LichtLabor has carried out a series of tests with about<br />
1600 persons to establish a correlation between different types of windows respectively systems<br />
controlling daylight and their effect on people. The results show a considerable increase in efficiency<br />
when intelligent day-lighting systems are employed compared to unprotected windows. Visual<br />
perception is a mental process and the less mental effort we have to make to correct the negative<br />
effects of unsuitable blinds the more mental energy is available to carry out the task at hand.<br />
Currently we are working on a number of research projects with the aim to improve the<br />
utilisation of daylight. We expect that such systems will become the norm in the not too distant<br />
future. The combined benefits of the effects of daylight on humans and the considerable savings on<br />
the refrigeration load of the AC system will be the drivers for this development.<br />
Needless to say, such intelligent systems can best be utilised in conjunction with a state-of-the-art<br />
lighting control system. But that appears to be part of the standard design brief already.<br />
Fig. 1<br />
(Ray tracing of natural light controlled by<br />
skylight with parabolic reflectors assuring<br />
high efficiency, perfect shielding and glare<br />
prevention and controlled light distribution.<br />
Fig. 2<br />
Integral daylighting and artificial lighting<br />
at Zurich Airport (Arch. Keller, Bachmann<br />
+ Partners, CH).<br />
The suspended annular ring serves to<br />
redistribute some light to the ceiling. At<br />
night a warmtone light source is used to<br />
generate a higher comfort level.<br />
stran 48 Posvetovanje “Razsvetljava 2006”
“Lighting of spaces with VDT´s considering requirements and processes of visual perception” R-6<br />
Fig. 3<br />
The stations of the Metro in Copenhagen (Arch.<br />
KHRAS Architects, DK), are located<br />
underground and are illuminated – at least<br />
partially – with natural light.<br />
Fig. 4<br />
For the Design Center in Linz a special sun<br />
protection system was developed together with<br />
Prof. Herzog. With a g-value (energy<br />
transmission) of 0.15 and a light transmission of<br />
45% it meets all requirements. It consists of a<br />
specular louver that is located between the<br />
glazing of the insulating glass of the roof<br />
structure.<br />
Fig. 5<br />
In the “House of German History” in Bonn –<br />
an exhibition hall with a glazed roof -<br />
designed by the architects Rüdiger +<br />
Rüdiger, prismatic panels were integrated<br />
into the glass roof. Thus daylight is allowed<br />
to enter the building without causing glare or<br />
permitting direct sunlight to enter. Also, UV<br />
rays had to be blocked to meet the stringent<br />
requirements regarding conservation.<br />
“Lighting engineering 2006” stran 49
R-6 “Razsvetljava prostorov z VDT upoštevaje zahteve in procese vidnega zaznavanja”<br />
Fig. 6<br />
The plenary hall of the German Federal<br />
Government in Bonn by architects Behnisch<br />
& Partners, was realised with exterior sunshading<br />
lamellas. These prismatic panels<br />
trace the movement of the sun and thus allow<br />
skylight to enter the building without any<br />
glare while blocking direct sunlight.<br />
Roof support structure<br />
Re-direction of skylight<br />
Skylights with clear glass<br />
Fig. 7<br />
A principal study of a building providing a<br />
suitable geometry for daylighting requiring<br />
only one reflector.<br />
Acrylic cover<br />
Integral artificial<br />
lighting system<br />
Stepped louver<br />
Light pipe with highly<br />
reflective coating<br />
Light rays<br />
Fig. 8<br />
A system developed by BLL incorporating mirrors and prismatic panels allows the utilisation of sunlight<br />
and skylight. This so called solar utilisation results in a higher light transmission while keeping the total<br />
energy transmission low. Excellent light distribution and glare-free lighting are assured with the dynamics<br />
of natural light in the interior.<br />
stran 50 Posvetovanje “Razsvetljava 2006”
“Lighting of spaces with VDT´s considering requirements and processes of visual perception” R-6<br />
heliostat<br />
14,00 m<br />
redirection mirror<br />
Fig. 9<br />
sun luminaire<br />
light pipe<br />
cellar illuminated<br />
with sunlight<br />
~ 4,00 m<br />
concentrator<br />
glass mirror<br />
It is possible to illuminate about 60 to 80 m²<br />
to about 600 – 800 lx with 1m² surface area<br />
of a Heliostat. Sunlight can be transported up<br />
to 60 m into a building. One possible solution<br />
is an “artificial window” as shown in the<br />
sketch.<br />
7,00 m<br />
Fig. 10 + 11<br />
The left picture shows the problems related<br />
to screen based tasks next to a window. One<br />
possible solution is to divide the window in<br />
an upper and lower part with different<br />
functions. The top is used for re-directing<br />
natural light while the lower part provides a<br />
visual connection to the outside.<br />
Fig. 12<br />
A similar technique is used at the office<br />
building of the UBS in Biel (Arch. Mark + Yvonne<br />
Hausamann, CH). Prismatic panels for sunshading<br />
and light-guiding prismatic panels in the<br />
upper part of the windows result in low energy<br />
transmission (0.08). No additional cooling is<br />
required in this building. Natural light entering the<br />
building is reflected onto metal ceiling panels<br />
(perforated for acoustic purposes) that in turn<br />
reflect light into the room without glare. Artificial<br />
lighting is an integral part of the day-lighting<br />
system.<br />
“Lighting engineering 2006” stran 51
R-6 “Razsvetljava prostorov z VDT upoštevaje zahteve in procese vidnega zaznavanja”<br />
Fig. 13<br />
Specular light guiding blinds provide optimal<br />
sun-shading (g = 0.1 to 0.15), re-direction of<br />
light and glare control and the visual link to<br />
the outside due to perforations in the blinds.<br />
250<br />
Monatliche<br />
KL-Betriebskosten<br />
200<br />
150<br />
100<br />
50<br />
0<br />
J F M A M J J A S O N D Mittel<br />
Lösung mit Sonnenschutzprismen und Umlenkblendschutzsystem<br />
Lösung mit konventioneller Sonnenschutzverglasung ohne Blendschutz<br />
Lösung mit konventioneller Sonnenschutzverglasung mit Blendschutz<br />
Fig. 14<br />
With suitable systems such as blinds it is<br />
possible to reduce the requirement of<br />
artificial lighting during normal working<br />
hours to 20% - 30% over the year. This<br />
represents a reduction of up to 60% compare<br />
to conventional window systems.<br />
Ermüdung<br />
1.6<br />
1.2<br />
0.8<br />
0.4<br />
0.0<br />
-0.4<br />
-0.8<br />
Klares Fenster<br />
ohne System<br />
Blendschutz<br />
Ermüdungswerte<br />
Vergleich der Tageslichtsysteme<br />
Messung 1 (5)<br />
Messung 2 (15)<br />
Messung 3 (30)<br />
Lamelle<br />
ungelocht<br />
Lamelle<br />
gelocht<br />
Lamelle gelocht<br />
(obere Hälfte)<br />
Fig. 15<br />
Over four years Bartenbach<br />
LichtLabor has carried out research<br />
in terms of perception psychological<br />
issues related to screen-based tasks in<br />
offices with about 1,600 test persons.<br />
It has been shown that suitable<br />
systems result in improved visual<br />
performance and thus increased<br />
productivity. Accordingly fatigue is<br />
lowest whenever there is a<br />
harmonious brightness distribution.<br />
Avtorjev naslov / Author’s address:<br />
Christian Bartenbach<br />
Bartenbach LichtLabor<br />
stran 52 Posvetovanje “Razsvetljava 2006”
“Lighting and productivity in the industrial working place ” R-7<br />
Henri Juslén,<br />
LIGHTING AND PRODUCTIVITY IN THE INDUSTRIAL WORKING PLACE<br />
Abstract<br />
Lighting-related parameters like visual performance and alertness,<br />
together with motivation, are assumed to influence productivity, wherever<br />
productivity is related to human performance. To test the impact of lighting<br />
level on productivity five case studies were started in 2003 and 2004. Studies<br />
have been finalized and a number of conclusions can be drawn. Lighting<br />
influences productivity if productivity is related to human performance.<br />
Productivity increases as illuminance levels rise. This paper considers also<br />
the question: “What happens if we change and improve the lighting in an<br />
industrial workplace?” Installing a new system of illumination in the<br />
workplace can affect the individual’s performance level in a variety of ways.<br />
The following mechanisms are described and discussed: visual performance,<br />
visual comfort, visual ambience, interpersonal relationships, biological<br />
clock, stimulation, job satisfaction, problem solving, the halo effect and<br />
change process.<br />
Povzetek<br />
Razsvetljava in produktivnost na industrijskih delovnih mestih; Za<br />
parametre, povezane z razsvetljavo, kot sta na primer vidna sposobnost in<br />
budnost oziroma motivacija, velja da vplivajo na produktivnost v kolikor je<br />
le-ta povezana z človeškim delom. Da bi preverili povezavo med nivojem<br />
osvetljenosti in produktivnostjo, smo v letih 2003 in 2004 izvedli pet študij.<br />
Iz rezultatov študij lahko zaključimo: razsvetljava vpliva produktivnost, če je<br />
le-ta povezana s človeškim delom ter produktivnost se poveča s povečano<br />
osvetljenostjo. Članek pa obravnava tudi vprašanje: »Kaj se zgodi če<br />
spremenimo oziroma izboljšamo razsvetljavo industrijskega delovnega<br />
mesta?« namestitev nove razsvetljavne naprave na delovnem mestu lahko<br />
vpliva na delavčevo delovno sposobnost na različne načine. V članku so<br />
opisani sledeči mehanizmi: vidna sposobnost, vidno udobje, vidno okolje,<br />
medčloveški odnosi, biološka ura, stimulacija, zadovoljstvo ob delu,<br />
reševanje problemov, odmevni učinek in proces sprememb.<br />
“Lighting engineering 2006” stran 53
R-7 “Razsvetljava in produktivnost na industrijskih delovnih mestih …”<br />
1 Mechanisms in the description of the effect of changing the lighting<br />
In order to determine the size of the effect that a lighting change might have on productivity and<br />
viability, particular attention can be drawn to the possible reasons for an increase in productivity.<br />
Previous field studies (Ruffer, 1925 and 1927; Schneider, 1938; Goldstern and Pudnoky, 1931;<br />
Bitterli, 1955; Stenzel, 1962a and 1962b; Crouch, 1967; Lindner, 1975; Carlton, 1980; Buchanan et<br />
al, 1991; Völker, 1999) have indicated an increase in productivity levels following an improvement<br />
in the system of illumination. Of course the reason for this increase is not necessarily only to be<br />
found in the improvement in visual performance levels.<br />
On the basis of a literature search with the focus on light, biology and psychology, it has been<br />
possible to develop a model to describe the effect of a lighting change on profitability (Juslén and<br />
Tenner, 2005).<br />
The model is illustrated in Figure 1. Light can affect human performance levels through visual<br />
and psycho-biological channels. In addition, changing the lighting affects the performance level<br />
when emotional and psychological reaction is taken into account. Just how much effect the<br />
mechanisms have on performance levels may be different for different people. In industrial work<br />
environments human performance level is linked directly to profitability. The costs for the<br />
installation and the effect on visiting customers will also influence the profitability of the<br />
lighting change.<br />
Light and lighting change<br />
Visual<br />
Change process<br />
Photo-<br />
Mechanisms<br />
Individual<br />
Performanc<br />
Customers<br />
Costs<br />
Profitability<br />
Figure 1. Model showing the effect of a change of the lighting on the profitability in a work environment.<br />
(Juslén and Tenner 2005)<br />
stran 54 Posvetovanje “Razsvetljava 2006”
“Lighting and productivity in the industrial working place ” R-7<br />
A change in the lighting can be effected by modifying the artificial light as well as the quality of<br />
natural daylight. Many previous studies show the effect on worker performance level of a change of<br />
illumination. This effect is the combination of a variety of mechanisms. When lighting is changed<br />
(improved), increased performance level can be achieved using the mechanisms described below.<br />
Using the above-illustrated model these can be categorised as visual and photo-biological<br />
mechanisms and mechanisms related to the process of change. However, this categorization is<br />
conceptual and the origin of mechanisms might vary. For example, stimulation might be sometimes<br />
resulted via the visual channel, not biological.<br />
Visual<br />
1. Visual performance<br />
People are more productive when they can better see what they are doing<br />
2. Visual comfort<br />
Reduced glare improves performance level through higher levels of concentration<br />
3. Visual ambience<br />
Illumination has an effect on visual surroundings which are part of the work environment. In<br />
turn this affects performance level.<br />
4. Interpersonal relationships<br />
The way people physically see each other will influence their opinions of each other and this can<br />
impact teamwork and therefore productivity.<br />
Photo-biological<br />
5. Biological clock<br />
Light has an effect on the biological clock, which controls the circadian rhythm and thus at<br />
particular periods of time performance levels.<br />
6. Stimulation<br />
Light stimulates psychological and physiological processes which will affect performance<br />
levels.<br />
Process of change<br />
7. Job satisfaction<br />
Improving the illumination as a means of recognising someone’s work can in some<br />
circumstances improve work satisfaction. Further more, improvement can result by providing<br />
individual control of the system of illumination (“autonomy”). Job satisfaction affects<br />
productivity.<br />
8. Problem solving<br />
By solving problems which have led to complaints improves the feeling of wellbeing and helps<br />
motivation. These feelings are directly linked to performance levels.<br />
“Lighting engineering 2006” stran 55
R-7 “Razsvetljava in produktivnost na industrijskih delovnih mestih …”<br />
9. The halo effect<br />
The halo effect derives from a belief in the superiority of new technologies or products resulting<br />
in improved productivity.<br />
10. The change process<br />
Good change management supports the positive effects of a lighting change.<br />
If improving the lighting situation has an effect on productivity, as demonstrated by most studies,<br />
how long does this effect last? The mechanism model can provide a first approximation. If the reason<br />
for an increase in performance levels is the visual or photo-biological aspect or a combination of<br />
these mechanisms, it can be concluded that the effect will be long-term, assuming that no other<br />
variables reduce the performance levels in this time period.<br />
It is more likely that psychological effects resulting from the process of change will decrease with<br />
time, depending also of course on other influences on the person. The “autonomy” aspect (see point 7<br />
– job satisfaction), i.e. the individual’s ability to control the lighting in the workplace, is more likely<br />
to have a lasting effect. If more positive steps are to be taken by an industrial business, these changes<br />
can be a link in the extended chain.<br />
2 Case studies in an industrial environment<br />
Five field studies were carried out in various European countries in order to determine the effect<br />
of the lighting change on productivity. Table 1 gives an overview of the study methodology and the<br />
results.<br />
The studies are based on the mechanism model (Juslén and Tenner 2005). By selecting a variety<br />
of field studies, the mechanism to describe the effects of a change in illumination on productivity<br />
could be investigated in real industrial environments.<br />
As already stated, the visual and photo-biological mechanisms which lead to an improvement in<br />
performance levels have a long-term effect. The effects from mechanisms associated with the process<br />
of change can decrease over time. For this reason long-term studys were carried out such that the<br />
effect of the “change process” (mechanisms 7 to 10) would be minimised. As a result the studys are<br />
focussed on the visual and photo-biological mechanisms.<br />
The case studies treated communication with other people as a subordinate task, so that the point<br />
“interpersonal relationships” (4) was not investigated and is not included in the evaluation.<br />
In each of the working environments investigated, normal industrial activities were carried out<br />
and no special arrangements were made. The methods of study and techniques for measurement of<br />
productivity were adapted to meet local conditions. For example productivity was measured by<br />
assembly time or number of errors. Fundamentally the results show an improvement in productivity<br />
with increased levels of illumination.<br />
It is necessary to conduct long-term studys in order to obtain reliable practical data. In each study<br />
the productivity measurements were made under varying conditions of illumination and over a long<br />
period of time using a fixed group of employees. In 4 of the 5 studies ANOVA (Analysis of variance<br />
r
“Lighting and productivity in the industrial working place ” R-7<br />
A. In study A the workstation of the employees in a Finnish luminaire factory were fitted with a<br />
new overhead controllable lighting system (task lighting). The old task lighting was not<br />
controllable. Each user could freely choose the level of illumination within the range 100 lx to<br />
3000 lx. The productivity (in this case assembly time) of the test group was compared with the<br />
productivity of a reference group provided with a workplace illumination level of 700 lx (Juslén<br />
et al, 2006). The productivity of the test group was significantly increased (4.6%) when<br />
measured against the reference group. There was a weak statistically significant correlation<br />
between the level of illumination and the productivity of the test group.<br />
B. Study B was carried out in a German luminaire manufacturing company. A section of the<br />
employees was provided with a new, controllable lighting system for their workplaces (task<br />
lighting), allowing them to adjust the illumination level in the range 100 lx to 900 lx in addition<br />
to the general illumination level of 250 lx. The illumination was selectable as a colour<br />
temperature of 3500 K or 4400 K. The lighting situation at switch-on was varied at intervals of<br />
several weeks using the following combinations: high level of illuminance with low colour<br />
temperature, high level of illuminance with higher colour temperature, low level of illuminance<br />
with higher colour temperature and low levels of illuminnce with low colour temperature. The<br />
users could modify the level of illuminance but not the colour temperature. The result was that<br />
the illuminance levels chosen by the users were set 5% higher at higher colour temperatures.<br />
Productivity (assembly time) was recorded for each preset switch-on value. In this study the<br />
higher colour temperature had a positive effect on productivity (5.7%), the illuminance did not.<br />
C. Study C was carried out in a Dutch electronics company (assembly of electronic components).<br />
Work was done in shifts. The illumination levels at the assembly desks came from the general<br />
illumination and were re-set for each shift to a level of 800 lx or 1,200 lx. Productivity<br />
(assembly time and number of errors) was measured on scanners, which recorded production<br />
time and errors (Juslén and Fassian, 2005). On both shifts productivity increased with increased<br />
illumination (3% and during night shift 7%).<br />
D. Study D was carried out at the packing line of a Dutch food manufacturing company. The<br />
general illumination level before and during the study was approximately 300 lx. An additional,<br />
local lighting was installed and the level of local lighting set alternately to 50 lx or 1,700 lx on a<br />
weekly basis. The rate of absenteeism of the test group was compared with that of the reference<br />
group (no additional workplace lighting). The rates of absenteeism of the test group were 17%<br />
lower than that of the reference group. In order to measure productivity the repair time on the<br />
machines was recorded as representative of the productivity levels of the employees. The test<br />
group increased productivity by 3%, although it should be noted that the difference was only<br />
significant for one particular type of error and for one of the shifts only.<br />
E. In study E the lighting conditions in a Dutch luminaire factory were modified. Local<br />
illumination was introduced and the level increased from 500 lx to 1,050 lx. Productivity and<br />
absenteeism were measured for the test group and compared with the reference group before and<br />
after the change (Juslén und Kremer, 2005). In this study, carried out before and after the<br />
change, productivity increased by 5.5%.<br />
“Lighting engineering 2006” stran 57
R-7 “Razsvetljava in produktivnost na industrijskih delovnih mestih …”<br />
A B C D E<br />
Type of work<br />
Luminaire<br />
assembly<br />
Luminaire<br />
assembly<br />
Electronics<br />
assembly<br />
Machine<br />
maintenance<br />
Luminaire<br />
assembly<br />
Location Finland Germany the<br />
Netherlands<br />
the<br />
Netherlands<br />
the Netherlands<br />
Number of people<br />
in test group<br />
Local Illumination<br />
levels<br />
General<br />
Illumination levels<br />
21 25 35 26 42<br />
100 – 3,000 lx 100 – 900 lx - 50 – 1,700 lx 700 lx<br />
250 lx 250 lx 800 lx / 1,200 lx 300 lx 350 lx<br />
Reference group Yes No No Yes Yes<br />
Reference group<br />
illumination<br />
Changes on local<br />
illumination<br />
Changes on general<br />
illumination<br />
700 lx - - 300 lx 500 lx<br />
User selection User selection - Regular changes Increased once<br />
- - Regular changes - Decreased once<br />
Shifts Day Day Day/eve/night Day/eve/night Day<br />
Length of study 1 year 8 months 2 x 2 months 5 months Before/after<br />
Change in<br />
productivity as a<br />
result of changing<br />
illumination<br />
4.6 %<br />
Not significant<br />
Morning: 3 %<br />
Evening: 3 %<br />
Night 3%<br />
3 % 5.5 %<br />
Change in<br />
productivity as a<br />
result of colour<br />
temperature<br />
Not measured 5.7 % Not measured Not measured Not measured<br />
Change in error rate Not measured Not measured Not significant Not measured Not measured<br />
Change in<br />
absenteeism<br />
Not measured Not measured Not measured -17 % -2.5 %<br />
Table1. Overview of the methodology and the results of the productivity studies<br />
stran 58 Posvetovanje “Razsvetljava 2006”
“Lighting and productivity in the industrial working place ” R-7<br />
3 Discussion<br />
The variations in the studies were designed so that the mechanisms for defining the effects of<br />
changes in illumination on productivity could be investigated in real industrial environments.<br />
However, it appears difficult in practice to determine the effects of different mechanisms on worker<br />
productivity independently of one another.<br />
Nonetheless, the effect of some mechanisms can be evaluated on an approximated basis or<br />
rejected. The evaluation for each study is considered individually below.<br />
The test subjects in study A were provided with a new system of illumination for their workplaces<br />
and according to the questionnaire (Juslén et al 2005) expressed themselves as satisfied with it.<br />
Although the lighting installation was changed, and the initial increase in productivity could be<br />
related to the “process of change” or the “halo effect”, these effects could not be long term and<br />
would become ineffective during the study time of 1 year.<br />
The employees were able to set their own levels of illumination and thus the “autonomy“ aspect<br />
(work satisfaction) could have an influence on productivity.<br />
It is also possible that the photo-biological mechanisms, “biological clock” and “stimulation”,<br />
could have an effect in this case. The effect of using higher levels of illumination during daytime<br />
could strengthen the circadian rhythm thus improving sleep and thereby performance levels during<br />
the day.<br />
In study B productivity increased when the colour temperature was increased. The “change<br />
process” mechanism within the framework of various test situations is discussed below. Since the<br />
illumination levels set by the users for different colour temperatures were almost the same, we can<br />
conclude that the “visual” mechanisms most probably did not have strong effect. This study therefore<br />
concentrates on the “photo-biological” mechanisms. This is in agreement with the results of previous<br />
studies, which indicate that a higher colour temperature increases the attention span of the worker<br />
(Fleischer 2001).<br />
The results of study C are relatively clear. The increase in productivity at higher illumination<br />
levels (1,200 lx as against 800 lx) was observed on all shifts. Since the general level of illumination<br />
was only changed between shifts, it is very unlikely that the “visual surroundings” and the “visual<br />
comfort” have had any influence. For the same reasons (varying levels per shift), and because the test<br />
persons were unaware of the studies and the methodologies, the “process of change” can also be<br />
eliminated. The most likely effective mechanisms in this study are “visual performance levels” and<br />
“stimulation”.<br />
The work carried out in study D deviates considerably from the work carried out at the other<br />
locations. Small reduction in repair time was observed. In retrospect it has been established that the<br />
repair time – the only possible measure of productivity – is not necessarily a representative yardstick<br />
for performance.<br />
However a large decrease in absenteeism was observed. This would suggest some effect from the<br />
mechanisms “job satisfaction” and “stimulation”. Both have an indirect effect on the total<br />
performance of the department.<br />
Study E is a typical “before and after” study. The illumination was changed once and the<br />
measurements made before and then after the change. The reasons for the increase in productivity in<br />
this study is not discussed here, since not all aspects could be brought under complete control, even<br />
by bringing in a reference group.<br />
“Lighting engineering 2006” stran 59
R-7 “Razsvetljava in produktivnost na industrijskih delovnih mestih …”<br />
4 Conclusions and recommendations<br />
From the evidence of the studies described above, it can be concluded that a change and<br />
improvement in lighting can have an effect on productivity. By increasing illumination levels it is<br />
possible to increase a person’s productivity. It is difficult to predict the extent of this effect since the<br />
starting conditions, the final installation, the people involved, the nature of the work and the process<br />
of change all influence the result. Nonetheless taking account of the mechanisms can help to evaluate<br />
the importance of various aspects and to channel the applied effort in the correct direction. Changes<br />
in illumination can be implemented by various means and an increase in productivity achieved using<br />
the above-mentioned ten mechanisms. Lighting changes should be an integral part of a management<br />
process. It can have direct and indirect effects on productivity. Indirect effects such as wellbeing,<br />
alertness and reduced absenteeism are important goals. However, it is the direct goals such as<br />
reduced process times, higher output or increased production quantities which are the priority, since<br />
they are on the one hand more easily measured and on the other provide quick commercial gains. The<br />
following recommendations are intended for practitioners involved in lighting change.<br />
1. Study the present conditions. Inform people that the planning of the lighting change is<br />
going on. Give them a possibility to influence, use unofficial interviews, questionnaire with<br />
also open questions or presentation in workers meeting. Using only questionnaires with<br />
multiple choices is not reliable way to estimate if people will benefit of the lighting change.<br />
Important questions to be answered are: What kind of lighting there is now? Is there<br />
something complained by people? Is something blocking the productivity (speed of the<br />
machine, salary system etc.)? What and where are the tasks?<br />
2. Create a plan. In case something is blocking the productivity increase, try to find way to<br />
overcome the reason or take into account that direct productivity results cannot be achieved.<br />
Use mechanism model to evaluate the effects (direct and indirect) of the lighting chance and<br />
to plan a new lighting. Take into account possible needs for presenting working areas to<br />
customers as well as the needs for flexibility together with good energy management. Figure<br />
2 shows a form that could be used as discussion tool with customer or as a check list.<br />
Consider using localized lighting and giving control to workers. Use norms and codes, but do<br />
not afraid to make better lighting installation than minimums according norms.<br />
3. Make a change. In case lighting change seems to be a reasonable investment, do it by<br />
involving people and follow the process to be able to correct possible misunderstandings or<br />
installation errors.<br />
4. Evaluate the results. Evaluating the results is important since maybe something was<br />
forgotten during the process and can be corrected also later. On the other hand designers or<br />
other parties involved the change, need feedback to be able to learn from the process.<br />
5. Make corrective actions and/or close the project<br />
stran 60 Posvetovanje “Razsvetljava 2006”
“Lighting and productivity in the industrial working place ” R-7<br />
Check list for the base of the lighting design<br />
(workplace lighting)<br />
Mark the importance of the following items to the list<br />
0 Not important at all<br />
3 Very important<br />
Visual performance 0 (Use lower maintained lighting level than defined in norm )<br />
(How well we are able to see) 1<br />
2<br />
3 (Use higher maintained lighting level than defined in norm.)<br />
Visual comfort 0 (Use solution, which is just according minimums in norm.)<br />
(How comfortable it is to look) 1<br />
2<br />
3 (Concentrate on optics and glare limitation & indirect lighting)<br />
Visual ambience 0 (Do nothing special for this purpose)<br />
(How the environment looks like) 1<br />
2<br />
3 (Add some ambience and accent lighting)<br />
Interpersonal relationships 0 (Do nothing special for this purpose)<br />
(How people work together) 1<br />
2<br />
3 (Concentrate on vertical illuminance and colour rendering)<br />
Biological clock 0 (Do nothing special for this purpose)<br />
(when we are awake) 1<br />
2<br />
3 (High lighting levels and/or special spectra as on option.)<br />
Stimulation 0 (Do nothing special for this purpose)<br />
(How alarm we are) 1<br />
2<br />
3 (High lighting levels and/or special spectra as on option.)<br />
Job satisfaction 0 (Do nothing special for this purpose)<br />
(How happy we are for our work) 1<br />
2<br />
3 (Clear lighting improvements and consider using personal control)<br />
Solving problems 0 (Do nothing special for this purpose)<br />
(Is there something so wrong) 1<br />
2<br />
3 (Correct the problem and make note of it)<br />
Change process 0<br />
(How to do the change) 1<br />
2<br />
3 (Always important to inform and involve people)<br />
Flexibility 0 (Do nothing special for this purpose)<br />
(is the purpose of the 1<br />
space always same) 2<br />
3 (Take flexibility under the consideration)<br />
Customers 0 (Do nothing special for this purpose)<br />
(Does it matter 1<br />
how visitors see the space) 2<br />
3 (Use higher lighting levels and consider shop type solutions)<br />
Total<br />
0 Standard 11 22 Demanding 33<br />
Figure 2. Lighting change estimation form. (Customer and designer can together estimate if presented issues are<br />
important in the premises where people are working. It gives also some very simple recommendations if the<br />
importance of the issue is clear. Total points give an indication of complexity of lighting design.)<br />
“Lighting engineering 2006” stran 61
R-7 “Razsvetljava in produktivnost na industrijskih delovnih mestih …”<br />
5 References<br />
1. Bitterli, E. (1955) Licht und arbeit (Light and work). Bull. Ass.Suisse electr. T. 46, n° 12, 559-563<br />
2. Buchanan, T.L., Barker, K.N., Gibson, J.T., Jiang, B.C. and Pearson, R.E (1991) Illumination and<br />
errors in dispensing. AM J Hosp Pharm. 48, 2137-45.<br />
3. Carlton, B. (1980) Industrial lighting must be tailored to real-life working conditions. Electrical<br />
times, issue 4562 (14 March 1980)<br />
4. Crouch, C.L., (1967) Working and living in a luminous environment. Trans. Illum. Eng. Soc vol. 32<br />
No. 1, 41-53<br />
5. Fleischer, S. E. (2001) Die psychologische Wirkung veränderlicher Kunstlichtsituationen auf den<br />
Menschen (The psychological effect on humans of changing artificial light conditions). PhD Thesis<br />
Eidgenössische Technische Hochschule Zürich<br />
6. Goldstern, N. and Putnoky, F. (1931) Die wirtschaftliche Beleuchtung von Webstuhlen; neue<br />
arbeitstechnische Untersuchungen (The economic illumination of weaving looms; new technical<br />
work studies). Licht und Lampe 22, 5-9 und 25-28.<br />
7. Juslén, H., und Kremer, E., 2005. Localised lighting for efficient use of energy and better<br />
performance – Field Study in the factory. CIE mid-term meeting and international lighting Congress,<br />
León 2005, Proceedings<br />
8. Juslén H., Fassian M., Lighting and productivity – Night shift field study in the industrial<br />
environment. Light & Engineering, Vol. 13, No. 2, pp. 59-62, 2005<br />
9. Juslén HT, Wouters MCHM, Tenner AD. The influence of controllable task-lighting on productivity:<br />
a field study. Applied Ergonomics. in press<br />
10. Juslén HT, Tenner AD. Mechanisms involved in enhancing human performance by changing the<br />
lighting in the industrial workplace. International Journal of Industrial Ergonomics. 35 (2005) 843-<br />
855.<br />
11. Lindner, H., (1975) Beleuchtungsstärke und Arbeitsleistung – Systematik experimenteller<br />
Grundlagen (Illumination levels and work performance – systematic experimental principles).<br />
Zeitschrift für die gesamte Hygiene und ihre Grenzgebiete (Journal of hygiene and related<br />
disciplines) 21, 2, 101-107<br />
12. Ruffer, W. (1927) Licht und Leistung (Light and performance). Licht und Lampe , 242-245.<br />
13. Ruffer, W. (1925) Leistungssteigerung durch Verstärkung der Beleuchtung (Improved performance<br />
by increasing illumination). Die Lichttechnik, 53-58.<br />
14. Schneider, L. (1938) Förderung der menschlichen Arbeitsleistung durch richtige Beleuchtung<br />
(Improving human work performance using appropriate illumination). Das Licht 8, 286-96.<br />
15. Stenzel, A.G. (1962) Erfahrungen mit 1000 lx in einer Lederwarenfabrik (Experiences with 1000 lx<br />
in a leather factory). Lichttechnik 14. Jahrgang Nr. 1/1962, 16-18<br />
16. Stenzel, A.G. (1962) Erfahrungen mit 1000 lx in einem Kamerawerk (Experiences with 1000 lx in a<br />
camera factory). Lichttechnik 14. Jahrgang Nr. 7/1962, 351-353<br />
17. Völker, S. 1999 “Eignung von Methoden zur Ermittlung eines notwendigen Beleuchtungsniveaus”<br />
(Application of methods to determine the necessary level of illumination). PhD Thesis Technical<br />
University Ilmenau<br />
18. Wyon, D. P. (1996) Indoor environmental effects on productivity, In: Proceedings of IAQ 96- Paths<br />
to better building environments, (edited by K. Y. Teichman), ASHRAE, Atlanta, 5-15.<br />
Avtorjev naslov / Author's address:<br />
Henri Juslén, Philips Lighting BV, IDMAN Oy,<br />
Mattilantie 75, PL 4, Mäntsälä, Finland<br />
stran 62 Posvetovanje “Razsvetljava 2006”
“Dynamic Lighting for Well-Being in Work Places …” R-8<br />
Martine Knoop<br />
DYNAMIC LIGHTING FOR WELL-BEING IN WORK PLACES:<br />
ADDRESSING THE VISUAL, EMOTIONAL AND BIOLOGICAL ASPECTS<br />
OF LIGHTING DESIGN<br />
Abstract<br />
Light can be used to increase alertness, evoke relaxation and suppress<br />
sleepiness. Therefore, it can be deployed to support the well-being and<br />
performance of people in working places. These so-called ‘non-visual’ or<br />
‘biological’ effects have become an increasingly important topic in lighting<br />
design over the last few years. Research on the physical effects of light on<br />
our body, as opposed to effects on visual perception and emotion, is still ongoing.<br />
This paper will discuss the implementation of current research results<br />
into practical applications.<br />
Furthermore, this article will discuss opportunities and benefits for<br />
lighting designers to apply this research by suggesting methods of<br />
application in lighting solutions for various work places. Those are driven<br />
by biological aspects of lighting, but take into account visual and emotional<br />
attributes, to aim at overall well-being in work places.<br />
Povzetek<br />
Dinamična razsvetljava za dobro počutjena delovnem mestu:<br />
upoštevanje vidnih, čustvenih in bioloških vidikov razsvetljave. S pomočjo<br />
razsvetljave lahko izboljšamo budnost, prikličemo sproščenost in<br />
preprečimo zaspanost. Torej jo lahko uporabimo za izboljšanje dobrega<br />
počutja in učinka na delovnem mestu. Ti takoimenovani »nevizualni« ali<br />
»biološki« učinki postajajo vedno pomembnejši dejavniki načrtovanja<br />
razsvetljave. Raziskave na področju fizikalnih učinkov svetlobe na naše telo,<br />
ki so lahko popolnoma drugačni od učinkov na vidno zaznavanje in čustva,<br />
še vedno potekajo. Ta prispevek bo prikazal uporabo trenutnih raziskovalnih<br />
dosežkov v praktičnih aplikacijah.<br />
Razen tega bodo prikazane priložnosti in prednosti za oblikovalce<br />
svetlobe pri uporabi dosežkov teh raziskav s predlogi metod za njihovo<br />
uporabo za razna delovna mesta. Ti predlogi so narejeni na osnovi bioloških<br />
aspektov razsvetljave, vendar ob upoštevanju vidnih in emocionalnih<br />
lastnosti, s ciljem splošnega dobrega počutja na delovnem mestu.<br />
“Lighting engineering 2006” stran 63
R-8 “Dinamična razsvetljava za dobro počutje na delovnem mestu …”<br />
1 Introduction<br />
Lighting is a powerful tool in architectural design. It addresses both functional as well as<br />
emotional needs in indoor and outdoor environments. Over the last two decades it has become clear<br />
that light has a biological effect as well. Light reaching the retina is not solely processed by the cones<br />
and rods, but also by intrinsically photosensitive retinal<br />
ganglion cells called the ‘3rd receptors’. From these cells,<br />
signals are sent to the suprachiasmatic nucleus (SCN) of the<br />
hypothalamus, our main body clock. From the SCN,<br />
information is send to the pineal gland, where the<br />
information is used for the production of hormones and the<br />
modulation of body temperature (Figure 1).<br />
Figure 1: Visual and biological pathways in the brain: nerve<br />
connections between the retina of the eye, with its cones and rods,<br />
and the visual cortex on the one hand (continuous line) and between<br />
the retina, with the novel photoreceptor cell, and the SNC and the<br />
pineal gland (broken line) (Source: van Bommel and van den Beld<br />
2004)<br />
Both play an important role in the regulation of our circadian rhythms. Circadian rhythms are<br />
cycles of approximately 24 hours (‘circadian’ finds it’s origin in Latin, ‘circa’ = about, ‘diem’ = day).<br />
Such rhythms can be found in human beings, animals and plants. They regulate our daily life:<br />
sleep/wake and feeding patterns, hormone production and brain activity are typical examples of<br />
circadian cycles (see Figure 2 for examples of circadian rhythms). To put this into practice for work<br />
places, circadian rhythms determine when we feel sleepy, active or alert.<br />
cortisol<br />
alertness<br />
melatonin<br />
body temperature<br />
Figure 2:<br />
Circadian rhythms of production of cortisol and melatonin, of alertness and body temperature<br />
stran 64 Posvetovanje “Razsvetljava 2006”
“Dynamic Lighting for Well-Being in Work Places …” R-8<br />
2 General ‘principles’ for biological aspects of lighting<br />
Hormone production, responding to light during day and night<br />
Light is the most powerful time cue for circadian rhythms. Increasing light levels in the morning<br />
(sunrise) signals the human body to start its active cycle. A number of hormones, like adrenaline,<br />
cortisol and serotonin are produced. Cortisol is the hormone that wakes us up and gets us out of our<br />
sleep-mode (see Figure 3). Whereas serotonin and adrenaline production continue over the day,<br />
cortisol is only meant to be in the system for a shorter time period; the cortisol level drops during the<br />
day.<br />
The reduction of daylight intensity in the evening (sunset) is an indication for the human body to<br />
prepare the body to slow down. Hormones play an important role in this as well. Melatonin is the<br />
hormone produced during the night, and in combination with darkness, the body identifies this as<br />
nighttime. For human beings, nighttime cues lead to a reduction in body activity, slowing of<br />
metabolism and preparation for sleep; for nocturnal organisms, like owls, nighttime signals cause<br />
increased activity.<br />
Cortisol level<br />
Melatonin level<br />
Figure 3:<br />
Hormone production and activity level<br />
Left picture: 9 am, daylight makes the cortisol level raise, we feel awake and active<br />
Right picture: 1 am, lack of daylight makes the melatonin level raise, we feel sleepy<br />
Light for circadian, phase shifting effects<br />
Since light is such an important time cue for circadian rhythms, it can be used to adjust to<br />
situations where activities take place that do not coincide with our circadian rhythms. This is the case<br />
for people working in a night shift or traveling across several time zones in a short time period: they<br />
need to be awake when the body is programmed to sleep and the other way around. Offering higher<br />
light levels at times when the body is not expecting them will cause a biological effect. Evening light<br />
will give the body a signal that it is still daytime, and sleepiness will occur later. Light in the<br />
morning, on the other hand, will cause sleepiness earlier in the evening. This is called phase shifting<br />
(see Figure 5, next page).<br />
The minimum core body temperature (CBT) is crucial in phase shifting, since it determines the<br />
body’s interpretation of ‘evening’ and ‘morning’ as mentioned above. Although there is a wide<br />
spread in timing of the individual minimum core body temperature, in most adult working people the<br />
core body temperature will reach its minimum between 03:00 and 06:00 a.m. In this time period the<br />
urge to sleep is strongest.<br />
“Lighting engineering 2006” stran 65
R-8 “Dinamična razsvetljava za dobro počutje na delovnem mestu …”<br />
In realizing a phase shift, timing is crucial (see Figure 4). Before the minimum CBT the light will<br />
be seen as ‘evening’ light; after the minimum CBT the light is seen as ‘morning’ light. Note,<br />
however, that the above-mentioned time period of 03:00 to 06:00 a.m. cannot be applied as a<br />
standard; the CBT differs individually, and may well occur beyond or before this mentioned period.<br />
The minimum CBT of teenagers for example, may occur in the early morning. ‘Early morning’ light<br />
could - in this case - be perceived as ‘late evening’ light and cause an opposite reaction as intended to<br />
achieve. As can also be seen from Figure 4, the effect of light on our circadian rhythms is largest<br />
when the body is normally not expecting any light.<br />
CBT<br />
Figure 4:<br />
Phase response curve. Source: „Light, Sight, and Photobiology“ by Peter Boyce<br />
(http://www.lrc.rpi.edu/programs/Futures/LF-Photobiology/index.asp)<br />
Important parameters in the phase shifting effects of light include size and position of the light<br />
source, duration and timing of exposure, light wavelength and light intensity. Research is still ongoing,<br />
but a few results, focusing on duration and wavelength, give directions to lighting solutions<br />
that can be offered in practice already.<br />
• Research has shown that light with wavelengths between 440 and 475 nm is most<br />
effective in causing a circadian shift. For example, Lockley, Brainard and Czeisler (2003)<br />
found that humans exposed to 6.5 h of monochromatic blue light (460 nm) had a two<br />
times greater circadian phase delay than with 555 nm light. At the same time, melatonin<br />
was suppressed twice as much with 460 nm light than with 555 nm light.<br />
• There are indications that pulses of light result in phase shifting effects comparable to<br />
those realized with continuous exposure to the same level of bright light (Rimmer et al.<br />
2000). Research by Gronfier et al. 2000 showed that a 6.5 h continuous exposure to<br />
bright light (9500 lx at the eye) had about the same phase shifting effect as six 15<br />
minutes pulses of the same light separated by 1 hour.<br />
The use of phase shifting in applications and the resulting lighting solutions will be discussed<br />
later, in the section on nighttime work places.<br />
stran 66 Posvetovanje “Razsvetljava 2006”
“Dynamic Lighting for Well-Being in Work Places …” R-8<br />
Level<br />
reference point<br />
"sleepiness"<br />
■ night time / □ day time ■ reference point for a certain amount of sleepiness<br />
longer<br />
period<br />
Level<br />
ligh<br />
t<br />
reference point<br />
"sleepiness"<br />
Phase delay: Evening light. The ‘day’ is artificially lengthened, sleepiness will occur later<br />
ligh<br />
t<br />
Level<br />
reference point<br />
"sleepiness"<br />
shorter<br />
period<br />
Phase advance: Morning light. The ‘day’ starts earlier, sleepiness will occur earlier<br />
Figure 5:<br />
General principles of phase shifting for a typical circadian rhythm, like blood hormone levels or<br />
activity levels. Adapted from “Overview of Circadian Rhythms” by Hotz Vitaterna, Takahashi and<br />
Turek<br />
“Lighting engineering 2006” stran 67
R-8 “Dinamična razsvetljava za dobro počutje na delovnem mestu …”<br />
Direct, non-circadian effects of light<br />
Next to the circadian, phase shifting, effects, light can cause direct biological effects as well, of<br />
which a few are listed below. The direct effects of light are independent of circadian rhythms. In<br />
principle, these responses to light exposure could occur at any time, day or night, by introducing<br />
bright light (de Groot et al. 2006):<br />
• Light at night results in an immediate suppression of melatonin and a reduction of<br />
sleepiness (Figure 6). This effect is greater under blue light compared to red light (Rüger<br />
2005).<br />
• Daytime bright light can reduce sleepiness and fatigue even though melatonin is virtually<br />
absent and core body temperature is nearly constant (Rüger 2005).<br />
• Kayumov et al. (2005) found that blue deficient light, as a result of wearing goggles<br />
blocking wavelengths < 530 nm, did not suppress melatonin at night, which was the case<br />
with white light of the same lighting level (800 lux).<br />
• Bright light in the early morning results in an immediate increase of cortisol (Leproult et<br />
al. 2001), whereas afternoon bright light does not have this effect on the cortisol<br />
production (Leproult et al. 2001, Rüger 2005).<br />
• A temporary increase of light levels, and/or an increase of the direct component, can raise<br />
vigilance and thus enhance work performance (Fleischer 2001).<br />
• Warm white light facilitates relaxation, while daylight-white light is stimulating<br />
(Fleischer 2001).<br />
• Average pupil size was significantly smaller under 5500 K compared to 3600 K (Berman<br />
et al. 2006), resulting in an increase of visual acuity.<br />
melatonin concentration pg/ml<br />
(mean value)<br />
light exposure<br />
ocular light,<br />
5000 lux at the eye<br />
from 24:00 to 04:00<br />
dim light,<br />
max .10 lux at the eye<br />
Figure 6:<br />
21 22 23 24 1 2 3 4 5 6 7 8<br />
time (h)<br />
An example of a direct, biological, effect of light: melatonin suppression during the night<br />
Adapted from Rüger 2005<br />
Consequently, light can be used to cause a direct effect to activate the human body, to reduce<br />
sleepiness during day- and nighttime and to increase visual acuity, all of which will indirectly<br />
enhance working conditions. High light levels and light with a high blue component (cooler color<br />
temperature) are most effective.<br />
stran 68 Posvetovanje “Razsvetljava 2006”
“Dynamic Lighting for Well-Being in Work Places …” R-8<br />
3. Applications and lighting solutions<br />
A distinction between direct biological and phase shifting effects of light can be made, as<br />
described above. The direct biological effects of light can be caused during day- and nighttime, with<br />
the strongest phase shifting effects of light induced during nighttime.<br />
As a result, the lighting solutions for day- and nighttime might differ from each other. These<br />
distinct approaches will be discussed in the following section, focusing primarily on lighting<br />
solutions for healthy working people.<br />
Daytime work places<br />
During daytime, the only biological effects to reach with lighting are the reduction of sleepiness<br />
and the increase of alertness.<br />
Bright light with high color temperatures will provide a good start of the day, due to suppression<br />
of the remaining melatonin in the body and the increase of cortisol level (Rüger 2005, Leproult et al.<br />
2001). The circadian rhythm of alertness peaks in the morning and in the early evening, where<br />
additional support of light is not necessary.<br />
The so-called ‘post lunch dip’ is a time period of decreased alertness that occurs between 1 p.m.<br />
and 4 p.m, taking into account individual differences. For those workers that will not be able to take<br />
a long lunch break or a nap, lighting is a solution. In contrast to the morning, we cannot address the<br />
post lunch dip by means of hormone production (Rüger 2005, Leproult et al. 2001). Although not<br />
clarified yet, it is clear that other pathways besides the mechanisms of hormone production affect<br />
alertness; research has shown an increase of alertness in the afternoon induced by the use of higher<br />
color temperatures and higher light levels (Fleischer 2001, Rüger 2005).<br />
Based on the above-mentioned biological effects, ‘Dynamic Lighting’ has been developed.<br />
Dynamic Lighting is a concept to increase well-being, motivation and performance of people, by<br />
supporting the natural rhythm of activity. High light levels with cooler color temperatures are used to<br />
stimulate, while lower light levels with lower color temperatures have a less stimulating, more<br />
relaxing effect.<br />
These principles are shown in Figures 7 and 8.<br />
Cool white light (5000 K)<br />
Warm white light (3000 K)<br />
Lighting level<br />
(500 - 900 lux)<br />
Figure 7:<br />
Left picture: Start of the working day. Cool light, increased lighting level, to raise the energy level and<br />
provide a good start of the day<br />
Right picture: Lunch time. Warm light, decreased lighting level. Time to recharge batteries<br />
“Lighting engineering 2006” stran 69
R-8 “Dinamična razsvetljava za dobro počutje na delovnem mestu …”<br />
Cool white light (5000 K)<br />
Warm white light (3000 K)<br />
Lighting level<br />
(500 - 900 lux)<br />
Figure 8:<br />
Left picture: After lunch. Cool light, increased lighting level, to counter the ’post lunch dip’<br />
Right picture: Happy hour. Cool light, lower lighting level, to raise concentration before going home<br />
Application<br />
Dynamic Lighting maintains optimal alertness levels during the day, with clear applications in<br />
offices, industry, hospitals and schools.<br />
Figure 9:<br />
Application of Dynamic Lighting in a conference room<br />
Figure 10:<br />
Application of Dynamic Lighting in an office room<br />
stran 70 Posvetovanje “Razsvetljava 2006”
“Dynamic Lighting for Well-Being in Work Places …” R-8<br />
Nighttime work places<br />
During daytime, the focus is on achieving direct biological effects. This is not the case when we<br />
look at applications in which people have to work at night, like hospitals, control rooms and industry.<br />
During nighttime, direct biological effects and circadian phase shifting effects can be realized as<br />
well as caused by use of light at night. People working on times conflicting with their normal<br />
circadian rhythms might want to shift the circadian rhythms when this is a long term condition. In<br />
case of fast rotating shift work, or single nights of work, a phase shift is not desired. This asks for a<br />
distinct approach for those two cases.<br />
1. Long-term night shift<br />
For applications with long-term night shifts, light at night increases alertness during nighttime<br />
and result in a controlled phase shift. Research shows that high light levels, in long pulses or<br />
continuous during the whole time period, suppress the production of melatonin and can be used to<br />
stimulate a phase shift. Most effective in this application is bluish light at high light levels. In the<br />
morning, light without biological stimulating effects should be offered, to prevent a discarded phase<br />
advance shift (see Figure 3).<br />
The above-mentioned ‘Dynamic Lighting’ can be applied during night shifts as well. High color<br />
temperatures and (pulses of) high light levels should be applied in the beginning of the evening,<br />
changing to lower levels and color temperatures at the end of the night shift. This should be<br />
supported by reduced light exposure over the day. It is advised to wear sunglasses while driving<br />
home and sleep in complete darkness during the day. Dark/light rhythms are very important for<br />
health and circadian rhythms.<br />
In view of the fact that light pulses might be as effective as continuous exposure to bright light,<br />
localized solutions in break rooms are especially suitable for industry applications, where break<br />
times are fixed and light exposure can be guaranteed.<br />
“Lighting engineering 2006” stran 71
R-8 “Dinamična razsvetljava za dobro počutje na delovnem mestu …”<br />
Application<br />
Dynamic Lighting for night shifts increases alertness during the night and causes a phase shift,<br />
with clear applications in industry, hospitals and control rooms.<br />
Figure 11:<br />
Application of Dynamic Lighting in hospitals (left) and control rooms (middle, right)<br />
2. Fast rotating night shifts & working single nights<br />
In a number of European countries, fast rotating night shifts are common practice (de Groot,<br />
2005). Under these circumstances, the lighting should increase alertness during nighttime, however<br />
without causing a phase and the suppression of melatonin. A phase shift would cause problems<br />
adjusting back to the normal daily schedule following the short night shift period.<br />
Kayumov et al. (2005) showed no reduction of people’s performance during work at night when<br />
using light with a low blue component, instead of white light. With blue deficient light, melatonin<br />
production was not suppressed, which was the case with white light of the same lighting level (800<br />
lux). Blue deficient light might be a lighting solution for fast rotating shift work, however it has not<br />
yet been proven whether this effect lasts over a longer period. Furthermore, a number of additional<br />
aspects must be taken into account that might affect the circadian rhythm in another way. Insight has<br />
to be collected on the consequences of the use of blue deficient light in rapidly rotating night shift<br />
schedules on:<br />
- sleep quality during daytime;<br />
- alertness during night time; and,<br />
- melatonin production in the consecutive nights.<br />
Further research will have to focus on these aspects in order to develop carefully considered<br />
night-shift light plans for rapidly rotating shift schedules.<br />
4 Overall well-being<br />
Light for well-being of people takes into consideration visual, emotional and biological aspects.<br />
The biological aspects have been discussed in this paper.<br />
Light for vision has been studied for years, resulting in recommendations for comfortable, glare<br />
free task lighting in work places. This has been taken into consideration in the choice of luminaires<br />
and minimum maintained illuminance levels for Dynamic Lighting.<br />
stran 72 Posvetovanje “Razsvetljava 2006”
“Dynamic Lighting for Well-Being in Work Places …” R-8<br />
The emotional aspects of lighting have become more important during the last decades. Lighting<br />
designers and architects use light to create atmosphere and effects in interior and exterior spaces.<br />
Individual taste, mood, culture and experiences are just a few parameters that will influence the<br />
appreciation of this subjective aspect of a lighting design, and with this the well-being of users. With<br />
Dynamic Lighting, level and color temperature of the light change. This will have a direct effect on<br />
the perception of the room. Dynamic Lighting can turn rooms into motivating areas to concentrate, as<br />
well as into homey spaces for relaxation, by changing light level and color temperature. It is a<br />
powerful tool in the design of modern office environments, where flexibility in atmosphere is<br />
desired.<br />
5 Summary: Lighting solutions for well-being in work places<br />
This paper discussed the implementation of current results of research on biological effects of<br />
light. These effects can be divided into (circadian) phase shifting effects and (non-circadian) direct<br />
effects. Light with a relatively high level and/or containing lower wavelengths has the strongest<br />
impact on these effects. Phase shifting effects can be utilized to adapt the circadian rhythm to<br />
working conditions that do not coincide with it, like long-term night shift work. Direct, non-circadian<br />
effects can be employed to increase alertness and reduce sleepiness, during day- and nighttime.<br />
The discussed resulting lighting solutions are driven by biological aspects of lighting, but need to<br />
take into account overall well-being. Therefore, all requirements concerning a functionally and<br />
emotionally well balanced lighting installation must also be fulfilled. When dealing with light for<br />
well-being, the suitable solution seems to be dynamic lighting: change of lighting situations, adjusted<br />
to the requirements of the moment.<br />
References<br />
19. Berman SM, Navvab M, Martin MJ, Sheedy J and Tithof W (2006) Children's near acuity is better<br />
under high colour temperature lighting. Lighting Research and Technology, Vol. 38, No. 1, pp. 41-<br />
52.<br />
20. Bommel WJM van, Beld GJ van den (2004) Lighting for work: visual and biological effects.<br />
Lighting Research and Technology, 36(4), 255 - 269<br />
21. Fleischer SE (2001) Die psychologische Wirkung veränderlicher Kunstlichtsituation auf den<br />
Menschen. Ph.D. thesis Eidgenössiche Technische Hochschule (ETH) Zürich<br />
22. Groot, EH de (2005) Voordelen van fotobiologische verlichtingssystemen tijdens de nachtdienst.<br />
NSVV Lichtcongres<br />
23. Groot, EH de (2006) benefits of photobiological light exposure during night-shift work. CIE Light &<br />
Health conference – Ottawa, Canada.<br />
24. Gronfier C, Kronauer RE, Wright KP, Czeisler CA (2000) Phase-shifting effectiveness of intermittent<br />
light pulses: Relationship to melatonin suppression. 7th Meeting of the Society for Research on<br />
Biological Rhythms – Jacksonville.<br />
25. Hotz Vitaterna M, Takahashi JS and Turek FW (2001) Overview of Circadian Rhythms. Alcohol<br />
Research and Health<br />
26. Kayumov L, Casper RF, Hawa RJ, Perelman B, Chung SA, Sokalsky S, and Shapiro CM (2005)<br />
Blocking low-wavelength light prevents nocturnal melatonin suppression with no adverse effect on<br />
performance during simulated shift work. J Journal of Clinical Endocrinology & Metabolism<br />
(90):2755-2761.<br />
“Lighting engineering 2006” stran 73
R-8 “Dinamična razsvetljava za dobro počutje na delovnem mestu …”<br />
27. Leproult R, Colecchia EF, L'Hermite-Baleriaux M, Van Cauter E (2001) Transition from dim to<br />
bright light in the morning induces an immediate elevation of cortisol levels.<br />
J.Clin.Endocrinol.Metab. 86: 151-157<br />
28. Lockley SW, Brainard GC and Czeisler CA (2003) High sensitivity of the human circadian<br />
melatonin rhythm to resetting by short wavelength light. Journal of Clinical Endocrinology &<br />
Metabolism 88(9):4502-4505<br />
29. Rimmer DW, Boivin DB, Shanahan TL, Kronauer RE, Duffy JF, Czeisler CA (2000) Dynamic<br />
resetting of the human circadian pacemaker by intermittent bright light. Am J Physiol Regulatory<br />
Integrative Comp Physiol. 279: R1574–R1579<br />
30. Rüger M (2005) Lighting up the human circadian clock. Ph.D. thesis University of Groningen<br />
Avtoričin naslov / Author’s address:<br />
Dr. Martine Knoop<br />
Senior Lighting Application Specialist, Lighting Design and Application Center (LiDAC), Philips Lighting<br />
and Visiting Professor, Eindhoven University of Technology, department of architecture, building and planning<br />
Corresponding address:<br />
Mathildelaan 1, Building EDW 618<br />
5611 BD Eindhoven, the Netherlands<br />
Email: martine.knoop@philips.com<br />
stran 74 Posvetovanje “Razsvetljava 2006”
“The background luminance and colour temperatures influence …” R-9<br />
Tommy Govén<br />
THE BACKGROUND LUMINANCE AND COLOUR TEMPERATURES<br />
INFLUENCE ON ALERTNESS AND MENTAL HEALTH<br />
VPLIV SVETLOSTI OZADJA IN BARVNE TEMPERATURE NA BUDNOST IN<br />
DUŠEVNO ZDRAVJE<br />
“Lighting engineering 2006” stran 75
R-9 “ Vpliv svetlosti ozadja in barvne temperature na budnost …”<br />
Purpose of the study<br />
”to lay down the appropriate luminance levels at different colour temperatures for ambient<br />
lighting within working areas”<br />
New research in lighting has shown that light is not only influencing the visual centra – it also<br />
affects the whole body.<br />
For more than 150 years we have considered rods and cones to be the only photo-receptors in the<br />
human eye and that these only affect the visual centra. Four years ago a new 3rd receptor was found<br />
by David Berson at Brown University USA which in fact was the missing link in how the human<br />
wealth is influenced by lighting.<br />
It is now shown that light influences different hormones in the brain where the pineal gland<br />
plays an important role in controlling the sleep hormone melatonin which is provided to the blood in<br />
the body at low light levels or in darkness. At high light levels the stress hormone cortisol is<br />
produced by the adrenal cortex which contributes to alertness.<br />
During the last years a lot of studies have been carried out on how the spectrum of the light<br />
(daylight and artificial) affects the hormone suppression and how colours and light distribution in the<br />
visual field brings emotional effects to the human being.<br />
Colours and light distribution in the visual field brings emotional effects to the human being.<br />
New legislations on the use of energy and findings in research will and have already created new<br />
more efficient lighting systems which are optimal for vision as well as for the human health.<br />
Lighting design will in the future be more focused on visual, biological and emotional aspects<br />
and future lighting systems must at the same time be energy efficient. In order to evaluate the need a<br />
sufficient luminance level of ambient light over a working day and the influence of different colour<br />
temperatures from different artificial light sources within in the visual field a study is now going on<br />
in cooperation with the Lund University, Fagerhult and the Swedish Energy Agency. The main focus<br />
of this study is the impact of fluorescent light on endocrine and subjective indices of arousal.<br />
60 subjects of different age are participating in study. Some of the subjects will be diagnosed as<br />
SAD-patients (which are affective to the seasonal disorder of light). The study is carried out in two<br />
equal equipped office rooms where the ambient light in the visual field of view is set to different<br />
light levels and colour-temperatures.<br />
The Human Aspects of Light<br />
Lighting design will in the future be more focused on visual, biological and emotional aspects<br />
and future lighting systems. In order to describe the design purpose the following evaluation system<br />
can be used.<br />
stran 76 Posvetovanje “Razsvetljava 2006”
“The background luminance and colour temperatures influence …” R-9<br />
Evaluation of a lighting system.<br />
Evaluation of lighting in a working area.<br />
Evaluation of a lighting system<br />
For example in working areas – at task – the visual aspects are of most importance. However, the<br />
emotional and biological aspects has also to be considered in order to create creativity and<br />
productivity. In classrooms all aspects could be of equal importance.<br />
Visual<br />
- Task light<br />
- Visual performance<br />
- Contrast<br />
- Glare<br />
Biological<br />
- Ocular light<br />
- Circadian effects<br />
- Mental health<br />
- Alertness<br />
Emotional<br />
- Comfort<br />
- Dynamics<br />
- Colours<br />
- Colour of light<br />
Method<br />
The main focus of the study is the impact of fluorescent light on endocrine and subjective indices<br />
of arousal.<br />
Initially two types of fluorescent T5-tubes were used – 3000K and 4000K – each at three<br />
different luminance levels of the ambient vertical light – initially 10 cd/m2, 100 cd/m2 and 350<br />
cd/m2. The light spectrum was kept constant for all luminance levels for the different colour<br />
temperatures.<br />
The vertical luminance was kept uniform within ±30° of the horizontal line of sight.<br />
The horizontal illuminance will be kept at 500 lux within the working area /task area for each<br />
ambient luminance level.<br />
Exposure last for one whole day for each of the six combinations. The rooms are designed as<br />
ordinary office rooms. In a pilot study the luminance levels was checked to be reasonable. Thereafter<br />
the final luminance levels were decided. The subjects are randomly assigned to start at different<br />
levels of luminance.<br />
“Lighting engineering 2006” stran 77
R-9 “ Vpliv svetlosti ozadja in barvne temperature na budnost …”<br />
Measurements concerning the endocrine indices (cortisol and melatonin) are obtained in the<br />
morning and in the afternoon on the day of light exposure, but also on the days preceding and<br />
following the experiment.<br />
The morning samples were collected by the subjects around seven o’clock, which means that the<br />
obtained values will reflect the amount of melatonin excreted during night, as well as the pronounced<br />
diurnal rise in cortisol taking place in the early morning. The samples from the afternoon were taken<br />
around four o’clock, showing the suppression of melatonin during the day as well as the levels of<br />
cortisol.<br />
Furthermore, the visual discomfort, subjective assessment of lighting quality was assessed by<br />
different forms shown on a VDU connected to a computer in the office room.<br />
The affective state of the subjects described as general well-being, level of sociability and<br />
activation is also measured.<br />
Additional measurements concerning personality and diurnal rhythm are also conducted by<br />
means of questionnaires and interviews.<br />
The data were treated by means of a repeated measurement where every subject acts as their<br />
own control.<br />
Design of the Study<br />
In order to evaluate how the subjects reacted mentally each subject had to go through a two days<br />
test scheme. The subjects had to pass test scheme when exposed to the different ambient luminance<br />
levels at the different colour temperatures.<br />
stran 78 Posvetovanje “Razsvetljava 2006”
“The background luminance and colour temperatures influence …” R-9<br />
Time Schedule<br />
Day 1 PM<br />
14:45 Saliva – Cortisol 1<br />
Urine – Melatonin 1<br />
For each light setting endocrine indices on<br />
Cortisol levels was measured 5 times and on<br />
Melatonin 2 times. Subjective and emotional tests<br />
of the different light scenes was also carried out<br />
during the test as shown in the enclosed test<br />
schedule beside.<br />
Day 2 AM<br />
07:00 Wake-up time – Saliva Cortisol 2<br />
08:45 Saliva Cortisol 3<br />
09:00 PC-Computer welcomes<br />
09:15 Subjective experience of lighting 1<br />
09:30 Subjective emotional experience 1<br />
10:00 Visual stress 1<br />
10:30 Daily rhythm (subjective experience)<br />
11:00 Subjective experience of lighting 2<br />
11:30 SMB (subjective conception of the room)<br />
11:45 Saliva – Cortisol 4<br />
12:00 Lunch at site<br />
Day 2 PM<br />
13:15 Subjective experience of lighting 3<br />
13:30 Subjective emotional experience 2<br />
14:00 Visual stress 2 (eye strain – due to glare)<br />
14:30 SQM (SAD-test questionnaire)<br />
14:50 Personality test type AB<br />
15:10 SIGH Revised (depressive ability)<br />
15:30 Subjective experience of lighting 4<br />
15:45 Subjective emotional experience 3<br />
15:50 Saliva - Cortisol 5<br />
Urine - Melatonin 2<br />
16:00 Debriefing<br />
Preliminary results<br />
Today 15 subjects out of 60 have completed the study. The preliminary results on the emotional<br />
and perceptual indices are shown below.<br />
Emotional Aspects<br />
Subjective arousal – The awakeness<br />
showed a significant difference between<br />
the three lightness levels. The subjects<br />
showed more arousal when the ambient<br />
luminance was higher.<br />
The same was true for the total emotional<br />
index, although the difference was not so<br />
pronounced. However, no differences<br />
were found between the two colour<br />
temperatures, according to arousal. (see<br />
figure).<br />
“Lighting engineering 2006” stran 79
R-9 “ Vpliv svetlosti ozadja in barvne temperature na budnost …”<br />
Visual Aspects<br />
Perceptual experience –<br />
Subjects sitting in the 4000K room<br />
experienced the room significant<br />
more cool than their counterparts in<br />
the 3000K room. The visual<br />
perception of brightness also showed<br />
a significant difference between the<br />
three lightness levels. However, the<br />
subjects experienced the 100 cd/m2<br />
situation as the brightest, followed<br />
by the 350 cd/m2. The 10 cd/m2<br />
situation was perceived as the least<br />
bright environment. This result may<br />
be caused by the fact, that when the<br />
lightness of the ambient light is<br />
higher than the lightness of the<br />
working area (desk lightness ~140<br />
cd/m2) the eye is adapted to a higher<br />
level which results in a lower<br />
brightness of the desk. (see figure).<br />
No significant differencies were found between 3000K and 4000K.<br />
Previous studies on preferred luminance distribution has shown that ambient light levels around<br />
75 cd/m2 at a horizontal illumination level at task of 500 lux when using general lighting systems.<br />
(Preferred luminance distribution in working areas – T.Govén et al - Right Light 5, 2002 -Nice)<br />
Further analyses<br />
Biological aspects<br />
During September and October the data collection will be completed. The final assessments will<br />
contain analyses of the endocrine measurements on cortisol and melatonin, the individual parameters<br />
such as diurnal rhythms and personality. Finally, more elaborated analyses concerning the subjective<br />
ratings including changes over time, will be conducted.<br />
Avtorjev naslov / Author’s address:<br />
Tommy Govén - Fagerhult, Sweden – 09/2006<br />
tommy.goven@fagerhult.se<br />
stran 80 Posvetovanje “Razsvetljava 2006”
“Optimal Color Primaries for Three- and Multi-primary Wide Gamut Displays ” R-10<br />
László Beke, Youngshin Kwak, Peter Bodrogi, Seong Deok Lee, Du-Sik Park, Chang Yeong Kim<br />
OPTIMAL COLOR PRIMARIES FOR THREE- AND MULTI-PRIMARY WIDE<br />
GAMUT DISPLAYS<br />
Summary<br />
The paper presents a collection of principles to compare two sets of color<br />
primaries for three- and multi-primary wide gamut displays. A comprehensive<br />
set of design guidelines and a new, algorithmic 3 dimensional method to find<br />
optimal color primaries both for three-primary and multi-primary displays is<br />
described. The method was implemented in a computer program; the resulting<br />
optimal color primary sets are discussed. The paper shows that traditional two<br />
dimensional methods to find optimal color primaries by using a chromaticity<br />
diagram are theoretically inferior to 3 dimensional optimization techniques that<br />
include luminance information.<br />
Povzetek<br />
Optimalne osnovne barve za tri- in večbarvne ekrane s širokim barvnim<br />
obsegom V članku so prikazani različni principi za primerjavo dveh kompletov<br />
osnovnih barv za tri- in večbarvne ekrane širokega barvnega obsega. Obširno<br />
so opisana navodila za njihovo dizajniranje, pa tudi nova tridimenzionalna<br />
metoda za iskanje optimalnih osnovnih barv za tribarvne in večbarvne ekrane.<br />
Prikazana je tudi uporaba nove metode v ustreznem računalniškem programu. Z<br />
njim smo določili različne nabore optimalnih osnovnih barv in jih podrobneje<br />
obravnavali. Pokazali smo, da ima nova, tridimenzionalna metoda za iskanje<br />
optimalnih osnovnih barv, ki vključuje tudi svetlost, precej prednosti pred<br />
tradicionalno dvodimenzionalno metodo, ki temelji na uporabi barnega<br />
diagrama.<br />
1. Introduction<br />
Digital imaging in electronic commerce, telemedicine, etc., demands ever higher image quality.<br />
Image quality is formulated in many ways from pSNR through S-CIELAB [1] to iCAM [2]. There is<br />
a general agreement that color fidelity is of primal importance. Ideally, displaying or executing color<br />
fidelity enhancement transforms on realistic images requires such displays that do not place any<br />
restrictions on the range of displayable colors (i.e. the color gamut). In lack of these displays, gamut<br />
mapping methods of more or less complexity have been developed [3] but all of them distort image<br />
“Lighting Engineering 2006” stran 81
R-10 “Optimalne osnovne barve za tri- in večbarvne ekrane s širokim barvnim obsegom”<br />
information in some way. It seems more desirable to design such displays that reduce the need for<br />
gamut mapping algorithms by enabling a wide color gamut.<br />
For displaying a certain color, most displays utilize additive color mixing, by using three or more<br />
primary color stimuli, which either undergo spatial (CRT, TFT etc.) or temporal (DLP) integration,<br />
utilizing the limited resolving power of the human visual system, or are projected onto the same<br />
locus by three different sources (LCD projection).<br />
The range of displayable colors depends on the colorimetric properties [4] of the primaries but<br />
the number of primary colors is also important. Classical three-primary color matching experiments<br />
show that for certain test colors negative amounts of a primary is needed to match a test color, that is<br />
this primary has to be added to the test color to match the other two primaries. A similar method<br />
(matrixing) can be (and in fact it is) used in cameras (and in other input devices), but it cannot be<br />
used for imaging purposes. One possible solution is to select three primaries to minimize the amount<br />
of out-of-gamut colors and another solution is to increase the number of color primaries.<br />
Due to recent technological developments, unconventional (wide-gamut) 3-primary and multiprimary<br />
displays have gained much attention. However, the issue of selecting the number,<br />
chromaticity and luminance of the color primaries still needs a firm theoretical and practical basis in<br />
order to ensure that the most is gained by venturing the simplicity of using traditional primaries and<br />
traditional image rendering methods. The present article follows a more or less pragmatic approach<br />
based on several recent findings of color science to provide some guidelines to solve this issue.<br />
Figure 1 shows the traditional approach of color primary design based on the CIE1931xy<br />
chromaticity diagram. In this approach, the colors were to be covered (that is to be inside the triangle<br />
or polygon spanned by the primaries) in the chromaticity plane only, regardless of the lightness<br />
information of the test colors.<br />
Figure 1. Primaries of NTSC, PAL, Adobe RGB and sRGB systems<br />
In this work, we will show that two dimensional (2D) methods (i.e. using a chromaticity diagram)<br />
are not only inferior to 3D optimization (i.e. also using luminance information) but they can also be<br />
misleading.<br />
Concerning the present paper, we introduce a new 3D approach based on a cost function (CF) by<br />
which two sets of primaries can be compared. In this CF we include the result of our own recent<br />
psycho-physical experiment regarding the minimal visually acceptable lightness of color primaries,<br />
for different hues. We briefly describe this experiment in this paper. Then, we will show a method by<br />
which the minima of our CF can be found. This method results in ‘optimal’ color primaries, optimal<br />
stran 82 Posvetovanje “Razsvetljava 2006”
“Optimal Color Primaries for Three- and Multi-primary Wide Gamut Displays ” R-10<br />
in the sense of those factors that we found to be important enough to incorporate in our CF. We will<br />
also show several computational results of the optimization method i.e. several optimal primary sets.<br />
By formulating the cost function and by searching for the primary sets we hope to answer the<br />
following questions: what visual and technical factors do we have to consider in designing primary<br />
sets?; how many primaries do we have to use?; and what are the ‘optimal’ primaries?.<br />
2. Factors to set up the cost function and to design the optimal color<br />
primaries<br />
There are various factors to consider when designing a color primary set and we must find, select<br />
and use only those factors that are important and useful. We have to ignore those factors that are<br />
irrelevant and/or redundant. Below, a number of factors are listed and analyzed from this point of<br />
view. The source of these factors are papers of different approaches regarding color imaging, patents<br />
of various imaging devices and solutions, and the CIE TC 8-05 Technical Report [6].<br />
2.1 Volume ([6])<br />
The total volume of the color gamut in a perceptual color space (such as CIELAB or<br />
CIECAM02[7]) seems to be an obvious factor.<br />
However, the interpretation of an optimal gamut volume is not clear. While a large gamut is able<br />
to represent more colors, it remains a question what percent of all these colors will be actually used<br />
in the particular system, and, if quantization efficiency (see below) will be limited by an<br />
unnecessarily large gamut.<br />
2.2 Coverage<br />
The most important property of any primary set is to be able to represent the highest possible<br />
amount of colors of a so-called target color gamut. The usefulness of this criterion depends on the set<br />
of colors chosen that serves as the target color gamut.<br />
The coverage of the TCS may be interpreted in at least two different ways:<br />
Target gamut covered by the device gamut: This is the more important factor i.e. that percentage<br />
of the TCS that is covered by the device gamut. The testing of TCS coverage can be accomplished by<br />
computing the volume of the intersection of the convex hulls (see e.g. [11]) or by sampling the TCS<br />
and testing the device gamut for inclusion of the samples. The testing of TCS coverage has to be<br />
done in a perceptual color space such as CIELAB or CIECAM02 or CIECAM02-SCDUCS [12] by<br />
using a well chosen sample density.<br />
Device gamut used to cover the target gamut: This is the less important factor but it can still be<br />
interesting to check the device gamut in order not to ‘waste’ gamut for colors outside the TCS.<br />
“Lighting Engineering 2006” stran 83
R-10 “Optimalne osnovne barve za tri- in večbarvne ekrane s širokim barvnim obsegom”<br />
2.3 Quantization metrics ([6])<br />
Displays driven by digital signals unavoidably raise the issue of quantization. Though these<br />
metrics are not related so closely to the issue of color primaries, with careful co-optimization, they<br />
may have their value in the optimization process.<br />
2.4 Number of color primaries<br />
There are two qualitatively different issues that we must address when making a decision on the<br />
number of primaries: 1. using 3 or more primaries, and 2. if using more than 3, then how many of<br />
them shall be used.<br />
2.5 White Point<br />
Though it is possible to alter the white point of an existing device by scaling down certain<br />
primaries’ contribution to it, at the expense of the maximal brightness and gamut volume, it is<br />
obvious that the white point must lie in a certain color tolerance region. Both published [14] results<br />
and some of our own unpublished experimental results state that a white point around u’=0.1913<br />
v’=0.4591 can be considered as visually optimal, with a tolerance region around it in a perceptually<br />
uniform chromaticity diagram, e.g. CIE1976u’v’. This region defines the range of acceptable device<br />
white points. (Such a region can be seen in Figure 4.)<br />
2.6 Implementation constraints<br />
If the objective is not only a theoretically optimal color primary set but also the manufacturing of<br />
an actual device then technological constraints, such as the distance from the spectrum locus,<br />
maximal luminance values, and the chromaticities that are attainable by filtering a specific lamp used<br />
in the device, must be considered.<br />
2.7 P/W ratio<br />
In the case of traditional displays, the ratio of the luminance of the primaries (P) related to the<br />
luminance of the peak white (W), i.e. the so-called P/W ratio, was determined so that a desired white<br />
point resulted from the mixture of the primaries. Among the very first problems occurring with the<br />
introduction of wide gamut displays was the too low brightness of yellowish colors when the red and<br />
green primaries of higher excitation purity were introduced[5]. The answer was to introduce a further<br />
primary i.e. Yellow. But the introduction of an additional primary or additional primaries increased<br />
the number of those parts that the peak white luminance had to be partitioned to, and the P/W ratio<br />
became less than for the case of traditional 3P displays. This partitioning occurs in subpixel area or in<br />
time-slot length in actual devices. The P/W ratio can be an important factor to consider in the design<br />
of new wide-gamut color primary sets. Our own experimental results on the visually acceptable P/W<br />
ratios are described in Section 3.2.<br />
stran 84 Posvetovanje “Razsvetljava 2006”
“Optimal Color Primaries for Three- and Multi-primary Wide Gamut Displays ” R-10<br />
3. Implementation<br />
3.1 The Target Color Set<br />
According to the principles described in Section 2, a target color set (TCS) was constructed to be<br />
covered by the new color primary set during the computational optimization. The basis of this TCS<br />
was the sampled sum (union) of the SOCS database [10] under illuminant CIE D65, the Pointer<br />
surface colours database [9], plus the sRGB gamut using the complete lattice of DAC values in the<br />
gamma-linear model.<br />
Throughout the computations below the CIE1931 2 degree standard observer was being used[8].<br />
3.2 A psycho-physical experiment on visually acceptable P/W ratios<br />
As described in Section 2, a common complaint against multi-primary displays is that users<br />
perceive yellowish colors (or other colors) to be too “dim”. To express these subjective acceptability<br />
judgments in terms of luminance or CIECAM02 lightness (J), we carried out a psychophysical<br />
experiment i.e. a series of visual observations.<br />
In this experiment, an equi-distant sampling was carried out on a constant hue plane in the<br />
CIECAM02 (J,s,h) color space, and the observers were inquired if a displayed color sample was<br />
acceptable as a color primary of a display. Different values of saturation at a number of hues were<br />
investigated, finding the minimal lightness which was acceptable as a display primary.<br />
The samples were displayed by a special 4-primary device consisting of a traditional 3 primary<br />
DLP projector and an exchangeable fourth primary of a monochromatic source. The task of the<br />
observers was to set that minimal lightness (CIECAM02 J) of the sample at each value of saturation<br />
which was still acceptable as a display primary.<br />
Results showed that the minimal lightness – which is in fact conceptually very similar to the<br />
frequently used P/W ratio – appeared to be little influenced by the saturation of the sample and by the<br />
luminance level of the white background.<br />
It is clear that if we have to introduce more than three primaries in a device then we must make a<br />
compromise between satisfying the minimal lightness condition and several other factors.<br />
3.3 The Cost Function<br />
A cost function which describes a primary set was introduced. In this cost function some of the<br />
elements described in Section 2. are incorporated: TCS coverage, P/W ratio, white point criterion and<br />
technological constraints. Other factors are omitted because of their relatively low importance in this<br />
view.<br />
A cost function assigns a scalar to each primary set, which is specified by the XYZ coordinates of<br />
the primaries. The values of the cost function over the 3N dimensional parameter space are called the<br />
cost surface. The cost surface is a scalar field in the 3N dimensional space describing the ’goodness’<br />
of the 3N dimensional point consisting of the CIE1931XYZ coordinates of the N primaries: that is a<br />
primary set.<br />
The cost surface can be re-shaped by assigning different weights to the components with regards<br />
to the actual importance of the component.<br />
“Lighting Engineering 2006” stran 85
R-10 “Optimalne osnovne barve za tri- in večbarvne ekrane s širokim barvnim obsegom”<br />
The components are listed below.<br />
TCS (Test Color Sample) Coverage<br />
If we suppose that the device white point is a good approximation for “white” in any pictorial<br />
content displayed on the device (which is at least doubtful, see e.g. [15], but still the best<br />
approximation we have today) then it is quite straightforward to use a chromatic adaptation transform<br />
or a color appearance model in which coverage checking can be done.<br />
Assuming that the gamut of a device is topologically equivalent in the CIE1931XYZ tristimulus<br />
space and in the CIECAM02 (J,C,h) perceptual color space, and using the fact that the N color<br />
primaries span a regular polyhedron in the former space, a coverage checking algorithm was<br />
developed, which avoids the huge computational burden of building a convex hull [11] onto the<br />
lattice of DAC values of the n-primaries in each optimization step but still allows for chromatic<br />
adaptation to the white point of the device.<br />
P/W Ratio<br />
To include the resulting P/W curve (see Section 3.2) in the computational optimization procedure<br />
to find an optimal color primary set, we can add a P/W term to the cost function, e.g. by summing up<br />
the differences between the P/W values of the new display’s primaries and the minimal P/W curve.<br />
White Point Criterion<br />
According to the principles detailed in Section 2.5, a tolerance region was determined in the form<br />
of an ellipse which fits into the tolerance region of [14].<br />
Technological Constraint<br />
In order to point out interactions and trade-offs between the quality of the color gamut and its<br />
feasibility, a pseudo-technological constraint was introduced on the primaries: They had to be no<br />
closer to the spectrum locus than a given value, otherwise a term was added to the cost function<br />
which contained this distance in inverse proportion.<br />
3.4 The Optimizer<br />
Minima of the scalar cost function correspond to those sets of color primaries which are optimal<br />
in the sense as argued in Section 2.<br />
In the test implementation we used a 3N dimensional simplex method [16] to find the local<br />
minima of the cost function.<br />
To find local minima closer to the global minimum, multiple restarts were initiated starting from<br />
different points of the parameter space, from which the best was considered as the “optimal” primary<br />
set.<br />
stran 86 Posvetovanje “Razsvetljava 2006”
“Optimal Color Primaries for Three- and Multi-primary Wide Gamut Displays ” R-10<br />
4. Results and Discussion<br />
In this section, example optimum primary sets are shown resulting from running the optimizer<br />
program.<br />
The weights were tuned for the algorithm’s best performance in agreement with the empirical<br />
expectations towards a primary set i.e. that the TCS coverage is the most important issue, while P/W<br />
ratios are of less importance. Other parameters of the optimizer – such as its exit conditions and its<br />
random initialization – were fine-tuned throughout the development and running of the program.<br />
Two kinds of optimizations were carried out, for a three-, a four-, a five-, and a six-primary<br />
system, respectively: in Case I., the technological constraint (i.e. the S/L distance, see Section 3.3)<br />
was included, in Case II. it was turned off.<br />
Table 1 shows the parameters of the eight optimal color primary sets.<br />
Number of<br />
primaries<br />
TCS<br />
Coverage<br />
[%]<br />
Case I.<br />
White point<br />
u' v'<br />
Case II.<br />
White point<br />
TCS<br />
Coverage<br />
[%] u' v'<br />
3 92.70 0.1982 0.4515 97.15 0.1868 0.4426<br />
4 93.45 0.1947 0.4497 99.03 0.2014 0.4658<br />
5 92.80 0.1933 0.4555 98.96 0.1990 0.4618<br />
6 93.22 0.1877 0.4418 98.86 0.1904 0.4670<br />
Table 1. Parameters of the optimal color primary sets<br />
For comparison the TCS (the TCS defined in Section 3.1) coverage for some standard gamuts are<br />
presented in Table 2.<br />
TCS Coverage [%]<br />
sRGB 77.20<br />
NTSC 89.13<br />
Adobe RGB 86.44<br />
Table 2. Coverage of standard gamuts<br />
Comparing the values of TCS coverage with the loci of the primaries in the CIE1976u’v’<br />
chromaticity diagram reveals that the criteria defined in Section 3.3 for TCS coverage yield<br />
significantly different results as compared to those of the “traditional” (i.e. those found in literature)<br />
gamut evaluations that are carried out in the chromaticity diagram. Firstly, significant differences in<br />
the area of the orthogonal projection of the color gamut onto the chromaticity plane (which was a<br />
traditional descriptor) yield much smaller differences of TCS coverage as defined in Section 3.3.<br />
Secondly, the polygon line connecting the color primaries in ascending order of hue angle, shown in<br />
Figure 2 is concave for the optimal primary sets found in the 3 dimensional approach of the present<br />
work. This finding would be a nonsense according in a “traditional” two dimensional approach.<br />
“Lighting Engineering 2006” stran 87
R-10 “Optimalne osnovne barve za tri- in večbarvne ekrane s širokim barvnim obsegom”<br />
However, in three dimensions, a number of test-color samples of high lightness at the border of the<br />
gamut between two primaries can be covered by introducing an additional primary. Possibly this<br />
additional primary will be of lower saturation, in order not to modify the white point of the device<br />
with a high-chroma primary.<br />
Figure 2. Chromaticity diagram based (“traditional”) representation of the gamuts of the eight optimal<br />
color primary sets, Case I. (left) and Case II. (right)<br />
The primaries of the 3P systems satisfied the minimal lightness condition, which was defined in<br />
Section 3.3 in both cases (i.e. Case I. and Case II.), but the boundaries of the gamut fail to reach the<br />
minimal lightness level between 240 and 310 degrees (i.e. in the blue-magenta region) and slightly<br />
between 120 and 130 degrees (i.e. in the yellow-green region).<br />
In general, the primaries of both the 5P and the 6P systems fail to reach the required minimal<br />
lightness level, and the gamut shows deficiency in lightness in the same regions as the 3P system<br />
plus in the red region for the 5P system and almost everywhere for the 6P system.<br />
A supplementary run of the Optimizer Program showed that if the same weight was attributed to<br />
TCS coverage and P/W ratio checking, for the 5P system, the optimization yielded coverage values<br />
of 82-88% with primaries satisfying the minimal lightness condition. This means that there is a tradeoff<br />
between TCS coverage and P/W ratios which can be decided by considering the target of any<br />
actual device development and further visual experiments on user preference.<br />
The analysis of the gamut shape reveals that the 5P and 6P gamuts are able to render low<br />
lightness-high chroma samples, while 3P gamuts are better in representing high chroma-high<br />
lightness samples, and 4P systems are in between. Among the four tested primary sets (3P, 4P, 5P, 6P)<br />
the 4P system gives the highest TCS coverage in both cases. This is because a four primary system<br />
joins the flexibility of a multi-primary system with the fact that the 100-valued lightness (1-valued<br />
P/W) of the white point is distributed among only 4 primaries (see above).<br />
5 Conclusion<br />
A series of factors were listed which may be used as descriptors of a color primary set of a multi-primary<br />
display and by which factors two color primary sets can be compared.<br />
stran 88 Posvetovanje “Razsvetljava 2006”
“Optimal Color Primaries for Three- and Multi-primary Wide Gamut Displays ” R-10<br />
We constructed a scalar cost function from these factors and some novel experimental results with the<br />
matrix of the color primary set as the independent variable. We considered those primary sets for which<br />
this cost function was minimal as optimal in the sense of the definition of the cost function and the<br />
empirically determined importance of its components. This was expressed by attributing weights to the<br />
components. A comprehensive target color set (TCS) was compiled and sampled in a uniform color space<br />
(CIECAM02). An algorithm was developed to test TCS coverage in device context for sets of an arbitrary<br />
number of color primaries. Examples for the three-, four-, five- and six primary sets which were found to<br />
be optimal by the algorithm were presented. Our TCS chosen was found to be adequate.<br />
We found that the polygon line connecting the primaries in the chromaticity diagram is not necessarily<br />
convex and therefore, those optimizations that are carried out in the chromaticity diagram may be<br />
misleading. We found that four primary systems yielded the highest coverage, and, that by sacrificing a<br />
few percents of coverage, the criterion for the minimum acceptable P/W ratio of the color primaries can<br />
also be satisfied.<br />
REFERENCES<br />
[1] Zhang, X., Wandell, B. A., “A Spatial Extension of CIELAB for Digital Color Reproduction”, SID 96<br />
Digest, 731-735, (1996).<br />
[2] Fairchild, M. D., Johnson G. M., Kuang, J., Yamagutchi, H., “Image Appearance Modeling and High-<br />
Dynamic-Range Image Rendering”, Proc. of the ACM-SIGGRAPH First Symposium on Applied<br />
Perception in Graphics and Visualization, (2004).<br />
[3] Green, Ph., MacDonald, L., Colour Engineering, (Wiley and Sons, 2002), 297-314.<br />
[4] International Commission on Illumination, Colorimetry, 3rd Edition, Publication CIE 2004:15, (2004)<br />
[5] Roth, S., Ben-David, I., Ben-Chorin, M., Eliav, D., Ben-David, O., “Wide gamut, high brightness<br />
multiple primaries single panel projection displays”, SID 03 Digest, 10.2, (2003)<br />
[6] International Commission on Illumination, “Criteria for the Evaluation of Extended-gamut Color<br />
Encodings”, CIE Publication No. 16. (Draft), (2005)<br />
[7] Moroney, N., Fairchild, M. D, Hunt, R. W. G., Li, Ch., Luo, R. M., Newmann, T.: ”The CIECAM02<br />
Color Appearance Model”, Proc. of the IS&T/SID Tenth Color Imaging Conference, 23-27, (2002)<br />
[8] Wiszecki, G., Stiles, W., S., Color Science: Concepts and Methods, Quantitative Data and Formulae,<br />
(John Wiley & Sons, New York, 1982)<br />
[9] Pointer, M. R., “The Gamut of Real Surface Colours”, Color Research and Application, Vol. 5, No. 3,<br />
145-155, (1980)<br />
“Lighting Engineering 2006” stran 89
R-10 “Optimalne osnovne barve za tri- in večbarvne ekrane s širokim barvnim obsegom”<br />
[10] International Organization for Standardization: “Graphic technology - Standard object colour spectra<br />
database for colour reproduction evaluation (SOCS)”, ISO/TR 16066:2003, (2003)<br />
[11] O'Rourke, J., Computational Geometry in C, (Cambridge University Press, 1998)<br />
[12] Li, C., Luo, M. R., Cui, G. H., “Colour-Differences Evaluation Using Colour Appearance Models”,<br />
Proc. of the IS&T/SID Eleventh Color Imaging Conference, (2003)<br />
[13] Ohsawa, K., König, F., Yamaguchi, M., Ohyama, N., “Multi-primary display optimized for CIE1931<br />
and CIE1964 color matching functions”, Proc. of the SPIE, Volume 4421, 939-942, (2002)<br />
[14] Vogels, I. M. L. C., Heynderickx, I. E. J., “Optimal and Acceptable White-Point Settings of a<br />
Display”, Proc. of the IS&T/SID Twelfth Color Imaging Conference, 233-238, (2004)<br />
[15] M. D. Fairchild., “A Victory for Equivalent Background - On Average”, IS&T/SID 7th Color<br />
Imaging Conference, 87-92 (1999)<br />
[16] Press, W.H., Teukolsky, S.A., Vetterling W.T., Flannery, B.P., Numerical Recipies in C, (Cambridge<br />
University Press, 408-412, 1988)<br />
Avtorjev naslov / Authors’ address<br />
László BEKE, MSc.<br />
Virtual Environments and Imaging Technologies Laboratory,<br />
Department of Image Processing and Neurocomputing,<br />
Faculty of Information Technology,<br />
University of Pannonia<br />
H-8200 Veszprém, Egyetem u. 10.<br />
Hungary<br />
Tel.: +36 88 624 609<br />
Fax.: +36 88 624 606<br />
E-mail: beke@vision.vein.hu<br />
stran 90 Posvetovanje “Razsvetljava 2006”
“Typical Sky Luminance Patterns and Their New Standardisation…” R-11<br />
Richard Kittler<br />
TYPICAL SKY LUMINANCE PATTERNS AND THEIR NEW<br />
STANDARDISATION AS BASIS FOR DAYLIGHT CALCULATIONS<br />
Summary<br />
History of sky types used for daylight calculations and the new set of sky<br />
types standardised in the ISO and CIE General Sky. Definition of the luminance<br />
distribution on the sky vault by gradation and indicatrix functions with their<br />
influences on the parametrisation system. Links between sunlight and skylight<br />
conditions and possibilities to identify sky types when regular measurement data<br />
stored at IDMP stations are available. New possibilities to predict sky<br />
luminance glare, absolute interior illuminance levels instead of Daylight Factor<br />
criteria, as well as to model annual daylight profiles or year-round daylight<br />
changes.<br />
Povzetek<br />
Značilne porazdelitve svetlosti neba in njihova standardizacija kot osnova<br />
za izračune osvetljenosti z dnevno svetlobo; Na začetku članka je predstavljena<br />
zgodovina tipov porazdelitve svetlosti neba ter nov nabor tipov neba,<br />
uporabljen v ISO in CIE standardih. Sledi definicija porazdelitve svetlosti neba<br />
s pomočjo funkcije stopnjevanja svetlosti ter funkcije razpršenosti ter njun vpliv<br />
na določanje parametrov modela neba. Podana je tudi povezava med direktno<br />
sončno svetlobo in svetlobo neba ter možnosti za določitev ustreznega tipa neba<br />
na podlagi meritev svetlosti neba z IDMP postajami. Na koncu so podane nove<br />
možnosti za določevanje svetlosti neba, za izračun absolutne vrednosti<br />
osvetljenosti prostora namesto faktorja dnevne svetlobe ter za modeliranje<br />
sprememb dnevne svetlobe tekom celega leta.<br />
“Lighting Engineering 2006” stran 91
R-11 “Značilne porazdelitve svetlosti neba in njihova standardizacija kot osnova za izračune…”<br />
1 Introduction<br />
During your meetings in 2002 an interesting paper by Kobav and Bizjak, 2002 and last year by<br />
Kobav, 2005 were presented introducing the ISO, 2004 and CIE, 2003 Standard General Sky as well<br />
as the analysis of measurement results taken by the EKO sky scanner in Lyon. In addition to these<br />
some interesting historical basis and developments have to be explained with also recent alternative<br />
models of defining relative sky patterns and normal zenith luminance.<br />
2 The history of measurements and studies of sky luminance distributions<br />
The first possibilities for measuring sky luminance arose in the 18th century when Francoise<br />
Marie, 1700 invented a subjective luminance meter called „lucimeter“. It consisted of two internally<br />
black tubes covered on the downward side with a diffuse thin paper or glass (Figure 1). One was<br />
directed on the unknown bright target or light source, while the other usually horizontal tube faced<br />
the movable candle stand. The measurement of brightness or luminance followed the idea that an eye<br />
is very sensitive to instantly discern<br />
differences or equalities of close placed<br />
surfaces but due to adaptation no absolute<br />
luminance levels. The visual equality of both<br />
diffuse glasses had to be adjusted by the<br />
distance of the candle stand. However, the<br />
available candle sources were too week to<br />
rival very bright natural sources, e.g. as the<br />
sun, therefore several glasses, i.e. neutral<br />
filters had to be applied. Another trick was<br />
used by Bouguer, 1729 to measure the optical<br />
air mass of the ideally clear atmosphere<br />
substituting the sun by moon at the angular<br />
elevation 66°11“ and 19°16“ during the night<br />
23/24th November 1725. These elevations<br />
represented at the site in Le Croisic, near St.<br />
Figure 1: Schematic reproduction of Marie´s<br />
subjective lucimeter<br />
Nazaire, France the noon maximal summer<br />
and minimal winter solar solstice, which<br />
interested Bouguer, 1760 to define his law of<br />
light reduction after transmission through the<br />
atmosphere. Now, in modern terms it can be<br />
written for an absolutely dry and clear<br />
atmosphere either as the sunbeam extraterrestrial flux or illuminance on a fictitious plane placed<br />
normal to sunbeams:<br />
where is:<br />
F = Fo exp(- av m) (1)<br />
Fo<br />
av<br />
the light flux above the atmosphere equal to the extraterrestrial light solar constant<br />
LSC = 133.334 klx or klm/m 2 (Darula et al., 2005),<br />
luminous extinction coefficient of the Rayleigh (dry and clear) atmosphere, now<br />
taken after Clear, 1982 as<br />
stran 92 Posvetovanje “Razsvetljava 2006”
“Typical Sky Luminance Patterns and Their New Standardisation…” R-11<br />
av =<br />
1<br />
10. 1+ 0.<br />
045m<br />
(2)<br />
m<br />
relative optical air mass m was originally given in tables by Bouguer, 1729 later by<br />
Bemporad, 1904 for different solar altitudes γs, while now it is often taken after<br />
Kasten and Young, 1989 in the form of a general equation<br />
1<br />
m =<br />
sinγs<br />
+ 0.<br />
50572 γs<br />
+ 6.<br />
07995°<br />
( ) 1.<br />
6364<br />
(3)<br />
Table 1: Comparison of m values<br />
ALT<br />
Bouguer<br />
(1729)<br />
Bemporad<br />
(1904)<br />
Kasten-Young<br />
(1989)<br />
deg m m m<br />
0 35,50 35,40 37,92<br />
1 25,80 27,00 26,31<br />
2 19,00 19,80 19,43<br />
3 14,90 15,40 15,15<br />
5 10,20 10,40 10,31<br />
10 5,56 5,60 5,59<br />
15 3,81 3,82 3,81<br />
20 2,90 2,90 2,90<br />
30 1,99 1,99 1,99<br />
50 1,30 1,30 1,30<br />
In Table 1 are compared m values after all<br />
above authors and note that the old Bouguer´s<br />
data are remarkably precise.<br />
Nowadays parallel direct solar beam<br />
illuminance penetrating through the actual<br />
atmosphere and illuminating a horizontal surface<br />
Pv is related to the extraterrestrial horizontal Ev<br />
level<br />
Ev = LSC sin γs (4)<br />
Pv = Ev exp(-av m Tv) (5)<br />
where is«<br />
Tv the luminous<br />
turbidity of the real atmosphere<br />
expressed as a multiple of the dry<br />
and clear case.<br />
If global illuminance Gv and diffuse horizontal<br />
illuminance Dv are measured, then Pv/Ev =<br />
Gv/Ev - Dv/Ev and the luminous turbidity Tv in<br />
the direction of the sun beams can be calculated as<br />
ln(Pv / Ev)<br />
Tv =<br />
(6)<br />
av m<br />
70 1,06 1,06 1,06 Using Marie´s lucimeter Bouguer has measured<br />
also the luminance distribution on a clear sky<br />
90 1,00 1,00 1,00 several times, but he did not insert any measured<br />
data into his manuscript published unfortunately<br />
in 1760 after his death in 1758. However, in the<br />
text he mentioned that measuring sky luminance<br />
along the solar almucantar 15 or 20° above horizon he found minimal luminance placed about 110 to<br />
120° on the other side of the sun position, where the luminance is very high.<br />
At the same time Lambert, 1760 introduced under the impression of a fully overcast sky a<br />
mathematically simple assumption of a uniform unity luminance on the whole sky vault. This<br />
assumption was adopted in the criterion of the Daylight Factor (DF) which served for the assessment<br />
of interior daylighting until recently. Nevertheless Kähler, 1908 after luminance measurements on<br />
“Lighting Engineering 2006” stran 93
R-11 “Značilne porazdelitve svetlosti neba in njihova standardizacija kot osnova za izračune…”<br />
overcast skies in Kiel, Germany suggested to respect the gradual horizon-zenith changes expressed in<br />
his formula<br />
Lγ/Lh = 1 + 2 sin γ (7)<br />
where is:<br />
Lγ the sky luminance in an arbitrary sky element having the angular elevation γ,<br />
Lh luminance on the horizon.<br />
After similar measurements by Kimball and Hand (1921) in Washington the same formula was<br />
recommended by Moon and Spencer (1942) for standardisation in the form normalised to zenith<br />
luminance, later adopted by CIE (1955)<br />
Lγ/Lz = (1 + 2 sin γ)/3 (8)<br />
After Ralph Hopkinson proposal at the CIE TC/E 3.2 for Daylight meeting the present author was<br />
asked in 1964 to prepare the standardisation of relative luminance distribution on a clear sky. Studies<br />
by Pokrowski (1929) and by Boldyrev (1935) have shown the combination of the gradation and<br />
indicatrix functions, the latter having a better approximation proposed by Krat (1943) with<br />
parameters defined by turbidity (Kittler, 1985). After a proposal by Kittler (1967), further discussions<br />
and amendments this system of standardisation<br />
was adopted by CIE (1973).<br />
More sophisticated daylight measurements<br />
initiated by CIE in 1991 for the International<br />
Daylight Measurement Programme (IDMP) with<br />
regular 1-minute data of global and diffuse data as<br />
well as zenith luminance and additional luminance<br />
scans of the sky have brought many new<br />
information and possibilities of analysis, e.g. on<br />
the indicatrix (Kittler, 1969, 1993) and gradation<br />
characteristics (Kittler et al., 1998), as well as<br />
other data (Kittler et al., 1992) etc.<br />
Nowadays several quite sophisticated<br />
luminance scanners can be used to measure the<br />
sky luminance distribution, e.g. the German<br />
Krochmann or the Japanese EKO (Figure 2)<br />
scanners are the more frequent scanners applied in<br />
Figure 2: EKO sky luminance scanner<br />
the IDMP network, (Ineichen and Molineaux,<br />
1994).<br />
3 Current sky luminance models and further progress<br />
The current ISO,2004/CIE,2003 standardise the relative luminance distribution of 15 sky types<br />
normalised to zenith luminance with specified gradation ϕ(Z)/ϕ(0°) and indicatrix functions<br />
f(χ)/f(Zs), which define the ratio of luminance L in any sky element to the zenith luminance Lz, i.e.<br />
stran 94 Posvetovanje “Razsvetljava 2006”
“Typical Sky Luminance Patterns and Their New Standardisation…” R-11<br />
( ) ( )<br />
L f χ ϕ Z<br />
=<br />
Lz f ( Zs) ϕ( 0°<br />
)<br />
(9)<br />
Several authors have many some trial to apply these functions to develop different sky models in<br />
terms of absolute sky luminance patterns either derived from direct and global measured irradiance<br />
(e.g. Perez et al.., 1991 in the so called „All weather model“) or from illuminance levels (e.g. Igawa<br />
et al., 1997 with 20 sky models). However, besides the relative relation (9) also further<br />
parametrisation was found defining the relation between zenith luminance Lz and horizontal sky<br />
illuminance Dv and if these are regularly measured, Lz/Dv is a parameter for selecting the sky type<br />
as<br />
Lz<br />
Dv<br />
=<br />
π/2<br />
2π<br />
Z= 0∫α<br />
= 0<br />
∫<br />
ϕ(0 ° ) f(Zs)<br />
[ (Z)f( ) sinZ cosZ ]<br />
ϕ χ dZ dα<br />
where all angles and parameters to calculate both functions including coefficients a, b, c, d and e<br />
are given in ISO,2004/CIE,2003. However, the Lz/Dv ratio after eq. (10) has a special meaning as a<br />
selection or identifying parameter valid for any solar altitude after Figure 3, which is very useful also<br />
for the determination of zenith luminance in absolute units. In the original study by Kittler et al.,<br />
(1997) also an approximation of eq.(10) was proposed for solar altitudes under 75 degrees a special<br />
attention should be given to very high solar altitudes in tropics (Darula et al, 2006) when the original<br />
eq. (10) with the integration has to be adopted.<br />
While this standard is introducing 15 sky types with specific and defined quasi-homogeneous<br />
luminance gradations and scattering indicatrices, Perez et al (1993) and Igawa et al. (2004) have<br />
chosen a different approach. Under the assumption that irradiance data are more often and world-<br />
(10)<br />
Lz/ Dv<br />
0,5<br />
Sky standards :<br />
I.1<br />
0,4<br />
I.2<br />
II.1<br />
II.2<br />
III.1<br />
0,3 III.2<br />
III.3<br />
III.4<br />
0,2 IV.3<br />
IV.2<br />
IV.4<br />
V.4<br />
V.5<br />
VI .5<br />
0,1<br />
VI .6<br />
0 10 20 30 40 50 60 70<br />
Solar altitude in deg.<br />
Figure 3: Lz/Dv ratios for different sky types calculated using eq. (10) and an approximation<br />
formula after Kittler et al., 1998.<br />
“Lighting Engineering 2006” stran 95
R-11 “Značilne porazdelitve svetlosti neba in njihova standardizacija kot osnova za izračune…”<br />
wide available from the meteorological network both latter models apply such data transformed by<br />
disputable luminous efficacies to get either absolute illuminance or even luminance quantities. So<br />
using eq.(9) to derive gradation and indicatrix coefficients applying different rather complex<br />
procedures and normalisation via:<br />
- Perez´s sky clearness ε and sky brightness ∆,<br />
- Igawa´s clear sky index Kc and cloudless index Cle.<br />
Thus specific varying values of coefficients a, b, c, d, and e after measured or expected global<br />
and diffuse irradiance under certain solar altitudes are determined and can have arbitrary values<br />
differing from those in the ISO/CIE Standard.<br />
4 Absolute zenith luminance models<br />
As the ISO/CIE Standard defines the distribution of luminance on the sky vault only on relative<br />
terms, i.e. normalised by zenith luminance it is sometimes needed to determine its value in absolute<br />
cd/m 2 units.<br />
In computer programs for each sky type can be inserted also the calculation of the absolute zenith<br />
luminance in cd/m 2 using eq. (10) as:<br />
Lz<br />
=<br />
π/2<br />
2π<br />
Z= 0∫α<br />
= 0<br />
∫<br />
ϕ(0 ° ) f(Zs)<br />
(Dv/Ev) LSC sin γs (11)<br />
ϕ χ dZ dα<br />
[ (Z)f( ) sinZcosZ ]<br />
which might be written in a shorter version also as:<br />
Lz = (Lz/Dv)(Dv/Ev) LSC sin γs<br />
(11a)<br />
where Dv/Ev is in fact expressing the overall transmittance of diffuse skylight through the<br />
atmosphere and under certain conditions and sky types can be assumed or predetermined. Also the<br />
current state of art enables to identify sky patterns either directly by sky-scan measurements or with<br />
regard to measured Lz/Dv ratios, thus absolute sky luminance or resulting global and diffuse<br />
horizontal illuminance can be determined in real cases.<br />
Although Igawa et al. (2004) paper is aware of the importance of the Lz/Dv ratio in an earlier<br />
paper (Igawa et al. (1999) a simplifying approximation formula is proposed to calculate absolute<br />
zenith luminance in cd/m 2 in dependence on the normalised global illuminance Nevg:<br />
Lz = exp(Ai Nevg 5 + Bi Nevg 4 + Ci Nevg 3 + Di Nevg 2 + Ei Nevg + Fi) (12)<br />
where Nevg is normalised global illuminance defined as:<br />
Nevg = (m Gv)/( LSC Evgms) (13)<br />
Evgms is a standard relative global illuminance under a CIE Clear sky with a luminous<br />
transmittance 0.75 approximated by a regression equation:<br />
Evgms = -0.323 γs 4 + 1.486 γs 3 - 2.581 γs 2 + 2.09 γs + 0.19 (14)<br />
stran 96 Posvetovanje “Razsvetljava 2006”
“Typical Sky Luminance Patterns and Their New Standardisation…” R-11<br />
Lvz in kcd/m 2<br />
20<br />
15<br />
10<br />
5<br />
Lvz= 54.65 Dv/Ev sin γs<br />
Selected data recorded at Bratislava 5-mi data, 1994-1998<br />
under I.1 sky without sunshine within Dv/Ev range ± 0.025:<br />
Dv/Ev = 0.05<br />
= 0.10<br />
= 0.15<br />
= 0.20<br />
= 0.25<br />
= 0.30<br />
Dv/Ev = 0.30<br />
0.25<br />
0.20<br />
0.15<br />
0.10<br />
0.05<br />
0<br />
10 20 30 40 50 60<br />
Solar altitude γ s<br />
Figure 4: Total number of 9716 cases were identified in the range of SSLD I.1 which<br />
validate the Lz, Dv/Ev and γs interdependence.<br />
Ai = 18.373 γs + 9.955 (15)<br />
Bi = -52.013 γs - 37.766 (16)<br />
Ci = 46.572 γs + 59.352 (17)<br />
Di = 1.691 γs 2 - 16.498 γs - 48.67 (18)<br />
Ei = 1.124 γs + 19.738 (19)<br />
Fi = 1.17 ln(γs) + 6.369 (20)<br />
The easiest way to validate formula (12) is to test it under the three overcast standard skies:<br />
- SSLD I.1 or sky type 1 which has a constant ratio Lz/Dv = 0.4083,<br />
- SSLD II.1 or sky type 3 which has a constant ratio Lz/Dv = 0.361,<br />
- SSLD III.1 or sky type 5 which has a constant ratio Lz/Dv = 1/π = 0.31831.<br />
Two logic questions can be posed:<br />
- How come that a darker overcast sky, i.e. I.1 has a brighter zenith luminance that a uniform<br />
overcast sky (III.1) ?<br />
- Is it possible that three sky types that have different gradations have after Igawa et al., the same<br />
zenith luminance when producing the same diffuse illuminance ?<br />
It is evident that due to the luminance pattern of the sky I.1 its zenith luminance has to be higher<br />
than on the sky III.1 where the constant luminance of the whole sky is the same, when both these<br />
skies have to yield the same resulting skylight illuminance on an unobstructed exterior horizontal<br />
surface. This fact does not take into account Igawa´s approximation eq. (12), which assumes to be<br />
valid for all sky types. However, if different sky types are based on gradation and indicatrix<br />
differences, then their zenith luminance has to differ especially due to angular distance between the<br />
sun position and zenith as expressed by the Lz/Dv ratio under different sky types depending on<br />
sunheight (see Figure 3).<br />
“Lighting Engineering 2006” stran 97
R-11 “Značilne porazdelitve svetlosti neba in njihova standardizacija kot osnova za izračune…”<br />
In reality under each sky type a range of Dv/Ev ratios can occur but for simplicity sake can be<br />
taken rounded relevant values 0.1, 0.2, 0.3 and 0.4 for comparison in Table 2.<br />
Table 2: Comparison of zenith luminance in cd/m 2 after Igawa 1999 and Kittler et al.1998<br />
Igawa SSLD I.1<br />
γs Dv/Ev Dv/Ev<br />
0,1 0,2 0,3 0,4 0,05 0,1 0,2 0,3<br />
5 415 700 628 461 237 474 949 1423<br />
10 733 1439 1511 1242 473 945 1891 2836<br />
15 974 2067 2430 2216 705 1409 2818 4227<br />
20 1196 2624 3309 3242 931 1862 3724 5586<br />
25 1420 3155 4155 4278 1150 2301 4601 6902<br />
30 1655 3689 4992 5327 1361 2722 5444 8166<br />
35 1902 4240 5842 6405 1561 3123 6245 9368<br />
40 2164 4813 6718 7532 1750 3499 6999 10498<br />
45 2439 5411 7629 8729 1925 3850 7699 11549<br />
50 2725 6031 8583 10014 2085 4170 8341 12511<br />
55 3019 6669 9580 11406 2230 4459 8919 13378<br />
60 3319 7323 10625 12922 2357 4715 9429 14144<br />
65 3622 7990 11718 14577 2467 4934 9868 14802<br />
SSLD II.1 SSLD III.1<br />
γs Dv/Ev Dv/Ev<br />
0,1 0,2 0,3 0,4 0,1 0,2 0,3 0,4<br />
5 420 839 1259 1678 370 740 1110 1480<br />
10 836 1672 2507 3343 737 1474 2211 2948<br />
15 1246 2492 3737 4983 1098 2197 3295 4394<br />
20 1646 3292 4939 6585 1452 2903 4355 5806<br />
25 2034 4068 6102 8137 1794 3587 5381 7174<br />
30 2407 4813 7220 9626 2122 4244 6366 8488<br />
35 2761 5522 8282 11043 2434 4869 7303 9737<br />
40 3094 6188 9282 12376 2728 5456 8184 10912<br />
45 3403 6807 10210 13614 3001 6002 9003 12004<br />
50 3687 7374 11061 14749 3251 6502 9753 13004<br />
55 3943 7886 11828 15771 3476 6953 10429 13906<br />
60 4168 8337 12505 16673 3675 7351 11026 14702<br />
65 4362 8725 13087 17449 3846 7693 11539 15386<br />
stran 98 Posvetovanje “Razsvetljava 2006”
“Typical Sky Luminance Patterns and Their New Standardisation…” R-11<br />
20<br />
15<br />
Lvz= 42.59 Dv/Ev sin γs<br />
Selected data recorded at Bratislava 5-mi data, 1994-1998<br />
under III.1 sky without sunshine within Dv/Ev range ± 0.025:<br />
Dv/Ev=0.10<br />
=0.30<br />
0.40<br />
=0.15<br />
=0.35<br />
0.35<br />
Lvz in kcd/m 2<br />
10<br />
5<br />
=0.20<br />
=0.25<br />
=0.40<br />
0.30<br />
0.25<br />
0.20<br />
0.15<br />
0.10<br />
0<br />
10 20 30 40 50 60<br />
Solar altitude γ s<br />
Figure 5: Total number of 5777 cases were identified in the range of SSLD III.1 which<br />
validate the Lz, Dv/Ev and γs interdependence.<br />
Of course as under all these selected sky types no sunlight is expected:<br />
Gv = Dv = LSC (Dv/Ev) sin γs,<br />
thus e.g. for I.1 or sky type 1: Lz = 0.4083 x 133 334 Dv/Ev sin γs (21)<br />
or for III.1 or sky type 5 Lz = 0.3183 x 133 334 Dv/Ev sin γs (22)<br />
To test these interrelations also measured data based on Bratislava 5-minute records during 5 year<br />
1994-98 were used earlier (Darula and Kittler, 2004). Separately but simultaneously measured Lz<br />
and Dv values were selected and groups in bins Dv/Ev as shown in Figure 4 under sky I.1 and in<br />
Figure 5 under sky III.1 compared to calculated Lz after eq. (21) and (22).<br />
Similarly it is possible to test Lz values for any standard sky without or with direct sunlight (when<br />
Gv = Dv + Pv) under different turbidity Tv and Dv/Ev ratios respecting the interrelation of Dv/Ev<br />
and Tv after Darula and Kittler, (2005):<br />
where is:<br />
Dv/Ev = [(A1 Tv + A2) sin γs + 0.7(Tv + 1)X + 0.04 Tv]/[B X + E sin γs] (23)<br />
X = (sin γs) C /(cos γs) D<br />
all parameters A1, A2, B, C, D and E for each sky type with sunlight are in Table 2 in<br />
Kittler et al.(1998) or Darula and Kittler, (2005), Table 1.<br />
It has to be noted that absolute zenith luminance cannot be determined without either measured<br />
diffuse/global illuminance or presumed Dv/Ev ratios under overcast and cloudy skies or luminous<br />
“Lighting Engineering 2006” stran 99
R-11 “Značilne porazdelitve svetlosti neba in njihova standardizacija kot osnova za izračune…”<br />
turbidity levels Tv allowing to calculate interrelation of Pv and Dv illuminances under sunny<br />
conditions.<br />
Although the Tv and Dv/Ev interdependence results in some complexity also the measured 5 year<br />
Bratislava data (Darula and Kittler, 2005) have shown that absolute Lz values can be predetermined<br />
after the general formula (11a).<br />
If luminance scan data are also available there is a possibility to analyse these using the method<br />
recommended by Tregenza, 2004.<br />
5 Conclusions<br />
A set of standard sky types covering the whole practical range of occurrence enables:<br />
- to calculate zenith luminance and exterior illuminances under various sky types,<br />
- to model daylight climate in any place world-wide,<br />
- to simulate annual profiles or daily changes of sky patterns,<br />
- to specify sky luminance distribution in solid angles of windows in any time and orientation,<br />
- to assess possible ranges of window luminance for glare studies,<br />
- to apply sky types in various computer programs, e.g. as ModelSky., SkyModeller, Virtual<br />
Sky Domes etc.<br />
The current computer possibilities enable to work out sophisticated user-friendly programs<br />
respecting local situations world-wide as well as arbitrary window and interior dimensions to<br />
calculate the skylight illuminance quite easy and quickly.<br />
The next paper by my colleague Dr. Darula will explain and show one of the possible methods<br />
and a simple user-friendly computer tool to predetermine interior illuminance from windows.<br />
Acknowledgement<br />
This study is summarising partial results elaborated under the support of the Slovak grant VEGA<br />
2/5093/5 and with thanks for the cooperation under the bilateral Slovak-Czech project SK- CZ-<br />
11006.<br />
REFERENCES<br />
Bemporad, A. (1904), Mitteilung der Grossh. Sternwarte Heidelberg, B.4.<br />
Boldyrev, N.G. (1935), O raspredelenii jarkosti po nebu. Svetotekhnika, 6, 16-18.<br />
Bouguer, P. (1729), Essai d´Optique sur la gradation de la lumiére.Claude Jombert, Paris.<br />
Bouguer, P. (1760), Traité d´Optique sur la gradation de la lumiére. Paris. Rusian translation by N.A.<br />
Tolstogo a P.P.Feofilova: Optièeskij traktat o gradacii sveta. Izd. AN SSSR, Moskva 1950.<br />
Clear, R.(1982), Calculation of turbidity and direct sun illuminance. Memo to Daylight Group, LBL<br />
Berkeley, Cal.,.<br />
Commission Internationale de l´Éclairage (1955), Natural Daylight. Official Recommendation. Compte<br />
Rendu CIE 13. Session, 2, part 3.2, pp.2-4, Central Bureau CIE, Paris.<br />
stran 100 Posvetovanje “Razsvetljava 2006”
“Typical Sky Luminance Patterns and Their New Standardisation…” R-11<br />
Commission Internationale de l´Éclairage (1973), Standardisation of luminance distribution on clear<br />
skies. CIE Publ. No. 22, Central Bureau CIE, Paris.<br />
Commission Internationale de l´Éclairage, CIE (2003), Spatial distribution of daylight - CIE Standard<br />
General Sky. CIE Standard S 011/E:2003, CIE Central Bureau, Vienna.<br />
Darula, S. - Kittler, R. (2004), New trends in daylight theory based on the ISO/CIE sky standard. 1.<br />
Zenith luminance on overcast skies. Build.Res. Journ., 52, 3, 181-197.<br />
Darula, S. - Kittler, R. - Gueymard, Ch.A.(2005), Reference luminous solar constant and solar luminance<br />
for illuminance calculations. Solar Energy, 79, 559-565.<br />
Darula, S. - Kittler, R. (2005), New trends in daylight theory based on the ISO/CIE sky standard. 3.<br />
Zenith luminance formula verified by measurement data under cloudless skies. Build.Res. Journ., 53, 1,<br />
9-31.<br />
Darula S. - Kittler, R. - Wittkopf, S.(2006), Outdoor illuminance levels in the tropics and their<br />
representation in the Virtual Sky Dome. Archit. Science Review, in print.<br />
Igawa, N. - Nakamura, H. - Matsuzawa, T. - Koga, Y. - Goto, K. - Kojo S. (1997), Sky luminance<br />
distribution between two CIE standard skies. Proc. Lux Pacifica, pp. E7 - E18.<br />
Igawa, N. - Nakamura, H. - Matsuura, K. (1999), Sky luminance distribution model for simulation of<br />
daylight environment. Proc. Build. Simulation ´99, Vol. 2, 977 - 982.<br />
Igawa, N. - Koga, Y. - Matsuzawa, T. - Nakamura, H. (2004), Models of sky radiance distribution and sky<br />
luminance distribution. Solar Energy, 77, 137 - 157.<br />
Ineichen, P. - Molineaux, B. (1994), Characterisation and comparison of two sky scanners: PRC<br />
Krochmann and EKO instruments. Broad-band visible and radiation data acquisition and analysis. IEA<br />
Techn.Rep. of task 17, p.5-1-8, ASRC, Albany, N.Y.<br />
International Standard Organisation ISO (2004), Spatial distribution of daylight - CIE Standard General<br />
Sky. ISO Standard 15469:2004.<br />
Kasten, F., Young, A.T.(1989), Revised optical air mass tables and approximation formula. Appl. Optics,<br />
28, 22, pp. 4735-4738.<br />
Kähler K.(1908), Flächenhelligkeit des Himmels and Beleuchtungsstärke in Räumen. Meteor. Zeitschrift,<br />
25, 2, 52-57.<br />
Kimball, H.H. - Hand I.F.(1921), Sky brightness and daylight illumination measurements. Monthly<br />
Weather Review, 49, 9, 481- 488.<br />
Kittler, R. (1967), Standardisation of the outdoor conditions for calculation of the Daylight Factor with<br />
clear skies. Sunlight in Buildings, Bouwcentrum, Rotterdam, 273-286.<br />
Kittler, R. (1969), A simple method of measuring and evaluating the atmospheric diffusion of sunlight<br />
when seeking the typical luminance patterns of the clear sky. Symposium on environmental physics as<br />
applied to buildings in the tropics. vol. II, D1-14. Roorkee, U. P., India.<br />
Kittler, R. (1985), Luminance distribution characteristics of homogeneous skies: a measurement and<br />
prediction strategy. Light. Res. and Technol.,17, 4, 183-188.<br />
Kittler, R. Mikler J.(1986), Základy využívania slnečného žiarenia. (Basis of the utilisation of solar<br />
radiation, in Slovak), VEDA, Bratislava.<br />
Kittler, R., Hayman, S., Ruck, N., Julian, W.( 1992), Daylight measurement data: Methods of evaluation<br />
and representation. Light. Res. and Technol., 24, 4, 173-187.<br />
Kittler, R.(1993), Relative scattering indicatrix: Derivation from regular radiance/luminance sky scans.<br />
Light. Res. and Technol., 25, 125-127.<br />
“Lighting Engineering 2006” stran 101
R-11 “Značilne porazdelitve svetlosti neba in njihova standardizacija kot osnova za izračune…”<br />
Kittler, R. - Perez, R. - Darula S.( 1998), A set of standard skies characterising daylight conditions for<br />
computer and energy conscious design. Final Rep.US-SK grant 92 052, 240 pp., also partly published as<br />
A set of standard skies. Polygrafia SAV Bratislava.<br />
Krat, V.A. (1943), Indikatrisa rasseyaniya sveta v zemnoy atmosfere. Astron. zhurnal, 20, 5-6.<br />
Kobav, M. – Bizjak, G. (2002), Predlog CIE standarda za prostorsko porazdelitev dnevne svetlobe – CIE<br />
standardno nebo. Proc. Razsvetljava 2002, Laško.<br />
Kobav, M. (2005), Določanje CIE tipa neba na podlagi meritev poprazdelitve svetlosti. Proc. Razsvetljava<br />
2005, Postojna.<br />
Lambert J. H. (1760), Photometria sive de mensura et gradibus luminis, colorum et umbrae. Klett Verlag,<br />
Augsburg. German translation by E. Audinga: Lambert´s Photometrie. Verlag Engelmann, Leipzig 1892.<br />
Marie, F. (1700), Nouvelle découverte sur la lumiére. Pour la mesurer & en compter les degrés. Luis<br />
Sevestre, Paris.<br />
Moon P. - Spencer D.E.(1942), Illumination from a non-uniform sky. Illum.Eng., 37, 10, 707-726.<br />
Perez, R. - Seals, R. - Michalsky, J. (1991), An all weather model for sky luminance distribution. Solar<br />
Energy, 50, 3, 235 - 245.<br />
Pokrowski, G.I. (1929), Über die Helligkeitsverteilung am Himmel. Phys. Zeitschr., 390, 20, 697-700.<br />
Tregenza, P.R. (2004), Analysing sky luminance scans to obtain frequency distributions of CIE Standard<br />
General Skies. Light. Res. and Technol.,36, 4, 271-281.<br />
Avtorjev naslov / Author’s address:<br />
Richard Kittler, DrSc.<br />
Institute of Construction and Architecture, Slovak Academy of Sciences<br />
SK –845 03 Bratislava, Dubravska cesta 9<br />
Slovakia<br />
Tel.: +421 2 5930 9267<br />
Fax: +421 2 5477 3548<br />
Email: usarkit@savba.sk<br />
stran 102 Posvetovanje “Razsvetljava 2006”
“Calculation of window luminances and sky illuminance …” R-12<br />
Stanislav Darula<br />
CALCULATION OF WINDOW LUMINANCES AND SKY ILLUMINANCE IN<br />
SIDE-LIT WORKING PLACES<br />
Summary<br />
The typical sky luminance distribution patterns for practical illuminance and<br />
luminance calculations were derived and adopted by ISO in the ISO/CIE<br />
15469:2004 General Sky Standard. All the 15 sky types result different<br />
luminances in the window solid angle depend on the sun position, sunshine<br />
presence or absence when it is cover by clouds as well as on the optical<br />
properties of the atmosphere. The algorithm for calculation of sky luminances in<br />
cd/m2 and sky illuminance on the working plane is presented together with the<br />
user friendly program called MAMmodeller, which allows calculation of<br />
window luminance map on-line on the address http://www.cadplan.com.au. The<br />
use of this program will be presented with examples of side-lit working places in<br />
different situations.<br />
Povzetek<br />
Izračun svetlosti neba in osvetljenosti na delovnih mestih ob oknu; Pri<br />
praktičnih izračunih osvetljenosti in svetlosti v prostorih, osvetljenih z okni si<br />
lahko pomagamo z porazdelitvijo svetlosti neba, ki je definirana v standardu<br />
ISO/CIE 15469:2004 in ki navaja 15 različnih tipov neba. Pri izračunu svetlosti<br />
dela neba, ki ga vidimo skozi okno moramo upoštevati ustrezen tip neba po<br />
standardu, položaj sonca, prisotnost ali odsotnost direktne sončne svetlobe, ki je<br />
odvisna od oblačnosti neba ter optične lastnosti atmosfere. V članku je<br />
predstavljen algoritem za izračun svetlosti neba v cd/m 2 ,ki ga vidimo skozi okno<br />
ter za izračun osvetljenosti delovne površine, ki jo to okno osvetljuje.<br />
Predstavljen je tudi program MAMmodeller, ki omogoča izračun svetlosti dela<br />
neba, vidnega skozi okno in ki je dostopen na spletni strani<br />
http://www.cadplan.com.au. Uporaba programa je prikazana s primerom<br />
osvetljenosti delovnega mesta z oknom pri različnih pogojih.<br />
“Lighting Engineering 2006” stran 103
R-12 “Izračun svetlosti neba in osvetljenosti na delovnih mestih ob oknu”<br />
1 Introduction<br />
Figure 1: Scheme of meridians at the window edges<br />
Recently Kobav and Bizjak,<br />
2005 introduced a new substitute<br />
method to calculate indoor<br />
daylight illluminance under new<br />
standard sky types. In this paper<br />
the standard approach of<br />
calculation is shown using the<br />
already published MAM method<br />
(Kittler and Darula, 2006). Using<br />
this approach Prof. Roy et al.,<br />
2006 developed a user friendly<br />
computer program for WWW side<br />
MAMmodeller. In spite of the fact<br />
that description of the<br />
MAMmodeller is still in print this<br />
paper would like to introduce<br />
internet on line possibility of<br />
calculation.<br />
2 Principle MAM relations<br />
The Method of Aperture Meridians defines a sequential set of meridians within the window solid<br />
angle and allows to calculate elementary luminances in angular steps along each meridian for a<br />
chosen sky type (Figure 1). To estimate the sunlight and skylight interdependence in any location<br />
with regard to the orientation of the assessed interior, the building site and window parameters have<br />
to be stated in input of the CADPLAN system, see Figure 2.<br />
The geometry of space is defined in Cartesian coordinates using window plane as a reference.<br />
The sun position as well as normal of the window plane are orientated to North direction. On the sky<br />
dome with a chosen sky pattern are projected the window edges and a luminance map seen through<br />
the window opening.<br />
Using a relevant point on the working plane either the sky luminance map seen from this point<br />
can be read or interior sky illuminance in lux can be found .<br />
3 The MAMmodeller package and its use<br />
The user friendly package is containing several possibilities to calculate either window<br />
luminances or interior absolute luminance under all CIE standard skies when the user´s control panel<br />
is filled in as follows:<br />
‣ Time and location setting<br />
Actual location of the side has to be defined by geographical latitude φ and longitude λ, e.g. for<br />
Ljubljana φ = 46˚13´ N, λ = 14˚29´ E. When choosing date/time (e.g. 12 th October at 10:15) for the<br />
required assessment these will be inserted automatically and solar altitude γs = 35.91˚ and azimuth<br />
As = 168.48˚ will be shown on Figure 3.<br />
‣ Sky information<br />
The selected sky from the fifteen CIE standards is chosen by its SSLD number with a possibility<br />
to define either Dv/Ev ratio for situations without sun (sky type numbers 1 - 6) or Luminous turbidity<br />
stran 104 Posvetovanje “Razsvetljava 2006”
“Calculation of window luminances and sky illuminance …” R-12<br />
Figure 2: MAMmodeller home page<br />
Figure 3: The input data form<br />
“Lighting Engineering 2006” stran 105
R-12 “Izračun svetlosti neba in osvetljenosti na delovnih mestih ob oknu”<br />
factor Tv for sunny situations (sky type numbers 7 - 12). When onla luminance distribution in<br />
relative terms are required then these parameters are not valid.<br />
‣ Window geometry<br />
Window dimensions have to be inserted in appropriate boxes with window orientation and exterior<br />
obstruction elevation as well as the placement of the point on the working plane. Simultaneously the<br />
transmission of the window glazing or the blind can be put in. In the example on Figure 3 are displayed<br />
the inserted window (2.1m x 2.1m on a 1m sill) and obstruction dimensions 8˚ etc.<br />
‣ Display settings<br />
These can allow the user to choose:<br />
- luminance values within the window to be in relative or absolute terms in cd/m 2 ,<br />
- various images of luminance maps, e.g. shaded or contoured with either linear or<br />
logarithmic scales,<br />
- if the window orientation is toward the sun this can be displayed also by a yellow spot.<br />
An example of input form for chosen working place in Ljubljana is presented in Figure 3.<br />
Luminance map for the Example in two alternatives is in Figure 4 and 5 with statistics report in Table 1.<br />
Figure 4: Smooth luminance map for the example<br />
Figure 5: The same with a blind to reduce sun<br />
glare but transmitting 70 %<br />
Exterior Conditions:<br />
SSLD No = 11 Sun Altitude = 35.91 Sun Azimuth = 168.48<br />
Tv = 4.0<br />
Zenith Luminance (Lz) = 3 462 [cd/m2]<br />
Dv = 18 514 [lux]<br />
Pv = 39 657 [lux]<br />
Gv = 58 170 [lux]<br />
Lz/Dv ratio = 0,187<br />
Interior conditions:<br />
Window: width = 2.1 height = 2.1 sill level = 1.0 azimuth = 160.0<br />
Interior Point: from window = 3.0 centre offset = 0.3 level = 0.85<br />
External obstruction: altitude angle = 8.0<br />
Sky Illuminance at Point in room = 2 188 [lux] Sky Illuminance at Point in room =1 790 [lux]<br />
Table 1: Example of the statistics report<br />
stran 106 Posvetovanje “Razsvetljava 2006”
“Calculation of window luminances and sky illuminance …” R-12<br />
Figure 6: Same as Figure 4 but with stepped<br />
luminance map and sampling points<br />
with absolute luminances<br />
Figure 7: Same as Figure 5 but with contoured<br />
luminance map and sampling points<br />
with absolute luminances<br />
If a user wishes he can select also the stepped or contoured luminance map images as shown on<br />
Figure 6 and 7. There are also possibilities to retain the chosen luminances in sampling point, e.g. at<br />
window corners or on its centerline, the luminance contours can be either in linear or logarithmic<br />
scaling etc.<br />
A summary of calculation results are collected in the so called Statistics Report (e.g. in Table 1)<br />
where in the last line is the interior sky illuminance at the chosen point of the working plane in lux.<br />
4 Total illuminance in a specific point of the working plane<br />
Having the illuminance produced by the sky luminance seen through the window it is necessary<br />
to determine also the illuminance contribution caused by reflected light from exterior or interior<br />
surfaces. The interreflection conditions are usually very complex but for rough linear approximation<br />
a quite simple relation can be recommended:<br />
Ei = Es (1 + 1.368 ρ a ) (1)<br />
where is:<br />
Ei<br />
Es<br />
ρ a<br />
the total interior illuminance in lx,<br />
sky illuminance,<br />
average reflection factor for all interior surfaces.<br />
This formula is restricted for side-lit interiors regular in plan with only one window and without exterior<br />
obstructions.<br />
5 Conclusions<br />
After the recent international standardisation of sky types the new Method of Aperture Meridians<br />
was developed as well as its implementation in new computer package MAMmodeller. Thus it<br />
“Lighting Engineering 2006” stran 107
R-12 “Izračun svetlosti neba in osvetljenosti na delovnih mestih ob oknu”<br />
provides designers with a simple and easy tool accessible on the WWW page<br />
(http://www.cadplan.com.au ) for a quick assessment of daylight conditions under various sky<br />
standards. Also specific localities with their characteristic weather conditions can be simulated close<br />
to reality and different cloudiness and atmospheric properties can be considered.<br />
Acknowledgement<br />
This paper was elaborated under the support of the Slovak grant VEGA 2/5093/5 and with thanks<br />
for the cooperation under the bilateral Slovak-Czech project SK- CZ-11006.<br />
REFERENCES<br />
Kittler, R. - Darula, S., The method of aperture meridians: a simple calculation tool for applying<br />
the ISO/CIE Standard General Sky. Light Res. Technol., 38, (2), p.109 – 122, 2006.<br />
Kobav M.B. - Bizjak G., Developing substitutive light source for indoor daylight calculations.<br />
Proc. Lux Europa 2005, 238 – 241, Berlin 2005.<br />
Roy, G. G. - Kittler, R. - Darula, S., An implementation of the Method of Aperture Meridians for<br />
the ISO/CIE Standard General Sky. Light Res. Technol., in print.<br />
Roy, G. G. - Kittler, R. - Darula, S., MAMmodeller, http://www.cadplan.com.au, (cited 2005).<br />
Avtorjev naslov / Author´s address:<br />
Stanislav Darula<br />
Institute of Construction and Architecture, Slovak Academy of Sciences<br />
SK 845 03 Bratislava, Dubravska cesta 9<br />
Slovakia<br />
Tel.: +421 5930 9267<br />
Fax: +421 5447 73548<br />
Email: usarsdar@savba.sk<br />
stran 108 Posvetovanje “Razsvetljava 2006”
“Outdoor Work Place Lighting According to EN 12464-2 …” R-13<br />
Axel Stockmar<br />
OUTDOOR WORK PLACE LIGHTING ACCORDING TO<br />
EN 12464-2 / CIE S 015<br />
Summary<br />
The draft European Standard prEN 12464-2 “Lighting of Outdoor Work<br />
Places” specifies the lighting requirements for the lighting of tasks in most<br />
outdoor work places and their associated areas in terms of quantity and quality.<br />
Furthermore the standard sets limits of obtrusive light for exterior lighting<br />
installations which are based on publication CIE 150:2003. Lighting levels are<br />
given in terms of average maintained illuminances of task and surrounding<br />
areas. For the calculation of illuminances and uniformities the maximum grid<br />
cell sizes can be evaluated using a formula which takes into account the actual<br />
dimensions of the area under consideration. The glare directly from the<br />
luminaires of an outdoor lighting installation is determined using the CIE Glare<br />
Rating (GR) method according to publication CIE 112:1994.<br />
Povzetek<br />
Razsvetljava delovnih mest na prostem v skladu s standardom EN 12464-2<br />
/ CIE S 015; Predlog evropskega standarda prEN 12464-2 »Razsvetljava<br />
delovnih mest na prostem« specificira svetlobne zahteve za razsvetljavo delovne<br />
naloge na večini delovnih mest oziroma delovnih področij na prostem tako<br />
kvantitativno kot kvalitativno. Poleg tega standard postavlja tudi meje za<br />
vsiljeno svetlobo, ki jo povzroča zunanja razsvetljava in ki temeljijo na CIE<br />
150:2003 dokumentu. Svetlobne zahteve so podane v obliki srednje vzdrževane<br />
osvetljenosti področja delovne naloge in njene okolice. Standard podaja tudi<br />
izraz, s pomočjo katerega je možno določiti največjo še ustrezno velikost mreže<br />
za izračun srednje osvetljenosti ter njene enakomernosti in ki upošteva dejanske<br />
dimenzije obravnavanega področja. Neposredno bleščanje svetlobnih virov pa<br />
se po standardu določi s pomočjo metode CIE indeksa bleščanja po publikaciji<br />
CIE 112:1994.<br />
“Lighting Engineering 2006” stran 109
R-13 “Razsvetljava delovnih mest na prostem v skladu s standardom EN 12464-2…”<br />
1 Introduction<br />
The draft European Standard prEN 12464-2 “Lighting of Outdoor Work Places” [1] specifies the<br />
lighting requirements for the lighting of tasks in most outdoor work places and their associated areas<br />
in terms of quantity and quality. Despite of different normative references this standard is identical<br />
with the CIE Standard S 015 “Lighting of Outdoor Work Places” [2].<br />
These standards specify lighting requirements for outdoor work places which meet the needs for<br />
visual comfort and performance; they do not specify lighting requirements with respect to safety and<br />
health of workers at work, although the lighting requirements as specified usually fulfil safety needs.<br />
2 Lighting Design Criteria<br />
The main parameters determining the luminous environment are the luminance distribution, the<br />
illuminance level and uniformity, the limitation of glare, the directionality of light (modelling), the<br />
colour appearance and colour rendering, and the degree of flicker [1][2].<br />
The luminance distribution in the filed of view controls the adaptation level of the eyes. A well<br />
balanced luminance distribution (sudden changes should be avoided) is needed to increase the visual<br />
acuity, the contrast sensitivity, and the efficiency of the ocular functions.<br />
The illuminance and its distribution (on task and surrounding area) have a great impact on how<br />
quickly, safely, and comfortably a person perceives and carries out a visual task. The illuminance<br />
values specified in the standards [1][2] are maintained illuminances over the task area on the<br />
reference surface, which may be horizontal, vertical or inclined. The task area is defined as the<br />
partial area in the work place in which the visual task is carried out. For places where the size and/or<br />
the location of the task area are unknown, the area where the task may occur is the task area. The<br />
maintained illuminance of the surrounding area shall be related to the maintained illuminance of the<br />
task area and should provide a well-balanced luminance distribution in the field of view. For task<br />
area illuminances of 100 lx or above the illuminances of the surrounding area are specified as four<br />
steps down on the recommended scale of illuminances which was taken from the European standard<br />
EN 12665 “Basic terms and criteria for specifying lighting requirements” [3]. The surrounding area<br />
is regarded as a strip surrounding the task area in the field of view; the width of this strip should be at<br />
least 2 m.<br />
Alongside the average maintained illuminances specified for a large number of areas, tasks and<br />
activities there are also requirements given concerning uniformities (minimum/average) and<br />
diversities (minimum/maximum) [1][2] for task and surrounding areas. For the calculation and<br />
verification of illuminance values (minimum, average, maximum) a grid system has to be used which<br />
is based on a formula giving the maximum grid cell size dependent on the area dimensions. This<br />
formula is equivalent to the equation given in the European standard EN 12193 “Sports lighting” [4].<br />
The colour qualities of near-white lamps are characterised by the colour appearance of the lamp<br />
(warm, intermediate, cool) and the colour rendering capabilities expressed in terms of the general<br />
colour rendering index R a . This methodology is the same as used for the lighting of indoor work<br />
places [5]. For the recognition of safety colours the light sources shall have a minimum colour<br />
rendering index of 20; for specific tasks, areas or activities requirements are given in the schedule of<br />
lighting requirements [1][2].<br />
To highlight objects, to reveal textures or to improve the appearance of people (“modelling”)<br />
directional lighting may be suitable. Modelling is the balance between diffuse and directional light;<br />
too directional lighting will produce harsh shadows. Lighting from specific directions may reveal<br />
stran 110 Posvetovanje “Razsvetljava 2006”
“Outdoor Work Place Lighting According to EN 12464-2 …” R-13<br />
details within a visual tasks, increase their visibility and making the task easier to perform.<br />
Unfortunately there are no measures given in the standards [1][2], only verbal descriptions.<br />
3 Evaluation of Glare<br />
Glare is the sensation produced by bright areas within the field of view and my be experienced<br />
either as discomfort or disability glare [1][2]. The glare directly from the luminaires of an outdoor<br />
lighting installation shall be determined using the CIE Glare Rating (GR) method according to CIE<br />
publication 112:1994 [6]. For a given observer position and a given viewing direction (2º below the<br />
horizontal) the degree of glare is dependent on the equivalent veiling luminance produced by the<br />
luminaires and the equivalent veiling luminance produced by the environment in front of the<br />
observer. The veiling luminance caused by the lighting installation is calculated according to the<br />
Holloday formula. The veiling luminance of the environment is approximated; i.e. it is assumed to be<br />
3.5 % of the average luminance of the area under considerations [6]. If no particular observer<br />
positions and viewing directions are specified, the glare rating should be computed at the illuminance<br />
grid positions at 45º intervals radially about the grid points with the 0º direction parallel to the long<br />
axis of the task area [1][2].<br />
4 Obtrusive light<br />
Obtrusive light is defined as light, outside the area to be lit, which, because of quantitative,<br />
directional, or spectral attributes in a given context, gives rise to annoyance, discomfort, distraction<br />
or a reduction in the ability to see essential information. The time after which stricter requirements<br />
(for the control of obtrusive light) will apply, often a condition of use of lighting applied by a<br />
government controlling authority, e.g. the local government, is called curfew [1][2][7]. To safeguard<br />
and enhance the night time environment it is necessary to control obtrusive light which can present<br />
physiological and ecological problems to surroundings and people. To evaluate the effects of<br />
obtrusive light from outdoor lighting installations the methods described in CIE Publication<br />
150:2003 [7] have been included in the standards [1][2] for the lighting of outdoor work places. For<br />
the different environmental zones E1 to E4, i.e. natural, rural, suburban, and urban, limits are<br />
specified for pre- and post-curfew hours in terms of maximum vertical illuminances on properties, of<br />
maximum luminous intensities of individual light sources into potentially obtrusive directions, of<br />
maximum average luminances of facades and signs, and of maximum upward light ratios.<br />
Furthermore the maximum values of threshold increments for users of nearby roads are considered.<br />
5 Lighting requirements for areas, tasks, and activities<br />
In the schedule of the lighting requirements a large number of areas, tasks, and activities are<br />
listed including airports, building and industrial sites, harbours, parking areas, petrochemical<br />
industries, power and water plants, railways, saw mills, and shipyards [1][2]. For the specific areas,<br />
tasks, and activities requirements are given in terms of average maintained illuminances,<br />
uniformities, glare rating limits, and colour rendering indices. An additional column contains advice<br />
and footnotes for exceptions and special applications for situations listed, e.g. diversity requirements<br />
for railway and tramway lighting [1][2]. As the recommended illuminances for the tasks are given as<br />
maintained illuminances the design should take into account an appropriate maintenance factor. The<br />
“Lighting Engineering 2006” stran 111
R-13 “Razsvetljava delovnih mest na prostem v skladu s standardom EN 12464-2…”<br />
maintenance factor to be applied depends on the characteristics of the lamp and control gear, the<br />
luminaire, the environment, and on the maintenance programme. For the elaboration of a<br />
maintenance schedule it is recommended to follow the methods described in the CIE guide on the<br />
maintenance of outdoor lighting systems [8].<br />
REFERENCES<br />
[1] prEN 12464-2: “Light and lighting, lighting of work places – Part 2: Outdoor work places”, 2003<br />
[2] CIE Standard S 015 “Lighting of Outdoor Work Places”, Vienna, 2005<br />
[3] EN 12665 “Light and lighting – Basic terms and criteria for specifying lighting requirements”,<br />
2002<br />
[4] EN 12193 “Light and lighting – Sports lighting”, 1999<br />
[5] EN 12464-1: “Light and lighting, lighting of work places – Part 1: Indoor work places”, 2003<br />
[6] “Glare evaluation system for use within outdoor sports and area lighting”, CIE Publication 112,<br />
Vienna, 1994<br />
[7] “Guide on the limitation of the effects of obtrusive light from outdoor lighting installations”,<br />
CIE Publication 150, Vienna, 2003<br />
[8] “The maintenance of outdoor lighting systems”, CIE publication154, Vienna, 2003<br />
Avtorjev naslov / Authors’ address:<br />
Axel Stockmar, Dipl.-Ing..<br />
LCI Light Consult International<br />
Lindenallee 21A<br />
D-29227 Celle<br />
Tel.: +49 (0) 5141 83069<br />
Email: a.stockmar.lci@t-online.de<br />
stran 112 Posvetovanje “Razsvetljava 2006”
“Public Lighting, How and Why ” R-14<br />
Peter Raynham<br />
PUBLIC LIGHTING, HOW AND WHY<br />
Summary<br />
Lighting for pedestrians and motorists has developed in different ways<br />
producing different lighting solutions for each type of road user. This paper<br />
reviews the current basis for road lighting and looks at the ways that the<br />
limitations in the current design guidance can be overcome.<br />
Povzetek<br />
Javna razsvetljava, kako in zakaj; Razsvetljava za pešce in voznike<br />
motornih vozil se je razvijala po različnih poteh in pripeljala do različnih<br />
rešitev za razsvetljavo enih in drugih uporabnikov cest. Članek podaja<br />
trenutno veljavne osnove za načrtovanje cestne razsvetljave ter nakazuje<br />
možne načine, kako preseči omejitve v trenutno veljavnih priporočilih.<br />
“Lighting Engineering 2006” stran 113
R-14 “Javna razsvetljava, kako in zakaj”<br />
1. Introduction<br />
Public lighting in town centres and along roads is now taken for granted. However, there is a<br />
dichotomy in the way public lighting has evolved and is specified: lighting for drivers is specified<br />
in terms of luminance whilst lighting for pedestrians is specified in terms of illuminance. The<br />
object of this paper is to review the research that underpins current road lighting practice for<br />
pedestrians and motorists and to examine the validity of the current road lighting standard 1 .<br />
2. Lighting for Motorists<br />
The starting point for lighting for motorists was the work carried out by Blackwell 2 and<br />
Weston 3 . They studied various visual tasks and came up with the basic rules of task performance.<br />
They discovered that the ability to do a task was based on task size, task luminance and the<br />
luminous contrast of the task against its background.<br />
The ideas of task performance were carried over into road lighting research. Early<br />
experiments in road lighting research reported in de Boer’s book 4 were about putting visual tasks<br />
on a road surface and using the ability of observers to do the tasks as a metric of the quality of the<br />
lighting. After a certain amount of research a standard task was used. It was a 200mm square<br />
having a contrast with respect to the road surface of 0.33 and placed on the road 100m away from<br />
the observer. This task was used to develop the current road lighting recommendations.<br />
Road lighting is currently specified using the following parameters:<br />
• Average Luminance (L Av )<br />
• Overall Uniformity of luminance (minimum / average) (U O )<br />
• Longitudinal Uniformity of luminance (minimum / maximum)(U L )<br />
• Threshold Increment (TI%)<br />
• Surround Ratio (SR)<br />
The parameters all have a role in ensuring the lighting quality for the driver. Visual<br />
performance is governed by L Av and U O . The ability to see an object on the road is a function of<br />
luminance on the darkest part of the road. The performance is also reduced by the disability glare<br />
– TI.<br />
The combination of these parameters used on a road is taken from one of the ME classes<br />
specified in the European standard for road lighting.<br />
stran 114 Posvetovanje “Razsvetljava 2006”
“Public Lighting, How and Why ” R-14<br />
Luminance of the road surface of the<br />
carriageway for the dry road surface condition<br />
Disability<br />
glare<br />
Lighting of<br />
sroundings<br />
Class<br />
L in cd/m 2<br />
[minimum<br />
maintained]<br />
Uo<br />
[minimum]<br />
UI<br />
[minimum]<br />
TI in %1)<br />
[maximum]<br />
SR2)<br />
[minimum]<br />
ME1 2,0 0,4 0,7 10 0,5<br />
ME2 1,5 0,4 0,7 10 0,5<br />
ME3a 1,0 0,4 0,7 15 0,5<br />
ME3b 1,0 0,4 0,6 15 0,5<br />
ME3c 1,0 0,4 0,5 15 0,5<br />
ME4a 0,75 0,4 0,6 15 0,5<br />
ME4a 0,75 0,4 0,5 15 0,5<br />
ME5 0,5 0,35 0,4 15 0,5<br />
ME6 0,3 0,35 0,4 15 no requirement<br />
1) An increase of 5 percentage points in TI can be permitted where low luminance light sources are used.<br />
2) This criterion may be applied only where there are no traffic areas with their own requirements adjacent to<br />
the carriageway.<br />
Table 1 The Luminance Requirements Table (Table 1a) from EN 13021-2<br />
Table 1 gives all the necessary information to design road lighting for motorised traffic in a<br />
wide variey of conditions. The hardest task for the lighting designer is to select the appropriate<br />
class from the table.<br />
There are however a number of potential problems with this principle of road lighting which<br />
may mean this method of lighting is sub-optimal. The problems are:<br />
• Road lighting is based on 200 mm square task, on the road surface, 100 m away<br />
from the observer. Is this the most relevant task for typical driving conditions?<br />
• Road lighting is based only on detecting objects by luminous contrast; what might<br />
be the impact of colour contrast?<br />
• What is the effect of vehicle headlights on the lighting?<br />
• Is longitudinal uniformity the best parameter to use if it is wished to improve<br />
driver comfort?<br />
An exploration of the problems associated with the above bullet points has been previously<br />
published in a paper in 2004 5 . There is also one further problem with the current way that road<br />
lighting is defined. As the task for which the lighting is designed is a small task directly ahead of<br />
the driver then it is only the centre of the visual field that is used to carry out the task. The central<br />
region of the eye, the fovea, is different from the rest of the retina in that it only contains cones<br />
and not a mix of rods and cones.<br />
“Lighting Engineering 2006” stran 115
R-14 “Javna razsvetljava, kako in zakaj”<br />
The cones in the eye are responsible for vision at high light levels (above 3cdm -2 ). There are 3<br />
types of cone, each sensitive to a different set of wavelengths of light and in combination they<br />
give rise to colour vision. The combined sensitivity of the cones gives rise to the photopic<br />
function which is the basis of the lumen. In low light conditions (below 0.003 cdm -2 ) it is the rods<br />
that are responsible for vision. There is only one type of rod cell so colour vision is not possible<br />
at low light levels. The sensitivity of the rods gives rise to the scotopic function, this function<br />
shows a greater response at the blue end of the visible spectrum as compared with the photopic<br />
function. Road lighting provides a visual environment that is between the photopic and scotopic<br />
levels, the so called mesopic region. In the region the eye is in an intermediate state and it is<br />
normal to model the response of the eye as a combination of photopic and scotopic response<br />
functions. So typically one would expect a slight shift to the blue end of the spectrum in the<br />
sensitivity.<br />
There have been a large number of experiments to determine if this shift happens, and it has<br />
been established for a series of off axis tasks. This finding has potential importance for road<br />
lighting. If it is important for drivers to use peripheral vision then it will be necessary to consider<br />
the use of blue rich light sources. The problem is that because road lighting is based on the<br />
assumption that the critical task for drivers is the ability to see small sections of the road a long<br />
way ahead of them rather that a true analysis of the visual tasks involved in driving there is no<br />
way of knowing the importance of the colour of the light source.<br />
3. Lighting for Pedestrians<br />
The development of lighting for pedestrians has been based on a series of studies that have<br />
been carried out into the needs of road users. It is much easier to do experiments with people<br />
walking than it is to experiment with cars. Moreover, the visual needs of pedestrians are in many<br />
ways easier to meet that those of motorists. Just walking along a footpath is easy in visual terms<br />
you need less than 1 lux on the path to see where you are putting your feet, however, there are a<br />
whole series of issues that are important to pedestrians. These tasks may be broken down in a<br />
number of ways but perhaps the best is that discussed by Jones 6 . Jones divided the requirements<br />
of the pedestrian as follows:<br />
• Safe movement<br />
• Visual orientation<br />
• Visual comfort<br />
• Facial recognition<br />
• A general feeling of safety<br />
Clearly these factors interact, for example if facial recognition is easy then according to van<br />
Bommel and Caminada 7 a feeling of security may be induced. Moreover, a lighting system that<br />
helps meet one of the above requirements of pedestrians is also likely to help with the others.<br />
However, it is worth looking at how lighting can help meet each of these requirements separately<br />
in order to understand the total set of requirements placed upon a lighting installation.<br />
stran 116 Posvetovanje “Razsvetljava 2006”
“Public Lighting, How and Why ” R-14<br />
3.1 Safe Movement<br />
The amount of light needed for safe movement is relatively low as the visual tasks in walking<br />
along a road are limited to checking for obstacles on the footpath and getting information about<br />
orientation and position. In order to judge the illuminance necessary to walk and avoid obstacles<br />
a number of authors refer to emergency lighting documents such as the current European Standard<br />
on Emergency Lighting 8 as a source of guidance on how much light is needed for safe movement.<br />
The current European Standard requires 1 lx minimum on the centre of an escape route. This<br />
value is perhaps somewhat on the high side for street lighting as it was designed for use at a time<br />
when a building is being evacuated and there may be some level of panic.<br />
3.2 Visual Orientation<br />
Orientation is achieved if pedestrians can identify features of the environment and from them<br />
deduce their location and thus plan their route. In residential areas orientation is relatively easy as<br />
the majority of the pedestrians will be familiar with the area and so large objects such as houses<br />
and trees can serve as land marks and provide pedestrians with all the information that they need<br />
to work out where they are. In town centres it should be assumed that people are less familiar with<br />
their surroundings and thus it is important to provide signage giving directions and street names<br />
and directions. Illuminance on vertical surfaces, particularly signs, is important in revealing the<br />
forms of features and thus helps the process of orientation.<br />
3.3 Visual Comfort<br />
Visual comfort is generally related to the absence of glare. However there are many ways that<br />
glare may manifest itself and glare may also be important in reducing the visibility of objects. The<br />
current European Standard on Road Lighting 9 uses 3 metrics of glare:<br />
• Threshold Increment (TI) Ti is the measure of glare usually used for roads<br />
designed for motorised traffic. However, as it is a measure of how much visibility<br />
has been lost due to glare it may be used by lighting researchers as a metric for<br />
glare. For example Rombauts et al 10 used typical values of TI on streets to correct<br />
their findings.<br />
• Luminous intensity classes are a means used to restrict glare and spill light from<br />
road lighting installations. They are a simple set of restrictions on the relative<br />
output of luminaires at high angles. As such they provide a means of controlling<br />
luminaire output and reducing the glare that may be caused. However, there is<br />
very little research that links these limits to any measurable glare phenomenon.<br />
Table 2 listing the classes is taken from the current European Standard on Road<br />
Lighting 9<br />
“Lighting Engineering 2006” stran 117
R-14 “Javna razsvetljava, kako in zakaj”<br />
• Glare Index Classes – various formulae have been derived by researchers for the<br />
evaluation of discomfort glare. The formulae all involve the luminance and the area of<br />
the light source. The area of the source is important because larger sources of low<br />
luminance cause less glare the smaller sources of higher luminance. The formula now<br />
adopted in the European Standard is:<br />
GI =<br />
I<br />
A<br />
Where GI is the glare index, I the intensity of the maximum source between elevation<br />
angles of 85 and 90 degrees and A is the luminous area of the source in the direction of<br />
the Intensity.<br />
Glare is a highly complex phenomena, that is generally split into 2 categories namely<br />
disability and discomfort glare. Disability glare happens when the glare makes it harder to see<br />
things and thus visibility is reduced. It therefore easy to research the impact of disability glare<br />
using vision tests. TI is the metric used to control disability glare and it well researched and the<br />
meaning and impact is well understood. Discomfort glare is a subjective impression that is<br />
formed of the lit environment and so it is far harder to characterise the exact circumstances that<br />
give rise to discomfort. For this reason the formula behind glare index classes is not well tested.<br />
Some authors 11,12 , have extended the concept of visual comfort to include a large number of<br />
other features of the visual environment raging from the modelling of peoples faces to nature of<br />
the light source and the extent to which light penetrates into private houses. Hargroves 11<br />
developed some of these ideas into the concept of “pleasantness” and then derived<br />
recommendations for lighting systems for shopping centres to achieve pleasantness.<br />
3.4 Facial Recognition<br />
It has long been established people like to maintain a personal space around themselves. The<br />
basic ideas of personal spaces were developed by Edward Hall 13 and he categorised the personal<br />
spaces around a person into intimate (up to 0.5 m), personal (up to 1.2m) and social consultative<br />
(up to 3m). Space outside this area was termed public space. Hall discussed the importance of<br />
stran 118 Posvetovanje “Razsvetljava 2006”
“Public Lighting, How and Why ” R-14<br />
these zones to people and why people felt uncomfortable with letting strangers entering their<br />
personal spaces. Van Bommel and Caminada used the basic ideas of Hall to explain why<br />
pedestrians at night did not like coming too close to people they did not recognise and thus<br />
realised the importance of facial recognition. van Bommel and Caminada 7 came up with the<br />
criterion that the lighting should be such as to permit the recognition of a face at a distance of 4m.<br />
They then went on to establish that semi-cylindrical illuminance on a persons face was the best<br />
measure of lighting in order to determine how easy it was to recognise their face. The link<br />
between facial recognition and semi-cylindrical illuminance has also been tested by a number of<br />
other researchers. In a review of a number of studies van Bommel 14 found that the relationship<br />
between facial recognition distance and semi-cylindrical illuminance was basically sound,<br />
however, it was found to be the case that when light incident from behind formed a significant<br />
part of the semi-cylindrical illuminance the facial recognition distance was shorter than expected.<br />
van Bommel suggested the solution would be to adopt a truncated form of semi-cylindrical<br />
illuminance.<br />
Many researchers 10,15 , looking at recognition distance found that older people need more light<br />
to be able to recognise a face at a given distance. Also Raynham and Saksvikrønning 15 found that<br />
the colour rendering of the light is important, a source of low colour rendering (Ra20) giving the<br />
same recognition distance as source of high colour rendering (Ra80) but with only half the<br />
illuminance.<br />
3.5 A General Feeling of Safety<br />
Van Bommel and other researchers 6,7 , argue that facial recognition is one of the key ways to<br />
promote a feeling of safety, however, feelings of safety and fear are dependant on factors other<br />
than the lighting and a study by Boyce et al 16 in areas of New York City and Albany showed that<br />
in general the greater the amount of light provided by the greater the feeling of safety. Analysis of<br />
the experimental findings also revealed that in general men felt safer than women. The difference<br />
in sense of safety was also found by Mansfield and Raynham 17 who also found that older people<br />
felt less safe than young people.<br />
Boyce’s study also looked at a series of car parks in Albany and compared the feeling of safety<br />
during the day and at night. In all cases he found that people felt safer during the day. Moreover,<br />
he was able to relate the change in the feeling of safety between day and night to illuminance at<br />
night, the higher the illuminance the less the change in feeling of safety.<br />
Boyce’s study assessed feelings of safety and compared them to the horizontal illuminance at<br />
the site. However, at all of the sites he used he also measured the vertical illuminance in 4<br />
different directions. He found that as most of the sites he visited had similar lighting installations<br />
in terms of the mounting height and spacing of the luminaires and thus the ratios between the<br />
horizontal and vertical illuminance values were fairly constant. This is perhaps a weakness of the<br />
study as while it tells us that more light will improve a sense of security we do not know which<br />
metric of the lighting that is the most important.<br />
The main factor working against a feeling of safety is a fear of crime. Fear of crime is a very<br />
complex phenomenon that is only loosely related the risk of being a victim of crime. For example<br />
Raynham and Gardner 18 found that young men were many times more likely to be victims of<br />
crime than old ladies, however, their fear of crime was much less.<br />
In some instances fear of crime and crime are related. Painter and Farrington 19 found that good<br />
street lighting reduced the amount of crime; in fact they were able to establish that the cost saved<br />
“Lighting Engineering 2006” stran 119
R-14 “Javna razsvetljava, kako in zakaj”<br />
by the community in one year from reduced crime was greater than the cost of installing the new<br />
lighting system. Whilst they did not come to a conclusion as how this effect was created, one of<br />
the plausible explanations was that good lighting reduced the fear of crime and thus more people<br />
used the streets at night, thus making it harder to commit a crime unobserved.<br />
In general lighting can help reduce the fear of crime, however there are some cases where<br />
lighting alone may not have any effect on the felling of safety. Painter and Farrington reported<br />
that lighting has little effect in areas of low crime and Raynham and Gardner 19 found that in an<br />
area where there was a perceived threat from you people hanging around, extra lighting did<br />
nothing to reduce the perceived fear of crime.<br />
3.6 Lighting for Pedestrians Standards and Practice<br />
It is common practice to design lighting for pedestrians in terms of horizontal illuminance,<br />
with the S classes of EN 13201-2 being the most common set of criteria used for the designs.<br />
However, reviewing the research it is often vertical or semi-cylindrical illuminance that seems to<br />
be the important factor in satisfying the needs of the pedestrian. This fact has often been looked<br />
at by researchers such as Jones 6 and Hargroves 11 . Their findings have been that they found that<br />
horizontal illuminance whilst not a perfect metric for the lighting in most cases functioned well<br />
and provided a means to easily describe the impact of the lighting. This finding is not surprising<br />
as most lighting schemes have similar geometries in terms of the mounting height and spacing of<br />
the lanterns and so one would expect a series of fixed ratios between the horizontal and vertical<br />
components of illuminance.<br />
4. Conclusion<br />
The development of road lighting for pedestrians has followed a different path to lighting for<br />
motorists. For motorists some fundamental assumptions were made about the visual tasks<br />
involved in driving and following on from this it was possible to develop some precise metrics to<br />
control the lighting.<br />
Lighting for pedestrians has been developed by trying to understand the needs of pedestrians<br />
and developing metrics of lighting that correspond to these needs. This has lead to a series of<br />
different requirements for pedestrian lighting. Current lighting practice does not exactly meet<br />
these needs, rather an approximate method of design is used, whilst this is not ideal it provides<br />
reasonable results in most cases.<br />
Now that it is becoming more important to restrict the amount of energy used in street lighting<br />
it is important to optimise the way street lighting is designed. For highway lighting this means<br />
finding out what are the safety critical visual tasks that drivers have to do and for pedestrian<br />
lighting changing the way lighting is designed so that the visual needs of pedestrians can be met<br />
exactly.<br />
stran 120 Posvetovanje “Razsvetljava 2006”
“Public Lighting, How and Why ” R-14<br />
1 EN 13201 Road Lighting parts 2 - 4 and CEN/TR 13201-1 Road Lighting Selection of lighting classes<br />
2 Blackwell, H. R., Specification of interior illumination levels, Illum Engng, 54, 317, 1959<br />
3 Weston, H. C., Industrial Health Research Report 87, London HMSO 1945<br />
4 de Boer J. B. ed Public Lighting, Philips Technical Library, Eindhoven, 1967<br />
5 Raynham P., An examination of the fundamentals of road lighting for pedestrians and drivers, Lighting<br />
Research and Technology, 36(4) 2004, pp 307 - 316<br />
6 Jones G. A subjective assessment of residential road lighting, CIBSE National Lighting conference 1996<br />
7 Van Bommel W. J. M., Caminada E., Considerations of the lighting of residential areas for non-motorised<br />
traffic, CIBSE National Lighting Conference 1982<br />
8 EN 1838:1999, Lighting applications. Emergency lighting<br />
9 EN 13201-2 2003 Road lighting – Part 2: Performance requirements<br />
10 Rombatus P., Vandewyngaerde H., & Maggetto G. Minimum semi-cylindrical illuminance and modelling<br />
in residential area lighting, Lighting Research & Technology 21(2) 49-55 (1989)<br />
11 Hargroves R., Lighting for Pleasentness Outdoors, CIBSE National Lighting Conference 2001<br />
12 Rombatus P., Vandewyngaerde H., & Maggetto G. Minimum semi-cylindrical illuminance and modelling<br />
in residential area lighting, Lighting Research & Technology 21(2) 49-55 (1989)<br />
13 Hall E.T., The hidden dimension, Anchor Books, New York (1996): Reprinted by Anchor Books (a<br />
division of Random House Inc) 1990<br />
14 Van Bommel W. J. M., Public lighting and residential function, CIE proceedings 22nd session Melbourne<br />
15 Raynham, P. & Saksvikrønning, T. White Light and Facial Recognition, The Lighting Journal 68, 1<br />
January/February 2003, pp 29-33<br />
16 Boyce P. R., Eklund N. H., Hamilton B. J., & Bruno L. D., Perceptions of safety at night in different<br />
lighting conditions, Lighting Research & Technology 32(2) 79-91 (2000)<br />
17 Mansfield K. & Raynham P., Urban Lights: Sustainable Urban Lighting for Town Centre Regeneration,<br />
Lux Europa 2005, Berlin pp 491-493<br />
18 Raynham P. & Gardner C. Urban Lights: Sustainable Urban Lighting for Town Centre Regeneration, Lux<br />
Europa 2001, Reykjavik pp 81-84<br />
19 Painter K. A. & Farrington D. P., The financial benefits of improved street lighting based on crime<br />
reduction, Lighting Research and Technology 33,1 (2001) pp 3-12<br />
“Lighting Engineering 2006” stran 121
R-14 “Javna razsvetljava, kako in zakaj”<br />
Avtorjev naslov / Author’s address<br />
Peter Raynham<br />
Lighting Education Trust Lecturer<br />
The Bartlett School of Graduate Studies<br />
University College London<br />
Gower Street<br />
London WC1E 6BT<br />
England<br />
stran 122 Posvetovanje “Razsvetljava 2006”
“Light in Arenas – Arenas in Light ” R-15<br />
Torsten Onasch<br />
LIGHT IN ARENAS – ARENAS IN LIGHT<br />
Summary<br />
Where in former times the sport events themselves stood in the center of attention,<br />
so today the buildings, arenas and sports stadiums themselves contribute to the<br />
attractiveness of the meeting. Stadias and arenas are no longer only places for sport,<br />
but proper magnets, which need to be well produced. In addition they are universal<br />
used and open to numerous organizers for various activities and for events of all types.<br />
Their attractiveness contributes in additionto making the towns and cities, where they<br />
are built to a more interesting place alltogether. The sporting temples of the 21.<br />
Century are important architectural monuments and as such must be presented in the<br />
right light – both for players and spectators as well as for passers - by.<br />
To a stadium belongs the perfect lighting solution for the interior and external<br />
areas.<br />
For instance:<br />
- exterior lighting: approach road ways, park areas<br />
- architecture lighting: facade lighting, customised solutions, light effects<br />
- sports area lighting: floodlights, grandstand illumination<br />
- interior lighting: lounges, catering, transfer areas, changing rooms, sanitary areas,<br />
first assistance area, office/conference rooms, control rooms<br />
- safety and emergency lighting: Escape routes, emergency exits, emergency lighting<br />
Povzetek<br />
Svetloba v areni, arena v svetlobi; Medtem ko je v včasih bil v centru pozornosti<br />
predvsem športni dogodek, pa danes tudi zgradbe, arene in športni štadioni prispevajo<br />
k atraktivnosti dogodka. Štadioni in arene tako niso več samo prostori, kjer se odvijajo<br />
športni dogodki, pač pa tudi magnet za obiskovalce, ki pa mora biti dobro izdelan.<br />
Poleg tega niso več namenjeni samo športu pač pa različnim prireditvam in dogodkom<br />
vseh vrst. Njihova atraktivnost pa prispeva tudi k večji zanimivosti krajev in mest, kjer<br />
se nahajajo. Športni templji 21. stoletja so pomembni arhitekturni spomeniki in kot<br />
take jih je treba predstaviti v pravi luči torej z ustrezno razsvetljavo. Ta mora ustrezati<br />
tako tekmovalcem in gledalcem pa tudi mimoidočim. Stadion tako potrebuje odlično<br />
razsvetljavo za notranje in zunanje površine. Na primer: zunanjo razsvetljavo za<br />
dovozne poti in parkovne površine, arhitekturno razsvetljavo za fasado in svetlobne<br />
efekte, reflektorsko razsvetljavo za športne površine, notranjo razsvetljavo za lože,<br />
lokale, hodnike, garderobe, sanitarije, ambulante, pisarne, konferenčne dvorane in<br />
kontrolne sobe ter varnostno razsvetljavo.<br />
“Lighting Engineering 2006” stran 123
R-15 “Svetloba v areni, arena v svetlobi”<br />
Stadia lighting must also present the stadium by himself and to make a contribution for guidance.<br />
Perfect lighting must therefore fulfill many requirements: The spectators expect an optimally<br />
illuminated event and/or expect an event that comes to life through light. The stadia operators need<br />
an efficient and easy to run system including energy-efficient lighting solutions. For the TV<br />
broadcasting of the meetings aspects such as non-glaring and shade reduction are of importance. The<br />
shadows on the playing field should not be to hard. For good seeing therefore the even distribution of<br />
the light is necessary as well as the necessary lighting level: A too strong interrelation of light and<br />
shadows makes excessive demands of the eyes, because they must constantly adapt again. The<br />
sportsmen and participants of sports meetings need the correct lighting for the special tasks of<br />
viewing for the respective kind of sport. In addition a sufficient general lighting must be provided.<br />
Light makes a stadium not only bright, but also provides for a pleasant atmosphere.<br />
1. Requirements<br />
Quality Sports Lighting<br />
Recommendations and regulation for quality sports lighting are defined in the European standard<br />
for sports lighting EN 12193. This standard includes the most important requirements for lighting of<br />
different kinds of sports as well as further quality requirement such as colour rendering of the lamps,<br />
glare limitation and relevant areas for which these demands are valid.<br />
Guideline for Artificial Lighting of Football Grounds<br />
This guideline combines hints and regulations, which are from FIFA's and modern broadcasting<br />
companies point of view at least necessary to garantee an optimum TV coverage. Here also special<br />
geometric minimum standards (height of the stadium, position of the cameras, etc.) are pointed out.<br />
The criteria defined in this publication can be exceeded by locally agreed lighting values.<br />
Emergency Lighting<br />
Operation and maintenance of emergeny lighting are also defined in standard EN 1838 for<br />
lighting requirements and standard VDE 0108 for electro-technical requirements. For large arenas<br />
standard EN 1838 for an anti-panic lighting is compulsory to reach the emergency exits without<br />
panic.<br />
These security and electro-technical requirements of luminaires for emergency lighting are<br />
defined in standard DIN EN 60598-2-22.<br />
Television Broadcast<br />
The high definition television standard HDTV initiates a change in the broadcasting of sports<br />
events. Sharper images, more contrast and details, nearly stereoscopic.<br />
This obviously better quality is reached by the higher number of pixels. Whereas the former<br />
German PAL signal reproduces 720 x 576 pixels, HDTV reproduces 1920 x 720 or 1080 pixels. The<br />
whole amount of pixels increases from about 400 000 to two million. For an optimum reproduction<br />
stran 124 Posvetovanje “Razsvetljava 2006”
“Light in Arenas – Arenas in Light ” R-15<br />
of the images there are special kinds of cameras and a particularly high-quality illumination<br />
necessary.<br />
Light Emission<br />
Besides it is also necessary to limit the light emission. The international lighting comissio – CIE<br />
– made a number of recommendations to disturbing diffuses light and in some parts of Europe and<br />
the United States there are specifications for limitation of such diffused light.<br />
Indoors<br />
The European standard "Illumination of indoor working places" defines criteria for suitabel and<br />
adequate lighting for a better and more effective vision. This standard defines the regulations<br />
concerning quantity and quality of the illumination of most working places and the related desktops.<br />
Energy pass for Buildings<br />
With the new European legislation the illumination of new buildings is regulated already in the<br />
pre-planning when submitting the building application form. Also for renovations and old buildings<br />
the Energy pass for Buildings is relevant. The EG-guideline 2002/91/EG for the total energy<br />
efficiency of buildings demands energy passes for new and old buildings. The members of the EU<br />
put this regulation gradually into national law.<br />
2 Concept Description<br />
2.1 Outdoors<br />
Millions of people are fascinated by important sports events. The illumation of the access roads is<br />
important, also because it is an additional help for orientation, here you have bollard luminaires and<br />
the car-park lighting. High illumination in parking garages increases the subjective feeling for<br />
security. Illuminating the environment of the arena has not only functional aspects, it also creates a<br />
special atmosphere.<br />
Within the area the regulation for official buildings applies, that means that roads especially<br />
entries and exits have to be cleary marked and well illuminated to prevent accidents. Illumination of<br />
roads and outdoor lighting in general has to be energy-efficient and has to have minimum light<br />
emission. The luminaires have to function also under extreme weather conditions and have to be easy<br />
to maintain. Roundabouts, crossings, etc. as well as subways and tunnels demand high impact of<br />
light, security and maintenance possibilities of the lighting system.<br />
New initiatives of the EU demand a high level of energy efficiency for outdoor lighting systems.<br />
The reduction of light emission involves an increas in light efficiency.<br />
“Lighting Engineering 2006” stran 125
R-15 “Svetloba v areni, arena v svetlobi”<br />
Outdoor Lighting SAP Arena Mannheim Germany<br />
2.2 Architectural Lighting<br />
Sports grounds are not only areas for competitions but also represent brands, companies and<br />
sports clubs through the design of walls and facades. You can decide between integrated lighting<br />
solutions, flood and spot lighting. In the first solution lamps and luminaires are integrated in the<br />
facade. Heat development and compability between material and the luminaire have to be observed.<br />
Colour effects and colour changes, controlled by PC systems create diversifications and thus<br />
emphasise brands and their identities. The LED technology opens new options which have not be<br />
possible yet.<br />
Important criteria are the necessary lighting level, light colour and colour rendering. The lighting<br />
level is orientated on the surrounding of the sports ground. Inside cities higher levels of illuminances<br />
are required than outside cities.<br />
The lighting colours depends on the surface colour of the facade. For intensification of warm<br />
colours also warm-white lamp colours are used. Cold colours are intensified by neutral-white and<br />
daylight-white colours which could create an exciting atmosphere.<br />
The positioning of the floodlights for illuminating a facade is orientated primarly on visible<br />
structures and architecture or on the surroundings. Under all circumstances it has to be excluded to<br />
glare passengers and visitors. Architectural lighting and traffic lighting have to be coordinated.<br />
Environmental aspects require an limited light emission.<br />
stran 126 Posvetovanje “Razsvetljava 2006”
“Light in Arenas – Arenas in Light ” R-15<br />
Arena Porto Portugal<br />
2.3 Floodlighting<br />
The illumation of sports grounds is important for the sportsmen and the spectators as well. TV<br />
broadcasting demand additonal requirements. For good viewing conditions vertical illuminances and<br />
good local uniformity of the horizontal illuminances are important requirements as well as a low<br />
glare effect of the spot and the flood lights. This is the reason for using rotation-symetric beaming<br />
floodlights. In some cases a mixture of symetric and asymetric flood lights could be necessary if the<br />
height is not sufficient.<br />
In the traditional site the floodlights are mounted on four poles; here you get the typical four<br />
shadows on the grass. All quality requirements are fulfilled. Modern stadiums gradually develpe to<br />
arenas.<br />
To some extend completely closed roofs, or at least a roof over the grandstand opens new<br />
possibilities for illumination. The floodlights are installed in one or two rows in different rotation and<br />
inclination angles under the roof. Because of the low distance of the floodlights to the field they<br />
could be mounted in lower heights in comparision to a four-pole installation. This kind of<br />
illumination is the most popular solution today.<br />
The grandstands are illuminated from out of the roofs, this is not only for the security of the<br />
visitors but also for the broadcasting companies who want to reproduce the atmoshpere of the<br />
stadium.<br />
Stadium Lokomotive Moskau, Russia<br />
“Lighting Engineering 2006” stran 127
R-15 “Svetloba v areni, arena v svetlobi”<br />
EM Stadium Salzburg, Austria<br />
2.4 Indoor Lighting<br />
Indoor lighting demand a number of requirements, integrated in the standard EN 12464-1.<br />
Beyond standardised requirements on illumination there are solution concepts which influence<br />
the well-being of the people and the productivity of their work in a positive way.<br />
The demand to realize flexibility, aesthetics, well-being and energy in buildings combines an<br />
overall view of lighting quality.<br />
Light for Well-Being<br />
Separated switching and dimming of the components provide changeable environments in the<br />
building, the electronic control units increase the comfort through flicker-free light.<br />
The first component of the lighting is the reflected part from the ceiling and the wall, the second<br />
component is the direct part for the funtional and task areas.<br />
Switching and dimming means a change in the lighting level and the lighting colours.<br />
VIP-Area Allianz Arena Munich, Germany<br />
stran 128 Posvetovanje “Razsvetljava 2006”
“Light in Arenas – Arenas in Light ” R-15<br />
2.5 Emergency and Safety Lighting<br />
Good illumination gives you a feeling of safety and guarantees that in case of an emergency<br />
enough light for all areas is available. The decentralised implementation of emergency systems<br />
secures an individual supply of emergency light for all areas. Lighting is part of every safety concept.<br />
A good protection effect is suddenly flashing bright light. In floors and stairs as well as in parking<br />
areas and parking garages the feeling for safety could be increased by aimed wall and ceiling<br />
illumination and a good illumination of the emergency exits. Dependent on the building the power<br />
supply could be done via central batteries, single batteries or emergency generators.<br />
3 Functional Description<br />
3.1 Outdoor Lighting<br />
3.1.1 Access Roads<br />
Access roads have to fulfill the requirements of the international or country-specific standards for<br />
street lighting, i.e. DIN EN 13201. The basic principal is "view and to be viewed". Different lighting<br />
systems are suitable to ensure various demands on lighting level, uniformity and minimum glare.<br />
Mast-mounted luminaires with high-optimized reflectors and secondary systems are most<br />
popular. On main roads HST lamps are used because of their high energy efficiency mostly the fouryears-version<br />
is used. Close to buildings HQI and fluorescent lamps are used due to the better colour<br />
rendering.<br />
Access Roads SAP Arena Mannheim, Germany<br />
3.1.2 Parking Garages<br />
Parking garages have to be illuminated very brightly to ensure the safety of persons and vehicles.<br />
Especially narrowness in a building and engineered barriers caused by the architecture such as<br />
“Lighting Engineering 2006” stran 129
R-15 “Svetloba v areni, arena v svetlobi”<br />
concrete beams should be specially illuminated by T5 or T8 fluorescent lamps to increase the<br />
attentiveness of the visitors.<br />
Clearly marked and separated ways for vehicles and pedestrians reduces the risk of accidents. For<br />
a better orientation access and exit roads are well illuminated.<br />
3.1.3 Stadium Access and Exit<br />
The entrance has a reprensentative function especially for the visistors. Friendly bright entrances<br />
have orientation funcion: Light divides floor plans, shows the way to the cash counters, stand,<br />
catering areas and toilets. They are meeting points to see others and receive first aid.<br />
Formula 1 Track, Shanghai, China<br />
3.2 Architectural Lighting<br />
3.2.1 Facade Illumination<br />
Various lighting concepts are necessary to design a facade with light. Normally a facade is a<br />
central element to present brands. Here you can "feel" the brand - here lighting, architecture and<br />
lighting scenarios show the uniqueness of the stadium. The facade is some kind of packaging. It<br />
wraps the stadium, makes curious and transforms the stadium to a real landmark.<br />
No matter if the facade illumination is an integrated system or a lighting concept or a mixture of<br />
both, it is important to keep the light emission as low as possible according to the surroundings.<br />
The angle of the reflected beam or the optical systems have to be adapted to the respective<br />
situation. LED as innovative source of light open new possibilities, i.e. Logos or special writings or<br />
displays with changing colours.<br />
stran 130 Posvetovanje “Razsvetljava 2006”
“Light in Arenas – Arenas in Light ” R-15<br />
Allianz-Arena Munich, Germany<br />
3.3 Sports Lighting<br />
3.3.1 Floodlights<br />
Floodlights with a HQI 2000W should work without failure under every surrounding<br />
temperature. Therefore many available products do not have an extra housing in the reflector. The<br />
reflector, which is necessary for the different light distributions is at the same time the housing and<br />
cares for an optimum cooling. For a mast implementation of the floodlights an optimum hail<br />
protection should be available, which could easily be fixed at the floodlight. For TV broadcasting a<br />
high colour rendering is absolutely necessary – here metal halid lamps should be used. The<br />
relationship between lifetime of the lamp and its colour rendering is very well tuned, it is nearly<br />
constant during the whole lifetime of the lamp. On training grounds also lamps with a higher<br />
luminous flux can be used. Therefore you can save energy and at the same time you can guarantee a<br />
good illumination level. Every floodlight has to have the possibility to implement a telescopic sight<br />
for an excat aiming according to coordinates on the field. At least five different light distributions are<br />
necessary to transport the light with the required illuminance and uniformity. Shutters integrated in<br />
the floodlights care for a reduced light emission in the upper area. Safety glass with a high level of<br />
transmission is the condition for a high efficiency of the system. The floodlight has a mechanical<br />
connector to gurantee a voltage free opening of the housing (tool free)<br />
Helsinki Olympic Stadium<br />
“Lighting Engineering 2006” stran 131
R-15 “Svetloba v areni, arena v svetlobi”<br />
3.3.2 Grandstands<br />
There a different ways to illuminate the tribunes, whereas floodlights beaming from the inner<br />
edge of the roof are most popular. The asymetric light is very important for TV cameras to show<br />
emotions and faces. Security cameras are installed on various places to aim at special persons or<br />
tumults. For illumination of events or emergencies you have to choose lamps with an immediate<br />
ignition (i.e. fluorescent lamps or halogen lamps).<br />
indirect illumination of the tribunes Commerzbank Arena, Frankfurt/M., Germany<br />
3.4. Indoor Lighting<br />
3.4.1 Lounges<br />
Lounges are reception, waiting and resting areas – they sould be illuminated in a way to give<br />
them a special atmosphere through light control and selection of luminaires.<br />
Light should emphasise the architectural structures. Illumination of vertical areas through<br />
uplights and wallwashers are important planning details. Light colours should harmonise with<br />
the other colours used. Glare-free light at working places is required.<br />
Lounge, Stockholm, Sweden<br />
stran 132 Posvetovanje “Razsvetljava 2006”
“Light in Arenas – Arenas in Light ” R-15<br />
3.4.2 Catering<br />
These areas could also be used as party or meeting areas. Illumination of walls by using uplights<br />
contribute to a communicative atmosphere. Counters and bars can be also emphasised. Accent<br />
lighting in combination with indirect light do this. Recommended light colour for catering areas is<br />
warmwhite. Lamps with a good colour rendering is important to show food and beverages in an<br />
appetising way. Should you wish to use these areas in a different way you should plan further<br />
lighting concepts in combination with lighting management system. Daylight systems and microsunshield<br />
louvers could also be used.<br />
Catering Area Allianz Arena Munich, Germany<br />
Cafeteria, Milton Keynes, United Kingdom<br />
3.4.3 Transfer Areas<br />
It is possible that transfer areas have daylight or have to be illuminated completely with artificial<br />
light. In such a case question of maintenance and energy consumption are of central importance for<br />
the lighting concept. With light management systems, i.e. DALI and EIB the lighting level can be<br />
regulated to save energy and operating costs.<br />
“Lighting Engineering 2006” stran 133
R-15 “Svetloba v areni, arena v svetlobi”<br />
Floor, entrances and exits can be illuminated with wall or ceiling lighting as well as accentuating<br />
architectural structures.<br />
Closed luminaires have a low maintenance effort because of their low pollution degree.<br />
Using T5 lamps in combination with HVG's bring more energy efficiency. Here a good<br />
uniformity of the light is important.<br />
Allianz Arena Munich, Germany<br />
3.4.4 Changing Rooms, Sanitary Areas, First Aid Areas<br />
In changing rooms, sanitary areas, first aid areas sufficient illuminance should be guaranteed.<br />
Warm colours dominate. Damp proof luminaires are to be favoured because of their high quality<br />
material and their high protection class. Prismatic technology cause a good and uniform illumination.<br />
Sanitary Areas, First Aid Areas<br />
A minimum luminous flux of 100 lux is standard; due to sanitary reasons a luminous flux of 300<br />
lux is recommended. That make the work of the cleaning personnel much easier<br />
In showers and toilets luminaires with IP X4 or IP X5 should be used.<br />
In rooms without any daylight it is important, to have an efficient handling, thats why are often<br />
used luminaires with electronic ballasts.<br />
Changing rooms<br />
The general requirement is to have 100 lux, but is more comfortable to have in this rooms 300<br />
lux. You will have an better feeling. Also you will get the impression of hygiene and cleanness.<br />
3.4.5 Offices and conferenz rooms<br />
Single offices and meeting rooms<br />
Often this rooms have an direct contact with daylight. Standing luminaires with glare free pism<br />
structures offer a very large flexibility in combination with the furnitures. In addition you can use a<br />
general room lighting with direct or direct-indirect luminaires.<br />
stran 134 Posvetovanje “Razsvetljava 2006”
“Light in Arenas – Arenas in Light ” R-15<br />
Open-plan offices<br />
Open-plan offices gives you the possibility of working groups and teams with a completely<br />
flexible area use and room layout. For this a general room lighting proves as a very suitable<br />
conceptional beginning. It is implemented with a lower room hight preferentially as direct lighting,<br />
with sufficient hight as direct indirect lighting. A direct indirect lighting contributes to a high room<br />
comfort by an increase of the vertical density of light and produces thereby a daylight-similar<br />
lighting environment. In connection with a light management system can be reduced the energy costs<br />
by a daylight and presence-dependent lighting control. Daylight systems improve the viewing<br />
comfort and increase the daylight portion in window-far room zones. With daylight skylight<br />
solutions a micro raster offers itself as sun protection, which is integrated into the glazing. This fades<br />
out the direct sun exposure effectively, without impairing the view substantially.<br />
Conference rooms<br />
The use of conference rooms makes several demands for the lighting: A balanced relationship of<br />
horizontal and vertical lighting is priority. With the horizontal component a sufficiently high lighting<br />
level is to be obtained, in order to be able to read conference documents problem-free on the<br />
conference tables. A sufficient vertical lighting component produces a friendly, bright space<br />
atmosphere and promotes communication.<br />
Within the range of the medium wall an additional lighting should provide good viewing<br />
cdonditions on diagrams. On the other hand the medium wall must be able to be darkened perfectly<br />
for a projection, while at the same time in the room a basic lighting or a writing lighting remains.<br />
For this is a lighting management system proves as meaningful, where you can call preprogrammed<br />
light scenes.<br />
3.4.6 Controll rooms<br />
In control rooms and/or switching centers is usually little quantity of daylight. Densities of light<br />
of 200 lux are recommended. In order to produce however positive light attractions and a natural<br />
time rhythm, densities of light of approx.. 300 lux should be considered. Lighting solutions should<br />
stimulate the natural bio rhythm. This can be made by different kinds: the "brilliant" and the<br />
"dynamic" light. Brilliant light promotes here the physiological and the mental awake condition and<br />
leads to an increased activity, to a higher sensitivity and to a larger attention. Dynamic light with<br />
changing densities of light and changing colors of light increases however the perception ability in a<br />
room. Self-regulating and variable light management systems produce a biodynamic light with high<br />
lighting values as well as changeable colors of light and light intensities.<br />
It is not allowed to have any glare. If a glare arises, then the perception is impaired. This can lead<br />
to dangerous situations. In addition the brightness differences in the room should be determined and<br />
also the illuminance densities by objects in the field of view. The luminance differences in the<br />
surrounding field of the direct viewing task should not exceed the factor 3 thereby glare are avoided.<br />
The space light must be supplemented depending upon task of work by arranged point light<br />
“Lighting Engineering 2006” stran 135
R-15 “Svetloba v areni, arena v svetlobi”<br />
Police control room, Nürnberg, Germany<br />
3.5 Safety and emergency lighting<br />
3.5.1 Escape routes + emergency exits<br />
If the emergency lighting for emergency routes fulfills their tasks, then it must create sufficient<br />
viewing conditions for orientation on emergency routes and building surfaces. At the same time fire<br />
fighting and safety devices must be easy to find.<br />
For the marking and lighting of escape/emergency routes and emergency exits are always<br />
necessary:<br />
- luminaries with a rescue sign<br />
- luminaries for the illumination of the escape routes<br />
- in addition escape and emergency route plans must be visibly attached for everyone<br />
According to DIN EN 1838 the emergency lighting for escapey routes is the "part of the<br />
emergency lighting, for which it makes possible to recognize and use rescue mechanisms clearly, if<br />
persons are present".<br />
On the axis of the escape route with a width up to 2 meters must have the horizontal illuminance<br />
a value not lower than 1lx, and the relationship of the largest to the smallest illuminance may not<br />
exceed 40:1 along the center line. The luminaires must be mounted in a hight of minimum 2 m.<br />
If an emergency exit is not to be seen direct, than it is necessary to attach one or more lit and/or<br />
behind-shone rescue signs with indication of direction.<br />
Safety lights for emergency routes or rescue indication lights create an appropriate density of<br />
light level according to DIN EN 1838, if they are attached on the following places:<br />
- at everyone door, which can be used in a emergency case<br />
- close at stairs, in order to light up each stage or every other changed level<br />
- at prescribed emergency exits<br />
- at each change of direction<br />
- on each crossing of corridors or courses<br />
- neat to every last exit<br />
- close to each first aid place, fire fighting devices and reporting direction<br />
stran 136 Posvetovanje “Razsvetljava 2006”
“Light in Arenas – Arenas in Light ” R-15<br />
According to DIN EN 1838 rescue characters and safety lights must fulfill the following quality<br />
criteria: The colors must correspond to ISO 3864. The luminance of the safety color must amount at<br />
least 2 cd/m². Fortheu sing with general lighting higher requirements are applied: 200cd/m² middle<br />
luminance on the entire area. The relationship of the largest to the smallest luminance may be larger<br />
neither in the white surface nor in the safety color than 10:1. The relationship of the luminance L<br />
white to the luminance L color must have at least 5:1 and may not larger than 15:1.<br />
LED-safety light<br />
3.5.2 Emergency/ spare lighting<br />
Emergency lighting is the superordinate term if the general artificial lighting malfunctioned.<br />
Emergency lighting needs therefore its own power supply: Single battery, group battery, common<br />
battery, aggregates or a particularly secured net. If a spare lighting has to take over tasks of the<br />
emergency lighting, than it has to fulfill all requirements of DIN EN 1838. Possibly necessary<br />
activities can be continued then. If its lighting level is however under the minimum of the general<br />
lighting, the spare lighting may be only used, in order to drive or terminate a working process down.<br />
The time interval between the loss of the general artificial lighting on disturbance of the current<br />
supply and reaching the necessary density of light should be as short as possible. The rated service<br />
time for working places must be ensured for one hour at least. The color reproduction index RA of<br />
the lamps must amount to at least 40, so that safety colors are to be recognized clearly.<br />
4. Interfaces<br />
The rising requirements at comfort and efficiency in the using of buildings lead in the building<br />
services to the use of modern digital control systems, which cover comprehensive building functions<br />
generally and the front lighting in the special. In stages extensive Facility management systems are<br />
used. Light control systems are to be seen here as important part and offering light solutions to the<br />
following central main topics:<br />
“Lighting Engineering 2006” stran 137
R-15 “Svetloba v areni, arena v svetlobi”<br />
- central administration<br />
- application-spreading energy management<br />
- daylight dependent controls<br />
- integration of light, glare shield, heating and ventilation<br />
- automation of routine tasks<br />
- failure reports<br />
- cost transparancy<br />
By DALI (digital Addressable Lighting interface) it is possible to address dimmable ECG<br />
individually and digitally with the help of a controller and assign groups to stop scenes and for<br />
feedbacks. Depending upon design of the controller - from simple to complex - all requirements for<br />
the subsystem "light" can be covered with DALI.<br />
In simplest case is only the dimming and the switching, in the complex case is a scene<br />
management with feedback of lamp errors possible. For these applications a multiplicity of different<br />
controllers are available, from the simple control module up to the gateway between DALI and the<br />
building bus system.<br />
Building-comprehensive light solutions are based on field bus systems such as EIB or the pofibus<br />
DP. These systems steer and supervise all technical building functions and functions of the light<br />
management. The integration of the operating devices is made here by gateways to the superordinate<br />
systems. The RGB light control for tendencyful light accents and/or light productions.<br />
REFERENCES (extract)<br />
Allianz Arena Munic 2005<br />
Ernst Happel Stadium Vienna 2006<br />
San Siro Milano 2005<br />
Stadio Communale Di Torino 2005<br />
Olympic Horse Track Athens 2004 (2133 floodlights)<br />
Stadium Tijanjin 2005<br />
6 of 9 stages in Portugal for the European football championship 2004<br />
Avtorjev naslov / Authors’ address:<br />
Dipl. Ing. Torsten Onasch.<br />
Project Manager Sports Lighting<br />
Siteco Beleuchtungstechnik GmbH<br />
Ohmstrasse 50<br />
83301 Traunreut<br />
Germany<br />
Tel.: +49 8669 33 386<br />
Fax: +49 8669 33 443<br />
Email: t.onasch@siteco.de<br />
stran 138 Posvetovanje “Razsvetljava 2006”
“Obvezna ali prostovoljna uporaba standardov za razsvetljavo pri delu” R-16<br />
Primož Gspan<br />
OBVEZNA ALI PROSTOVOLJNA UPORABA STANDARDOV ZA<br />
RAZSVETLJAVO PRI DELU<br />
Povzetek<br />
Iz prvotnega enotnega slovenskega standarda OSIST prEN 12464 sta od leta<br />
2004 nastala in ostala še vedno z isto oznako dva dela. Prvi del, ki je že dobro<br />
opisan v 2. izdaji Priporočil SRD Pr4/1,Pr4/2, 2004, se nanaša na delovna<br />
mesta v delovnih prostorih, drugi na delovna mesta na prostem. V prispevku so<br />
opisane nekatere značilnosti standarda, ki so pomembne za uporabo, zlasti 2.<br />
dela. Opozorjeno je, da je po zakonodaji s področja varnosti in zdravja pri delu<br />
uporaba tega standarda obvezna. V prispevku je omenjena publikacija ZVD št.<br />
137, kjer je med drugim navedena poslovenjena nomenklatura delovnih mest in<br />
del na prostem, priložena ji je zgoščenka za priročnejšo uporabo pri presoji<br />
skladnosti z zahtevami standarda na temelju terenskih meritev, predlagan je<br />
postopek za poenostavljen ter ekonomsko in strokovno sprejemljiv predpisan<br />
periodični nadzor primernosti umetne razsvetljave na delovnih mestih.<br />
Predlagana je tudi »stopnja obremenitve« SO na temelju skladnosti s predpisom<br />
kot kriterij za določanje stopnje tveganja R, kot jo zahteva slovenski predpis o<br />
izjavi o varnosti.<br />
Obveznost uporabe standarda SIST EN 12464<br />
Standard je po definiciji za uporabo neobvezen dokument, ki ga s konsenzom sprejme priznani<br />
organ, in ki določa pravila, smernice in značilnosti za dejavnosti in za njihove rezultate in ki s tem<br />
zagotavlja enotnost, kakovost in skladnost zahtev, proizvodov in dejavnosti ter je usmerjen na<br />
doseganje optimalne stopnje urejenosti na določenem področju. Na splošno je zato uporaba<br />
slovenskih nacionalnih in drugih standardov prostovoljna.<br />
V naši državi slovenski nacionalni organ za standarde sprejema slovenske standarde z oznako<br />
SIST, ki so lahko pripravljeni kot izvirni nacionalni standardi ali privzeti mednarodni, evropski ali<br />
tuji nacionalni standardi.<br />
“Lighting Engineering 2006” stran 139
R-16 “Razsvetljava delovnih mest”<br />
V posebnih primerih postane uporaba standarda obvezna, če se na standard sklicuje predpis. Ob<br />
tem pa se mora po zakonu o standardizaciji 1 predpis sklicevati na slovenski nacionalni standard<br />
SIST.<br />
Sklicevanje predpisa na standard je možno na tri načine: datirano sklicevanje na določeno izdajo<br />
standarda, nedatirano sklicevanje, pri čemer velja zadnja verzija (izdaja) standarda in splošno<br />
sklicevanje na vse standarde določenega organa ali na določenem področju, ne da bi standarde po<br />
oznakah posebno navedli. V zadnjem primeru pravimo, da se sklicujemo na splošne klavzule, kot je<br />
»stanje tehnike« in ki imajo vlogo pravnega vira v hierarhiji predpisov. To velja tudi za standarde, ki<br />
urejajo razsvetljavo na delovnih mestih.<br />
Pravilnik o spremembah in dopolnitvah Pravilnika o zahtevah za zagotavljanje varnosti in zdravja<br />
delavcev na delovnih mestih 2 določa v 3. členu: 'V 31. členu se drugi odstavek spremeni tako, da se<br />
glasi: »Za izpolnjevanje zahtev iz prejšnjega odstavka mora delodajalec upoštevati določila<br />
slovenskih standardov za razsvetljavo na delovnih mestih.«' S takšnim splošnim sklicevanjem so<br />
postala »določila slovenskih standardov za razsvetljavo na delovnih mestih« obvezna za uporabo.<br />
Izdajatelj pravilnika se je torej smiselno odločil za obvezno upoštevanje vseh slovenskih standardov,<br />
ki se nanašajo na razsvetljavo na delovnih mestih. Dva od teh sta privzeta standarda EU in sicer SIST<br />
EN 12464-1 3 in OSIST prEN 12464-2 4 . Prvi se nanaša na delovna mesta v prostorih, drugi pa na<br />
delovna mesta na prostem. Prvotno je bil to samo en standard 5 , ki je vseboval delovna mesta na<br />
splošno, leta 2004 pa se je razdelil na sedanja dva dela. Dopolnim naj, da ima v Nemčiji oznako DIN<br />
EN 12464-2, pri tem pa je v EU od lani standard z oznako EN ISO/FDIS 8995-2 10 , prejšnji prEN<br />
12464-2 pa je umaknjen.<br />
Kakor koli, zametek o obvezni uporabi je vgrajen že v vsebino samega standarda z definicijo<br />
»vzdrževane osvetljenost« s tem, da eksplicitno določa, da pod določeno mejo povprečna<br />
osvetljenost na določeni površini ne sme nikdar pasti.<br />
Ne glede na obliko oznake in dodatne bolj ali manj umetno ustvarjene dileme, pripombe,<br />
tolmačenja ali izgovore, ugotovimo, da je uporaba standarda SIST EN 12464-1 in OSIST prEN<br />
12464 obvezna, ker se na standarda implicitno sklicuje v uradnem listu objavljeni predpis 2 , ki ureja<br />
zahteve varnosti in zdravja pri delu.<br />
Nekatere značilnosti standarda serije 12464<br />
Posebej moramo poudariti, da se moramo pri razsvetljavi na delovnih mesti zavedati, da<br />
standard, ki se sicer omejuje samo na zahteve za umetno razsvetljavo, šteje naravno razsvetljavo kot<br />
temeljno in ji je umetna samo dopolnilo, kjer in kadar naravna ne zadošča. To izhodišče je posebno<br />
pomembno pri arhitekturni zasnovi objektov pa tudi razporeditvi delovnih mest in ki je včasih<br />
premalo upoštevano, ker niso redki primere, kjer si je arhitekt zamislil prostore s pomanjkljivo ali<br />
celo brez naravne osvetljenosti. Podobno velja za vedno priporočen zadostni optični stik z okolico za<br />
boljše počutje (čitaj: proizvodnost) zaposlenih.<br />
Posebnosti prvotnega standarda, še preden je bil razdeljen na dva dela, so bile dovolj podrobno<br />
opisane v publikaciji Priporočila SRD Pr4/1,Pr4/2, 2004 6 , namenjeni predvsem projektantom. Zato<br />
vseh posebnosti podrobno ne navajajmo.<br />
stran 140 Posvetovanje “Razsvetljava 2006”
“Obvezna ali prostovoljna uporaba standardov za razsvetljavo pri delu” R-16<br />
Pričujoči sestavek pa je namenjen v prvi vrsti strokovnim delavcem s področja varnosti in zdravja<br />
pri delu, ki se s projektiranjem neposredno na ukvarjajo, pač pa imajo pomembno vlogo pri izbiri<br />
zahtev za razsvetljavo za določeno delo, pri predpisanem periodičnem nadzoru (meritvah) na<br />
delovnem mestu in inšpekcijskemu organu pri preverjanju izvajanja predpisov. Zato naj kljub temu,<br />
da projektanti področje dobro poznajo, ponovno spomnimo na nekatere značilnosti standarda, ki se<br />
jih včasih premalo zavedamo in ki so pomembne zlasti za strokovnega delavca za varnost in zdravje<br />
pri delu, pooblaščenega zdravnika in za nadzorni organ.<br />
Redni periodični nadzor nad delovnim okoljem, kamor spada tudi razsvetljava na delovnih<br />
mestih, določa Pravilnik o preiskavah delovnega okolja, pregledih in preizkusih sredstev za delo 9 ,<br />
čeprav so nekateri mnenja, da so roki za periodične preglede določeni v izjavi o varnosti. Verjetno<br />
menijo, da to velja za krajše roke od 3 leta, kot jih na splošno zahteva pravilnik 9 .<br />
Pri uporabi standarda moramo vedeti, da vsebuje minimalne zahteve za razsvetljavo (zato res ne<br />
smejo biti vrednosti v praksi manjše), glede ekonomike pa moramo zahteve šteti kot maksimalne, da<br />
z izpolnitvijo zahtev standarda po nepotrebnem ne tratimo in zapravljamo energije več, kot je<br />
neobhodno potrebno.<br />
Zato ne smemo pozabiti, da standard usklajuje minimalne pogoje za vidne zahteve dela in<br />
zahteve po ekonomiki – varčevanju z energijo -, pri čemer pa posebej poudarja, da ni dovoljeno<br />
varčevanje pri energiji na račun premajhne osvetljenost oz. nezadostne kakovosti razsvetljave. V tem<br />
smislu tudi ne omejuje uporabe tudi novih in inovativnih rešitev.<br />
Pri nas je še manj znan pojem »vzdrževane osvetljenosti«, ki ga uvaja standard namesto prejšnje<br />
»imenske (nazivne) osvetljenosti« in sicer iz praktičnega razloga, ker je bila imenska osvetljenost<br />
projektantski pripomoček in jo v praksi ni bilo mogoče mersko preverjati. »Vzdrževana osvetljenost«<br />
pa je definirana kot tista meja osvetljenosti, pod katero na delovnem mestu povprečna (krajevno)<br />
osvetljenost ne sme pasti tekom staranja razsvetljevalne naprave in pomeni točko, pri kateri je<br />
potrebno servisirati razsvetljavo. Iz tega jasno izhaja naloga merilca, ki meri zadostnost osvetljenosti:<br />
ugotoviti mora povprečno osvetljenost področja opravljanja vidne naloge, in če je ta pod vzdrževano<br />
osvetljenostjo, mora ugotoviti, da osvetljenost ni zadostna. V tem primeru je mišljeno povprečje<br />
osvetljenosti preko površine, kjer se opravlja vidna naloga.<br />
Razen osvetljenosti, ki jo za posamezna dela predpisuje standard, predpisuje tudi vrsto drugih<br />
bistvenih zahtev za razsvetljavo, ki morajo biti izpolnjene za udobno, dobro in neškodljivo<br />
opravljanje vidne naloge delavca: največjo dopustno mero bleščanja, zahtevano stopnjo barvne<br />
reprodukcije, enakomernost osvetljenosti, barvno temperaturo in ponekod dodatne zahteve v obliki<br />
opomb. Zahteve so navedene podrobno za posamezna dela znotraj širše razdelitve na različne tipične<br />
vrste dejavnosti (promet, industrija, uradi, zdravstvo itd.).<br />
Posebej opozorimo v tem sestavku na del standarda (OSIST prEN 12464-2), ki se nanaša na<br />
delovna mesta na prostem in ki jih priporočila 6 podrobno ne navajajo.<br />
Za nas so novost kriteriji za preprečevanje moteče svetlobe v smislu varstva naravnega in<br />
bivalnega okolja, za kar si s posebnim predpisom že več let prizadeva MOP. Predpisane omejitve so<br />
podane v obliki dopustnih mej za svetlobo v okolici zunanje razsvetljave. V odvisnosti od štirih<br />
stopenj varovanja okolja predpisuje standard največji dopustni delež navzgor usmerjene svetlobe<br />
svetil v %, največjo navpično osvetljenost oken bivalnih prostorov, največjo svetilnost virov svetlobe<br />
in svetlost zgradb.<br />
2. del standarda podaja v obliki preglednice tudi mejne vrednosti za: vzdrževano osvetljenost,<br />
razred bleščanja, razred barvne reprodukcije, barvno temperaturo in nekatere posebne zahteve v<br />
obliki opomb (nova verzija EN ISO 8995-2 še enakomernost razsvetljave U 0 ).<br />
“Lighting Engineering 2006” stran 141
R-16 “Razsvetljava delovnih mest”<br />
Med 1. in 2. delom so tudi nekatere razlike. Za delovna mesta v objektih je npr. nekoliko drugače<br />
definirano območje vidne naloge in neposredne okolice, ki je v 1. delu bolj točno določeno. Tudi<br />
koeficient bleščanja UGR L je za delo v objektih drugače definiran, kot je definiran za dela na prostem<br />
GR L . Pri določanju povprečne osvetljenosti s pomočjo merske mreže je treba pri obeh nekaj<br />
iznajdljivosti in trezne presoje.<br />
Opozoriti je treba, da so bila dela in opravila doslej v celoti poslovenjena za delovna mesta v<br />
prostorih (1. del) 6 , za dela na prostem (2. del) pa so bila poslovenjena v posebni publikaciji 7 . Poleg<br />
poslovenjenih tabel so poslovenjena tudi po abecednem redu urejena gesla, ki omogočajo lažjo<br />
uporabo tabel.<br />
Preverjanje skladnosti z zahtevami standarda<br />
Skladnost z zahtevami se načeloma preverja trikrat: za zahtevne objekte pri obvezni reviziji<br />
projektov, pri novi razsvetljavi v postopku prevzema investicije oz. pridobitev obratovalnega<br />
dovoljenja, ter pri obveznih periodičnih preiskavah in pregledih delovnega okolja. Za strokovne<br />
delavce in inšpekcijski organ, ki jim je v prvi vrsti namenjen ta sestavek, je zlasti pogosto zadnje<br />
opravilo: periodične »meritve«.<br />
Že v standardu je vgrajen duh ekonomike, kot je bilo omenjeno. Tudi periodične preiskave, v<br />
našem primeru preverjanje primernosti razsvetljave, morajo biti gospodarno opravilo. Zaradi<br />
»stroškov« so se doslej periodične meritve omejevale praktično izključno na merjenje<br />
osvetljenosti na delovnih mestih. Vendar standard poleg osvetljenosti, ki je najlažje in<br />
najpreprosteje merljiva, zahteva izpolnitev še drugih zahtev, kot so: bleščanje, barvna<br />
reprodukcija in barvna temperatura. Razen tega morajo biti v smislu predpisov s področja<br />
varnosti in zdravja pri delu rezultati preiskav integrirani v izjavo o varnosti z oceno tveganja.<br />
Gospodarnost nadzora nad razsvetljavo na delovnih mestih zahteva takšen postopek, ki da z<br />
najmanjšim vlaganjem največji učinek. Zato je smiselno največjo pozornost nameniti običajno<br />
najpomembnejšemu parametru, ki določa vidnost: osvetljenosti. Bleščanje, kakovost podajanja<br />
barv in barvna temperatura so parametri, ki zahtevajo dražjo opremo, več znanja, meritve so<br />
zahtevnejše, ali so parametri merljivi samo laboratorijsko.<br />
Zato gospodarno presojo v smislu standarda je primeren naslednji postopek:<br />
stran 142 Posvetovanje “Razsvetljava 2006”
“Obvezna ali prostovoljna uporaba standardov za razsvetljavo pri delu” R-16<br />
Začetek postopka<br />
Pregled projektne dokumentacije<br />
Kontrola izvedbe<br />
UGR L Ra T B<br />
Usklajeno s standardom<br />
da<br />
?<br />
ne<br />
Meritev osvetljenosti<br />
Usklajeno s standardom<br />
?<br />
ne<br />
da<br />
da<br />
Pritožbe<br />
ne<br />
?<br />
Meritve, preverbe<br />
UGR L , Ra, ..<br />
Skladno<br />
da<br />
ne<br />
?<br />
Ukrepi<br />
Poročilo o skladnosti<br />
Kot prvi korak najprej preverimo po projektni dokumentaciji, ali so izhodišča projekta skladna z<br />
zahtevami veljavnega standarda. Koristna je še praktična kontrola izvedbe, ali so npr. mesta<br />
namestitve in je izbira svetilk in sijalk skladna z zahtevami projekta. Če ugotovimo bistvene napake<br />
ali odstopanja, je naslednji korak ugotovitev, da so potrebni ukrepi. Po korekcijah in izvedbi ukrepov<br />
se preverjanje vrne na stopnjo prvega koraka.<br />
Če so glavni podatki v projektu o stopnji bleščanja, kakovosti podajanja barv, barvni temperaturi<br />
ipd. pravilno izbrani in če namestitev, izbira svetilk, senčnikov ipd. ustreza zahtevam projekta,<br />
naredimo naslednji korak: mersko in računsko kontrolo osvetljenosti ter enakomernosti osvetljenosti<br />
na območju vidne naloge in neposredne okolice. Če so rezultati skladni z zahtevami standarda,<br />
“Lighting Engineering 2006” stran 143
R-16 “Razsvetljava delovnih mest”<br />
preverimo v naslednjem koraku, ali morda zaposleni oz. uporabniki delovnega prostora nimajo<br />
pripomb na razsvetljavo. Če pripomb ni, zaključimo preiskavo z ugotovitvijo skladnosti z zahtevami.<br />
Če ugotovimo pritožbe zaposlenih, so potrebne dodatne zahtevnejše preiskave, ki naj ne<br />
vključujejo samo tehničnih parametrov, ampak preko pooblaščenega zdravnika tudi vid zaposlenih. S<br />
temi preiskavami se ugotovi morebitne vzroke problemov in se predlaga primerne rešitve in ukrepe.<br />
Preiskava pa se nadaljuje spet v eni od prejšnjih stopenj v odvisnosti od vrste pomanjkljivosti.<br />
Pri tem je treba opozoriti tudi na navedbo standarda, da zahteve veljajo za običajne razmere. Če<br />
razmere niso običajne, če imamo npr.opravka s slabo vidnimi predmeti dela, slabovidnimi ali<br />
starejšimi delavci, posebno hudimi posledicami v primeri napačne vidne zaznave predmetov dela<br />
ipd., je treba v smislu standarda osnovne zahteve standarda temu ustrezno in utemeljeno prilagoditi.<br />
Razsvetljava v izjavi o varnosti z oceno tveganja<br />
Izjava o varnosti z oceno tveganja je temeljni dokument, ki dokazuje staje varnosti pri delu,<br />
opozarja na posebne nevarnosti in škodljivosti in navaja potrebne korektivne ukrepe. Ena od možnih<br />
nevarnosti je tudi razsvetljava. Strnjeni povzetki rezultatov preiskav razsvetljave morajo biti zato<br />
primerno razvidni tudi v izjavi o varnosti z oceno tveganja v takšni obliki, ki je skladna z oceno<br />
drugih nevarnosti in škodljivosti pri delu.<br />
Navada je, da se v izjavi o varnosti z oceno tveganja ugotovljena »stopnja tveganja« po<br />
pomembnosti označuje z 1 do 5, pri čemer pomeni 1 nevtralno, nenevarno, neškodljivo stanje, kot si<br />
ga želimo, stopnja nad 4 pomeni odstopanje od predpisov, torej stanje, kjer so obvezni ukrepi, 5 pa<br />
pomeni kritično stanje, kjer so posledice neupoštevanja ukrepov lahko težke ali usodne. Stopnja 3<br />
pomeni, da je nevarnost ali škodljivost sicer še sprejemljiva, vendar je na meji sprejemljivega in zato<br />
zahteva pozornejši nadzor, stopnja 2, ki pri razsvetljavi ni smiselna, pa opozarja na nevarnost ali<br />
škodljivost, čeprav je stanje brez dvoma v sprejemljivih mejah.<br />
Zaradi skladnosti z drugimi škodljivostmi po omenjenem principu lahko priredimo tudi<br />
rezultatom preiskav razsvetljave tako imenovano »stopnjo obremenitve« SO, ki po vrednostih ustreza<br />
razredom tveganja po zahtevah izjave o varnosti. Pri preiskavah in ugotovitvah o ustreznosti<br />
razsvetljave v delovnem okolju lahko ugotovitvam priredimo vrednost SO po naslednji shemi:<br />
SO: 1 3 4 5<br />
ustreza<br />
kriterijem:<br />
ustreza vsem<br />
zahtevam<br />
pravilnika in<br />
standarda<br />
ustreza E DM,u ;<br />
druge zahteve niso<br />
izpolnjene ali niso<br />
znane<br />
ne ustreza E DM,u ;<br />
ne ustrezajo drugi<br />
parametri;<br />
pritožbe zaposlenih<br />
nevarno;<br />
hude pritožbe<br />
zaposlenih<br />
Opozoriti je treba, da, čeprav standard navaja naravno osvetljenost kot temeljno, od prenehanja<br />
veljavnosti JUS U.C9.100 8 nimamo določil o zahtevah za naravno razsvetljavo delovnih mest. Torej<br />
določil, do kdaj naravna osvetljenost na delovnem mestu zadošča in kdaj jo je treba dopolniti ali<br />
nadomestiti z umetno. Za minimalno naravno osvetljenost na delovnih mestih se morebiti lahko<br />
začasno, dokler ni boljšega pravila, sklicujemo na določilo prejšnjega standarda 8 , ki je vseboval<br />
pravilo, da mora koeficient dnevne osvetljebnosti, ki ga na terenu določamo z meritvijo, zagotavljati<br />
pri 5000 lx horizontalne zunanje osvetljenosti vsaj polovico zahtevane umetne osvetljenosti s<br />
sijalkami. Minimalno to umetno osvetljenost pa določa standard.<br />
stran 144 Posvetovanje “Razsvetljava 2006”
“Obvezna ali prostovoljna uporaba standardov za razsvetljavo pri delu” R-16<br />
Sklep<br />
Dejstvo je, da je trenutno področje predpisov o zahtevah za umetno razsvetljavo na delovnih<br />
mestih očitno precej dinamično. Nastane vprašanje, ali naj pustimo zato, ker so na voljo včasih šele<br />
osnutki standardov, npr. z oznako pr, FDIS, OSIST ipd., določeno področje neregulirano, ali pa naj<br />
vire, kakršne pač imamo, kljub temu upoštevamo, čeprav še niso dokončno dodelani. Brez dvoma je<br />
škoda, če je področje popolnoma neurejeno, lahko večja, kot če se ravnamo po predlogih, ki se<br />
navadno z manjšimi dopolnitvami dopolnijo v končno obliko. To je bila tudi dilema pri slovenskih<br />
standardih za umetno razsvetljavo na delovnih mestih. Odločili smo se za prvo možnost in smo<br />
opozorili strokovnjake, ki načrtujejo ali nadzorujejo razsvetljavo, na trenutno veljavne predloge oz.<br />
osnutke. Da tega nismo naredili močno napačno, dokazuje, da npr. pri razsvetljavi, ki jo določa novi<br />
samostojni standard EN ISO/FDIS 8995-2:2005 10 , ni vsaj za razsvetljavo na prostem veliko ali<br />
pomembnih razlik od prvotnega prEN 12464-2. Zadnja izdaja standarda 10 definira nekatere nove<br />
veličine, kot je različnost (diversity E min /E max ), določa pas neposredne okolice okrog mesta dela na<br />
širino 2 m, dodaja nekaj pojasnil (za bleščanje), nekatere pogoje za ne-cestno razsvetljavo ipd.<br />
Večinoma pa so zahteve za razsvetljavo, kot je vzdrževana osvetljenost in drugi parametri ostale<br />
pretežno enake z manjšimi popravki. Dodana pa je pri standardu za zunanjo razsvetljavo še<br />
minimalna dopustna enakomernost osvetljenosti (U 0 =E min /E ev ).<br />
Stvar tehničnih komisij pri SIST-u je proučiti in umakniti dosedanje verzije standardov vrste<br />
12464 in jih nadomesti z novimi, veljavnimi v EU. S opisano sprejeto formulacijo v pravilniku o<br />
zahtevah za delovna mesta pa bojo kot obvezni obveljali novo sprejeti ustrezni SIST-i, ne da bi bila<br />
potrebna sprememba pravilnika. Dotlej veljata formalno trenutni verziji. Kljub vsemu bo delo pri<br />
uporabi novih standardov lažje, ker smo preko prejšnjih že dobro seznanili z načeli, pa tudi, kar ni za<br />
zanemariti, imamo poslovenjeno nomenklaturo delovnih mest oz. opravil. Čeprav smo formalno sicer<br />
dolžni do spremembe uporabljati sedaj veljavne standarde, je smiselna tam, kjer so razlike v<br />
primerjavi z novostjo, tudi vsaj v obliki komentarja ustrezna pripomba in navedba nove zahteve.<br />
Viri<br />
1. Zakon o standardizaciji, Ur.l. RS 59/99<br />
2. Pravilnik o spremembah in dopolnitvah Pravilnika o zahtevah za zagotavljanje varnosti<br />
in zdravja delavcev na delovnih mestih, Ur.l. RS 39/2005<br />
3. SIST EN 12464-1, Lighting applications – Lighting on Workplaces – Part 1: Indoor<br />
workplaces<br />
4. OSIST prEN 12464-2, Lighting applications – Lighting on Workplaces – Part 1: Outdoor<br />
workplaces<br />
5. OSIST prEN 12464:2003, Lighting applications – Lighting on Workplaces<br />
6. Neumüller S., Planinšek V. idr., Notranja razsvetljava in vzdrževanje sistemov notranje<br />
razsvetljave, 2. izdaja, Priporočila SRD, Pr4/1,Pr4/2, Maribor, 2004<br />
7. Gspan P., Žebovec S., Zahteve za razsvetljavo pri delu in standard 12464, ZVD, zv. 137,<br />
Ljubljana, 2006<br />
“Lighting Engineering 2006” stran 145
R-16 “Razsvetljava delovnih mest”<br />
8. JUS U.C9.100, Ur.SFRJ, 48/62<br />
9. Pravilnik o preiskavah delovnega okolja, pregledih in preizkusih sredstev za delo,<br />
Ur.l. RS 35/1988<br />
10. EN ISO/FDIS 8995-2:2005, Lighting in workplaces – Part 2: Outdoor<br />
Avtorjev naslov:<br />
Primož Gspan<br />
Na Jami 11<br />
Ljubljana<br />
stran 146 Posvetovanje “Razsvetljava 2006”
“Problem uporabe LED svetil v tiskarni” R-17<br />
Gorazd Golob, Marta Klanjšek Gunde, Marko Jankovec, Jure Ahtik, Matej Vaupotič<br />
PROBLEM UPORABE LED SVETIL V TISKARNI<br />
Povzetek<br />
V tem delu objavljamo prve rezultate raziskave problemov uporabe<br />
alternativnih svetil za razsvetljavo svetlobnih kabin oz. pultov za kontrolo barv<br />
v tiskarni. Na osnovi 14 vzorcev barv, odtisnjenih na različne tiskovne materiale<br />
smo določali posebni indeks metamerije in ugotovili kritične materiale in barve<br />
za reproduciranje.<br />
Meritve s spektroradiometrom smo opravili pri osvetlitvi vzorcev z LED in<br />
halogensko svetilko, v teku pa so še meritve pri osvetlitvi z navadno voframovo<br />
žarnico, “varčno žarnico” in fluorescentnimi svetilkami. Rezultati prvih meritev<br />
potrjujejo navedbe v literaturnih virih glede spektralnih značilnosti svetlobe,<br />
prisotnost metamerije in neznačilne anomalije predvsem v modrem in rdečem<br />
delu spektra (slika1). Posebni indeks metamerije (na osnovi 14 vzorcev) pri<br />
svetlobi halogenskega in belega LED svetila tako znaša 3,1, barvna razlika<br />
∆Eab* barv v modrem in rdečem področju in papirja pa je od 4,2 do 5.<br />
Zaradi precejšnje razlike v lastnostih obeh svetlob, predvsem CCT, indeksa<br />
barvnega videza (CRI) in osvetljenosti vzorcev, bodo končni rezultati objavljeni<br />
šele po dodatnih meritvah z medsebojno bolj primerljivimi viri, ki bodo<br />
opravljene v avgustu 2006.<br />
Ključne besede: halogenska svetilka, LED, indeks barvnega videza (CRI),<br />
spekter, anomalije.<br />
“Lighting Engineering 2006” stran 147
R-17 “Razsvetljava delovnih mest”<br />
Slika1: Spektri 14 barvnih vzorcev, belega papirja in referenčnega standarda pri osvetlitvi s halogensko<br />
svetilko (levo) in belo LED svetilko (desno).<br />
Naslovi avtorjev:<br />
Gorazd Golob 1 , Marta Klanjšek Gunde 2 , Marko Jankovec 3 , Jure Ahtik 1 , Matej Vaupotič 1<br />
1 Univerza v Ljubljani, Naravoslovnotehniška fakulteta<br />
2 Kemijski inštitut, Ljubljana<br />
3 Univerza v Ljubljani, Fakulteta za elektrotehniko<br />
stran 148 Posvetovanje “Razsvetljava 2006”
“ Vpliv osvetljenih površin na svetlobno onesnaženje” R-18<br />
Andrej Orgulan, Tomaž Slatinek<br />
VPLIV OSVETLJENIH POVRŠIN NA SVETLOBNO ONESNAŽENJE<br />
Povzetek<br />
Svetlobno onesnaženje zajema širok spekter vplivov razsvetljave na<br />
okolico. Zatem, ko je dozorelo spoznanje, da je te vplive potrebno<br />
nadzirati in omejevati, se je pojavila nova težava – kakšni kriteriji in<br />
metode za njihovo vrednotenje bi bili najbolj smiselni in učinkoviti v<br />
praksi. Za vrednotenje vplivov cestne razsvetljave, katere delež pri<br />
skupnih svetlobnih emisijah je znaten, je predlagana metoda t.i. škatle, ki<br />
bi omogočala izračun vplivov z obstoječimi programskimi orodji.<br />
Pomanjkljivost takšnega pristopa je v tem, da izgubimo podatek o smeri<br />
izsevane svetlobe, kar je eden od bistvenih podatkov za objektivno<br />
vrednotenje. Druga pomanjkljivost obstoječih orodij je približno<br />
računanje z reflektiranimi deleži svetlobe, saj so npr. podatki za cestne<br />
površine standardizirani za popolnoma drugačne razmere izračuna. V<br />
tem prispevku je prikazana metoda, ki upošteva te pomanjkljivosti ter<br />
rezultati izračunov za nekatere tip cestne razsvetljave.<br />
Abstract<br />
Light pollution consist of various influences of light emissions.<br />
Awareness, that this impact should be monitored and reduced has<br />
matured in recent years. But new problem turned up: what are the<br />
criteria and suitable estimation methods for evaluation of impact. For<br />
influence of the road lighting on light pollution “shoe box method” has<br />
been proposed, because it can be used with existent computer tools,<br />
without modifications. This approach has obvious deficiency – the results<br />
doesn’t show the angle of emitted light, which is crucial data for light<br />
pollution evaluation. Another limitation of existent computer programs is<br />
calculation with reflected portion of light. Road surfaces are standardized<br />
in various reflection classes, but for different calculation approach. In<br />
this paper, method for taking these aspects into account is discussed, and<br />
some results, showing influence of various street luminaires are<br />
presented.<br />
“Lighting Engineering 2006” stran 149
R-18 “Razsvetljava v praksi”<br />
1. Uvod<br />
Vsa zunanja razsvetljava lahko povzroča svetlobno onesnaženje, vendar bo povprečen<br />
opazovalec najprej opazil cestno in ulično razsvetljavo. Razlog za to je, da je cestna<br />
razsvetljava v zemljepisnem smislu povsod daleč najbolj razširjena in je prisotna tako v<br />
mestnem kot tudi v ruralnem področju. Za razliko od npr. razsvetljave reklamnih panojev, ki je<br />
omejena predvsem na gosto poseljena mestna področja.<br />
Drug odmeven primer neprimerne razsvetljave je mnogokrat razsvetljava kulturnih<br />
znamenitosti, ki je mnogokrat neprofesionalno izvedena in pri kateri gre dobršni del svetlobe<br />
mimo objekta razsvetljave naravnost v nebo<br />
Te vplive razsvetljave na svetlobno onesnaženje lahko bistveno zmanjšamo z dobrim<br />
načrtovanjem razsvetljave. Ne moremo pa bistveno zmanjšati deleža reflektirane svetlobe, ki<br />
se odbije v prostor od teh osvetljenih površin. V tem prispevku bo prikazan delež vpliva zaradi<br />
takšnih osvetljenih površin, nekatere omejitve in težave, s katerimi se srečujemo pri takšnih<br />
izračunih in predlogi nekaterih rešitev.<br />
2. Refleksijske lastnosti vozišč<br />
Na osnovi dosegljivih podatkov sl. 1 [1] se manj kot 10 % svetlobe odbije nazaj v prostor,<br />
kar pomeni, da tudi cesta z zastrtimi svetilkami, ki same po sebi ne sevajo v prostor nad<br />
horizontalo, povzroča svetlobno onesnaževanje v velikosti do 10 % inštaliranega svetlobnega<br />
toka. Pri svetlejših (betonskih) voznih površinah je odbite svetlobe več (do 20 %), pri<br />
temnejših pa manj.<br />
REFLEKSIJA [%].<br />
25<br />
20<br />
15<br />
10<br />
5<br />
NOV ASFALT<br />
ZVOŽEN ASFALT<br />
BETON<br />
0<br />
0 20 40 60 80<br />
KOTI GAMA [°]<br />
Slika 1: Refleksije svetlobe na asfaltu in betonu v odvisnosti od vpadnega kota<br />
Pri projektiranju cestne razsvetljave se moramo držati predpisanih vrednosti svetlosti<br />
cestišča, zato temna cestišča potrebujejo večjo osvetljenost, da dosežemo želeno svetlost.<br />
Postopek izračuna odbite svetlobe s pomočjo q-telesa in tudi r-tabel ima to pomanjkljivost,<br />
da je možno po tej metodi izračunati samo odboj v smeri opazovalca (α = 1°) (sl. 2.). Ta kot ene<br />
stran 150 Posvetovanje “Razsvetljava 2006”
“ Vpliv osvetljenih površin na svetlobno onesnaženje” R-18<br />
stopinje je vezan na udeležence v prometu, katerim je ta razsvetljava namenjena in ti pod tem<br />
kotom opazujejo cesto pred seboj [3]. Oblika q-telesa označuje refleksijske lastnosti<br />
površinskega sloja nekega cestišča. Telesa podolgovate oblike so značilna za gladke površine<br />
vozišč; telesa bolj polkrogelne oblike pa definirajo bolj grobe (difuzno refleksiraloče) površine<br />
vozišč. q-telo lahko prikažemo tudi kot polkroglo s premerom q 0 , ki ima enak volumen kot q-<br />
telo. Polmer te polkrogle določa srednjo vrednost svetlosti q-telesa in ga zato imenujemo<br />
srednji koeficient svetlosti (q 0 ). Popolnoma difuzno refleksirajoči del q-telesa pa ustreza<br />
polmeru q min . Koeficient svetlosti ki v q-telesu ponazarja vertikalni vpad svetlobe, označujemo<br />
s q p in ga uporabljamo pri določitvi zrcalnih lastnosti vozišč.<br />
Slika 2: Oblika q telesa in odboj svetlobe na cestišču<br />
Odboj svetlobe na različnih podlagah je prikazan na sliki 3. Vidimo, da gre na suhi novi<br />
vozni površini (z grobo teksturo) za bolj difuzni odboj (R1 refleksijski razred), pri zvoženi<br />
cesti za kombinacijo difuznega in zrcalnega odbija (R3 refleksijski razred), pri mokri cesti pa<br />
za zrcalni odboj (W1 refleksijski razred).<br />
nova vozna površina zvožena vozna površina mokra vozna površina<br />
Slika 3: Odboj svetlobe na različnih podlagah<br />
“Lighting Engineering 2006” stran 151
R-18 “Razsvetljava v praksi”<br />
2. Matematični model odboja svetlobe<br />
Svetlobni tok, ki vpada na gladko površino, se deloma absorbira, deloma pa se odbije, pri<br />
čistem zrcalnem odboju (sl. 4) pod odbojnim kotom, ki je enak vpadnemu, le zrcaljen preko<br />
normale na ravnino (Ω vp = Ω od ).<br />
Slika 4: Čisti zrcalni odboj<br />
Slika 5: Zrcalni odboj<br />
Ker pa vsaka realna površina odboj nekoliko razprši okoli odbojnega kota, vzamemo za<br />
razpršitev empirično določen parameter, ki je kosinus na potenco ns kota Θ med zrcalno<br />
odbojnim vektorjem R in vektorjem opazovanja V (sl. 5).<br />
stran 152 Posvetovanje “Razsvetljava 2006”
“ Vpliv osvetljenih površin na svetlobno onesnaženje” R-18<br />
I<br />
od<br />
⋅Ω<br />
do<br />
= I<br />
vp<br />
⋅Ω<br />
vp<br />
( γ )<br />
ns A⋅cos<br />
ns<br />
⋅ ks ⋅cos ( Θ)<br />
≅ Ivp<br />
⋅ ⋅ks<br />
⋅cos<br />
( Θ)<br />
2<br />
R<br />
vp<br />
(1)<br />
Želimo izračunati odbiti svetlobni tok<br />
enačbo :<br />
2<br />
vp<br />
⎜<br />
⎛φ ⎟<br />
⎞<br />
od<br />
v točno določen del kupole, uporabimo<br />
⎝ s(v) ⎠<br />
( γ )<br />
Ap<br />
⋅ cos<br />
ns S<br />
φ<br />
od<br />
= I<br />
( cos( ))<br />
S (v) od<br />
⋅ Ω<br />
S (v) od<br />
≅ I<br />
S (v) vp<br />
⋅ ⋅ ks ⋅ Θ ⋅<br />
(2)<br />
R ⋅ 2π<br />
R<br />
Ostane nam še edino določitev parametra (potence) ns. Parameter ns vpliva na porazdelitev<br />
zrcalnega dela odboja. Možne nastavitve parametra n so od 1 do ∞. Pri n = 1 je porazdelitev v<br />
obliki krogle, pri n > 1 je porazdelitev v obliki rotosimetrične elipse, ki rotira okoli premice<br />
skozi gorišči, ki ležita na premici na kateri leži vektor odboja R. Z večanjem potence n se veča<br />
razdalja med goriščema elipse ali z drugimi besedami elipsa se oža vse do ns = ∞ pri katerem<br />
pridemo do čistega zrcalnega odboja (sl. 4.6). Pri čistem zrcalnem odboju iz enačbe (2) odpade<br />
1 in odbojni kot je enak vpadnemu, zato je potrebno z večanjem ns večati tudi refleksijski<br />
2π<br />
parameter za zrcalni odboj ks, da odbiti svetlobni tok z večanjem ns ostane enak.<br />
Kosinus na ns kota med zrcalno odbojnim vektorjem in vektorjem opazovanja ( cos ( Θ)<br />
) ns<br />
lahko zaradi hitrejšega delovanja programa zamenjamo z skalarnim produktom med enotskim<br />
vektorjem zrcalno odbojnega vektorja in enotskim vektorjem v smeri opazovalca na enako<br />
potenco (R*V') ns .<br />
( v)<br />
2<br />
od<br />
ns = 1 ns > 1 ns = ∞<br />
I vp I od I vp I od I vp I od<br />
Slika 6: Vpliv parametra n na porazdelitev odboja<br />
3. Izračuni in komentar rezultatov<br />
Za primer izračuna vzamemo 100 metrov dolgo in 15 metrov široko cesto, kamor<br />
postavimo tri svetilke na 15, 50 in 85 metrov po širini pa na 5 metrov. Za svetilke izbermo<br />
svetilko »SITECO 5NA 393 E-1PT03GB ST 100 (33338_1.ldt)« s svetlobnim tokom 16500<br />
lm, ki spada v razred bleščanja G2 (polzastrta svetilka). Refleksijske parametre sem določil<br />
kot:<br />
kd = 0.01 ; kd je refleksijski faktor za difuzni del odboja<br />
ks = 0.15 ; ks je refleksijski faktor za zrcalni del odboja<br />
“Lighting Engineering 2006” stran 153
R-18 “Razsvetljava v praksi”<br />
ns = 10 ; večji kot je ns ožje je polje zrcalnega odboja<br />
Povprečna horizontalna osvetljenost je bila v tem primeru 16 lx, minimalna horizontalna<br />
osvetljenost 6,96 lx in razmerje enakomernosti 0,43, kar je skladno z zahtevami. Odbiti<br />
svetlobni tok je bil v tem primeru 552 lm, svetlobni tok direktno proti kupoli 312 lm, kar je<br />
skupaj 864 lm in to je 1.75 % oddanega svetlobnega toka treh svetilk.<br />
Porazdelitev svetilnosti odboja v prostor (kupolo), ki je postavljena nad cesto je prikazana<br />
na sliki 7. Svetilnost v [cd] je predstavljena tudi v barvni lestvici zraven grafa. na sliki 8 je<br />
prikazana kupola nad cesto. Svetlejši deli grafa predstavljajo večji svetlobni tok v tej tisti<br />
smeri. Svetilnost v [cd] je predstavljena tudi v barvni lestvici zraven kupole.<br />
Slika 7: Postavitev in orientacija kupole nad cestiščem<br />
porazdelitev odboja svetilnosti v prostor [cd]<br />
140<br />
1<br />
0.5<br />
0<br />
1<br />
120<br />
100<br />
0.5<br />
80<br />
0<br />
0.5<br />
1<br />
60<br />
-0.5<br />
0<br />
dolžina cestišca [m]<br />
-1<br />
-1<br />
-0.5<br />
širina cestišca [m]<br />
40<br />
Slika 8: Porazdelitev odboja svetlobe v kupolo<br />
stran 154 Posvetovanje “Razsvetljava 2006”
“ Vpliv osvetljenih površin na svetlobno onesnaženje” R-18<br />
Iz tabele 1 je razvidno, da je razlika med zastrto svetilko »SITECO 5NA 393 E-1PT02GB ST<br />
100 (33344_1.ldt)« in polzastrto svetilko »SITECO 5NA 393 E-1PT01GB ST 100 (33338_1.ldt)« v<br />
svetlobnem onesnaževanju največ en odstotek, kar je zelo malo, saj smo pričakovali večjo<br />
razliko. Preseneti nas tudi direktni vpad svetlobe v kupolo pri polzastrti svetilki »SITECO 5NA<br />
393 E-1PT01GB ST 100 (33338_1.ldt)«, saj bi pričakovali, da bo večji vsaj 5 %, kot je navedeno v<br />
[5]. To seveda velja le, če svetilka ni rotirana v x ali y smeri, ker je v tem primeru direktni<br />
svetlobni tok proti kupoli znatno večji<br />
Tabela 1: Primerjava odboja svetlobe pri dveh različnih svetilkah<br />
svetilka kd ks ns Φ od [%] Φ d [%] Φ od + Φ d [%]<br />
33338_1.ldt (polzastrta) 0,1 0 10 5,028 % 0,63 % 5,658 %<br />
33344_1.ldt (zastrta) 0,1 0 10 4,817 % 0 % 4,817 %<br />
33338_1.ldt (polzastrta) 0 0,5 10 3,564 % 0,63 % 4,194 %<br />
33344_1.ldt (zastrta) 0 0,5 10 3,983 % 0 % 3,983 %<br />
33338_1.ldt (polzastrta) 0,02 0,2 10 3,066 % 0,63 % 3,696 %<br />
33344_1.ldt (zastrta) 0,02 0,2 10 2,772 % 0 % 2,772 %<br />
33338_1.ldt (polzastrta) 0,018 0,22 10 3,043 % 0,63 3,673 %<br />
33344_1.ldt (zastrta) 0,018 0,22 10 2,754 % 0 % 2,754 %<br />
33338_1.ldt (polzastrta) 0,05 0,2 10 5.539 % 0,63 % 6,169 %<br />
33344_1.ldt (zastrta) 0,05 0,2 10 4,99 % 0 % 4,99 %<br />
33338_1.ldt (polzastrta) 0,05 0,5 10 7,667 % 0,63 % 8,296 %<br />
33344_1.ldt (zastrta) 0,05 0,5 10 6,931 % 0 % 6,931 %<br />
4. SKLEP<br />
Namen tega dela je bil ugotoviti kolik del svetlobe se odbije od voznih površin in v katero<br />
smer, ter ali na to vpliva izbira svetilke.<br />
Da bi lahko ocenili svetlobno onesnaževanje smo naredil program za izračun odboja<br />
svetlobe na cestnih površinah, ki omogoča poljubno izbiro svetilk cestne razsvetljave, njihovo<br />
poljubno namestitev in orientacijo v prostoru, ter izračuna porazdelitev odbite svetlobe v<br />
prostor. Ugotovimo, da dajo najboljše rezultate svetilke z ravnim steklom, se pravi popolnoma<br />
zastrte svetilke. Te svetilke torej manj bleščijo in ne povzročajo velikega svetlobnega<br />
onesnaževanja. Prav tako lahko ocenimo, da te svetilke ne dajejo slabše enakomerne<br />
osvetljenosti cestišča, kar lahko preverimo v komercialnih programih.<br />
Za popolni nadzor nad svetlobnim onesnaženjem potrebujemo vse možne podatke, ki jih<br />
lahko pridobimo in ustrezno programsko opremo, ki nam bo dala vse potrebne rezultate.<br />
Škatelna metoda nam teh rezultatov ne daje, zato moramo pritisniti na razvijalce komercialnih<br />
“Lighting Engineering 2006” stran 155
R-18 “Razsvetljava v praksi”<br />
programskih paketov, da bodo v izračune vključili tudi porazdelitev odbite svetlobe v prostor,<br />
kar je enostavno z minimalnimi modofikacijami obstoječih programov.<br />
Večja težava je pridobitev in standardizacija refleksijskih parametrov asfaltnih (in drugih)<br />
površin, saj so ti podatki nujno potrebni za natančnejše izračune. Težave tukaj niso omejene<br />
samo na meritve, ampak tudi na interpretacijo teh meritev, saj je govora o izredni količini<br />
podatkov, ki jih je treba pripraviti na čimbolj učinkovit način.<br />
5. Viri<br />
1. Leon Kos, Distribuirani sistem za upodabljanje tridimenzionalnih objektov,<br />
Pridobljeno 7. 6. 2005 iz http://www.lecad.uni-lj.si/~leon/distray/node2.html<br />
2. P. Podlipnik: Svetlobno tehnični priročnik, ČGP Delo, Ljubljana, 1978<br />
3. H. j. Hentschel: Licht und Beleuchtung, CIP-Kurtztitelaufnahme der Deutschen<br />
Bibliothek, 1987<br />
4. Laurence T. Maloney Physics-Based Approaches to madeling Surface Color<br />
Perception, Pridobljeno 15. 10. 2005 iz<br />
http://www.psych.nyu.edu/maloney/MaloneyColorCambridgeUP1999.pdf<br />
5. P. Ronbouts: Precise Evaluation of Upward Flux from Outdoor Lighting Installations<br />
(applied in the case of roadway lighting), La Serena (Chile) Light Pollution<br />
Symposium, March 2002<br />
6. Priporočila <strong>SDR</strong> cestna razsvetljava, Slovensko društvo za razsvetljavo / <strong>SDR</strong>,<br />
Maribor, 2000<br />
7. M. Bizjak, Cestna razsvetljava – pregled nekaterih pomembnejših raziskav in spoznanj<br />
ter izzivi za prihodnost, Razsvetljava 2005 – zbornik, Maribor 2005, Slovensko društvo<br />
za razsvetljavo / <strong>SDR</strong>, Maribor 2005<br />
Naslov avtorja:<br />
mag. Andrej Orgulan, Tomaž Slatinek<br />
Fakulteta za elektrotehniko, računalništvo in informatiko,<br />
Univerza v Mariboru<br />
andrej.orgulan@uni-mb.si<br />
stran 156 Posvetovanje “Razsvetljava 2006”
“Meritev odsevnosti cestnih površin” R-19<br />
Primož Puhar, Grega Bizjak<br />
MERITEV ODSEVNOSTI CESTNIH POVRŠIN<br />
Povzetek:<br />
V članku je predstavljena naprava za merjenje odsevnosti cestnih površin in<br />
ustrezen postopek meritve. Rezultati meritev podajajo kotno porazdelitev<br />
odsevnosti obravnavane cestne površine za različne vpadne kote svetlobe in so<br />
podani tako tabelarično kot grafično. Z njihovo pomočjo je možno izdelati<br />
matematični model odsevnosti, ki ga lahko uporabimo v izračunih odsevanega<br />
svetlobnega toka in tako ocenimo primernost materiala cestne površine v<br />
kombinaciji s cestno svetilko s stališča svetlobnega onesnaževanja nočnega<br />
neba. Napravo lahko uporabimo tudi za meritve odsevnosti drugih površin.<br />
Poleg same konstrukcije in delovanja naprave so v članku predstavljene tudi<br />
njene omejitve ter napotki za ustrezno izvedbo meritev.<br />
Ključne besede: odsevnost cestnih površin, meritve odsevnosti, svetlobno<br />
onesnaženje,<br />
Abstract:<br />
In the paper the device for measuring the road surface reflectance is<br />
presented together with the measuring procedure. The results give angular<br />
distribution of reflectance of road surface under investigation for different light<br />
incident angles and are presented in tables and graphs. With the help of<br />
obtained results it is possible to produce mathematical model of reflectance,<br />
which can be used for calculation of reflected luminous flux and so for the<br />
evaluation of road surface in combination with street luminaire from the ‘night<br />
sky light pollution’ point of view. The device can also be used for measurement<br />
of reflectance of other surfaces. Beside the construction and the operation of the<br />
device also its limits are present together with some directives for its successful<br />
use.<br />
Keywords: road surface reflectance, measurement of reflectance, light<br />
pollution<br />
“Lighting Engineering 2006” stran 157
R-19 “Razsvetljava v praksi”<br />
1. Uvod<br />
Zadnja leta je aktualna tema svetlobno onesnaženje, ki je posledica uhajanja svetlobnega toka v<br />
nebo. Glavne posledice svetlobnega onesnaženja so astronomske, biološke, ekonomske ter varnostne.<br />
Znane so rešitve z zmanjšanjem svetilnosti svetil ter njihovim zastiranjem. Čeprav je direkten<br />
svetlobni tok prevladujoč, svetlobno onesnaženje povzroča tudi svetlobni tok odbit od osvetljene<br />
površine.<br />
Da bi zmanjšali svetlobno onesnaženje kot posledico odseva, potrebujemo kvantitativno oceno<br />
odseva svetlobe od osvetljene površine. To oceno lahko dobimo iz kotne porazdelitve odsevnosti<br />
površine. Omenjeno karakteristiko je možno izmeriti z merilno napravo, opisano v nadaljevanju<br />
članka.<br />
Iz poznane kotne porazdelitve odsevnosti je možno izdelati matematični model odsevnosti<br />
površine, ki ga lahko skupaj z modelom svetila uporabimo v računalniških simulacijah. Rezultati<br />
simulacij nam tako omogočajo tudi pridobitev informacij o odsevani svetlobi, ki jih skupaj z<br />
informacijami o svetlosti oziroma osvetljenosti cestišča potrebujemo za pravilno izbiro rešitve cestne<br />
razsvetljave.<br />
2 Kotna porazdelitev odsevnosti površine<br />
Odsevnost površine podaja delež svetlobnega toka, ki se odbije od opazovane površine, kotna<br />
porazdelitev odsevnosti površine pa delež svetlobnega, ki se od osvetljene površine odbije v določeni<br />
smeri. Za začetek predpostavimo, da svetlobni vir osvetljuje površino pod vpadnim kotom α. Zaradi<br />
odsevnosti površine se vpadni svetlobni tok odbije, zaradi njenih odsevnih lastnosti (hrapavosti) pa tudi<br />
neenakomerno razprši v prostor. To lahko opazimo kot razlike v svetlosti površine, če jo opazujemo pod<br />
različnimi koti. Ko izmerimo svetlost pri različnih odbojnih kotih β, dobimo kotno porazdelitev<br />
odsevnosti pri določenem vpadnem kotu α. Celotno kotno porazdelitev svetlosti pa dobimo, ko meritev<br />
ponovimo z različnimi vpadnimi koti svetlobe α.<br />
Po definiciji podaja odsevnost površine ρ [-] razmerje med vpadlim in odsevanim svetlobnim tokom.<br />
ρ = Φ odsevani /Φ vpadli<br />
Pri difuznih površinah pa lahko odsevnost podamo tudi z razmerjem med svetlostjo površine L<br />
[cd/m 2 ] in osvetljenostjo te iste površine E [lux = lm/m 2 ] in sicer s pomočjo spodnjega izraza, kjer je<br />
Ω 0 enota prostorskega kota:<br />
ρ = π . Ω 0 . (L/E)<br />
Omenili smo že, da je osvetljena površina različno svetla pod različnimi vpadnimi in odsevnimi<br />
koti. Različne vrednosti svetlosti lahko združimo v funkcijo kotne porazdelitve svetlosti L (α, β), ki<br />
ima dva parametra: vpadni (α) in odsevni (β) kot. Kadar se tudi osvetljenost spreminja s spremembo<br />
vpadnega kota, pa lahko to opišemo s funkcijo kotne porazdelitve E (α) z vpadnim kotom (α) kot<br />
parametrom.<br />
stran 158 Posvetovanje “Razsvetljava 2006”
“Meritev odsevnosti cestnih površin” R-19<br />
Ker izračunavamo odsevnost kot kvocient dveh funkcij, kjer ima svetlost parametra α in β,<br />
osvetljenost pa parameter α, dobimo tudi odsevnost površine kot funkcijo dveh parametrov α in β.<br />
ρ (α, β) = π . Ω 0 . (L (α, β) / E (α))<br />
Če za izvedbo meritve uporabimo svetilo s konstantno svetilnostjo skozi celotno meritev, lahko<br />
funkcijo porazdelitve osvetljenosti E (α) razbijemo na produkt:<br />
E (α) = E 0 * cos(α) ,<br />
kjer je E 0 osvetljenost površine, kadar je nameščena pravokotno na vir svetlobe (α = 0°). Kotna<br />
porazdelitev odsevnosti postane torej enaka:<br />
ρ (α, β) = π . Ω 0 . (L (α, β) / E 0 * cos(α)) .<br />
Meritev kotne porazdelitve odsevnosti v tem primeru torej lahko izvedemo s pomočjo meritve<br />
kotne porazdelitve svetlosti.<br />
3 Naprava za meritev kotne porazdelitve svetlosti (odsevnosti)<br />
Naprava za merjenje kotne porazdelitve svetlosti je sestavljena iz izvora svetlobe (reflektorja<br />
oziroma sončnega simulatorja), fotometrične klopi, merilnika osvetljenosti, merilnika svetlosti ter<br />
nosilca za merjenec. Naprava, ki smo jo izdelali, je prilagojena je za valjaste merjence premera<br />
100mm.<br />
Izvor svetlobe je vpet statično. Razdalja do merjenca se lahko spreminja in znaša od 2 do 3 metre.<br />
Vzorec in merilnik osvetljenosti sta vpeta v osi, ki omogoča zasuk od 0° do 90° glede na svetilo. Za<br />
izvor svetlobe je uporabljen reflektor, torej vir usmerjene svetlobe, z ozkim svetlobnim snopom, ki<br />
pa je dovolj širok, da pokrije tako merjenec kot tudi glavo merilnika osvetljenosti v njegovi<br />
neposredni bližini nekaj centimetrov nad njim. Zaradi ozkega snopa svetlobe lahko na omenjeni<br />
razdalji smatramo, da je osvetljenost merjenca in glave merilnika osvetljenosti enaka. Merilnik<br />
svetlosti je montiran na premični ročici dolžine en meter, ki omogoča zasuk od 0° do 90° glede na<br />
trenutni položaj merjenca oziroma od 0° do 180 ° glede na položaj svetlobnega vira.<br />
Kot merjenja na merilniku svetlosti je bil nastavljen na 1,1°, kar pomeni, da je velikost merjene<br />
površine, ko je os merilnika svetlosti pravokotna na površino merjenca (α=0°), manjša od 3 cm 2<br />
(površina merjenca je 78 cm 2 ). Zaradi te razmeroma majhne merjene površine, je potrebno da ima<br />
merjenec relativno fino zrnatost površine, če želimo, da je rezultat meritve uporaben. Ker smo za<br />
izvedbo meritev uporabili vzorec že rabljene asfaltne cestne obloge, smatramo, da je bil ta pogoj<br />
izpolnjen. Z večjim kotom β merjena površina narašča. Z napravo smo omejeni na meritve pri kotih<br />
β med 0° in 90°. Vendar pa je pri kotih večjih od 70° rezultate jemati z določeno rezervo, saj je v teh<br />
primerih merjena površina večja od površine merjenca, teoretično pa je merjena površina pri kotu<br />
90° celo neskončno velika. Zaradi tega smo sklenili meritve izvajati samo do kota 80°.<br />
“Lighting Engineering 2006” stran 159
R-19 “Razsvetljava v praksi”<br />
Idejna skica naprave je predstavljena na sliki 1. Merjenec, ki stoji v koordinatnem izhodišču, je<br />
za kot α premaknjen glede na svetlobni vir, ki leži na osi y. Merilnik svetlosti pa je glede na merjenec<br />
premaknjen še za kot β. Naslednje slike pa prikazujejo izvedbo naprave.<br />
Slika 1: Idejna skica naprave<br />
Slika 2: Vzorec vpet v nosilec v osi svetlobnega vira ter nad njim glava merilnika osvetljenosti<br />
stran 160 Posvetovanje “Razsvetljava 2006”
“Meritev odsevnosti cestnih površin” R-19<br />
Slika 3: Svetlobni vir z ustreznimi lečami, ki omogočajo ustrezno ozek svetlobni snop (sončni simulator oziroma<br />
reflektor)<br />
Slika 4: Namestitev merilnika svetlosti na pomično ročico<br />
Pri izvedbi meritev so bili uporabljeni naslednji inštrumenti: svetlobni vir oziroma sončni<br />
simulator Canto 575 msd/msr z žarnico Osram HSR 575/60, merilnik svetlosti MAS40-100 ter<br />
merilnik osvetljenosti BEHA 93408.<br />
4. Izvedba meritve<br />
Iz izkušenj lahko sklepamo, da bo kotna porazdelitev svetlosti (odsevnosti) pri difuznih oziroma<br />
hrapavih površinah zvezna in relativno gladka. Tako lahko le-to torej interpoliramo iz diskretnih<br />
rezultatov meritev. Korak kota med dvema meritvama moramo izbrati tako, da bo interpolirana<br />
funkcija dovolj točna in da meritev ne bo trajala predolgo. Če med samo meritvijo iz rezultatov<br />
ugotovimo, da smo izbrali prevelik ali premajhen korak, ga popravimo in začnemo znova. Za meritev<br />
kotne porazdelitve svetlosti testnega vzorca smo izbrali 5° korak za vpadni in odsevni kot. Vendar pa<br />
smo na koncu iz rezultatov ugotovili, da bi lahko izbrali tudi večji korak (10° ali celo nekaj več), pa<br />
se rezultati ne bi bistveno spremenili, precej skrajšal pa bi se čas, potreben za izvedbo meritve (vsaj<br />
“Lighting Engineering 2006” stran 161
R-19 “Razsvetljava v praksi”<br />
na četrtino). Za boljšo preglednost podajanja rezultatov je primerno, da izberemo linearen korak, ni<br />
pa nujno potrebno za samo meritev in analizo.<br />
Meritev začnemo z meritvijo pravokotne osvetljenosti E 0 . Če svetilnosti svetlobnega vira ne<br />
bomo spreminjali oziroma je sprememba zaradi zunanjih vplivov zanemarljiva, je to edina potrebna<br />
tovrstna meritev. Vrednosti osvetljenosti pri ostalih vpadnih kotih lahko izračunamo po zgoraj<br />
navedeni formuli.<br />
Meritev svetlosti začnemo pri vpadnem kotu α=0° in odsevnem kotu β=0°. Merjenec je<br />
pravokoten na svetilo, merilec svetlosti pa je pravokoten na merjenca. Po prvi meritvi premaknemo<br />
merilec svetlosti v smeri urinega kazalca in tako povečamo odsevni kot β, za izbran korak ter<br />
opravimo naslednjo meritev. To ponavljamo do kota β=70° (oziroma 80°), kjer dobimo še zadnjo<br />
uporabno meritev. S tem zaključimo skupino meritev pri vpadnem α=0°. Za naslednjo skupino<br />
meritev zasukamo merjenec za izbran kot prav tako v smeri urinega kazalca. Merilnik svetlosti<br />
postavimo pravokotno na merjenec, kar je izhodiščni položaj za vsako skupino meritev, in opravimo<br />
prvo meritev v skupini. Ostale meritve v skupini opravimo po prej opisanem postopku. Skupine<br />
meritev opravimo do vpadnega kota α = 85°. Meritev pri vpadnem kotu α = 90° z vidika odsevnosti<br />
ni smiselna, saj je osvetljenost pri tem kotu enaka nič (E(90°) = 0), odsevnost ρ pa je posledično<br />
neskončna.<br />
Po začetku meritve se je izkazalo, da ima naprava še dve, sicer logični, pomanjkljivosti. Prva je<br />
ta, da je nemogoče priti do nekaterih rezultatov v bližini α=0° in β=0° (v tabelah so označeni z rdečo<br />
barvo). Problem leži v fizični velikosti merilnika svetlosti, ki v tem položaju zastira pot vpadajoči<br />
svetlobi in meče senco na merjenec. Zaradi tega nismo uspeli izmeriti rezultatov pri kombinaciji<br />
kotov (0°, 0°), (0°, 5°) in (5°, 0°). Omenjene vrednosti smo zato za predstavitev rezultatov<br />
interpolirali iz sosednjih rezultatov. Omenjena interpolacija zaradi majhnega koraka in posledično<br />
velikega števila uporabnih rezultatov ne vpliva bistveno na točnost rezultatov oziroma kasnejše<br />
analize. Druga pomanjkljivost ima podoben vzrok, vendar je opazna pri meritvi pri velikem vpadnem<br />
in odsevnem kotu. Pri velikem odsevnem kotu namreč merilno polje merilnika svetlosti, pri dani<br />
velikosti merjenca in uporabljenem merilnem kotu merilnika, zajame tudi del okolice merjenca, kjer<br />
pa se pri velikem vpadnem kotu nahaja svetlobni vir. Posledično izmerimo zelo visoke vrednosti<br />
svetlosti, ki pa so seveda napačne. Zato nismo upoštevali rezultatov, dobljenih pri kotih (75°, 75°),<br />
(75°, 80°), (80°, 75°), (80°, 80°), (85°, 75°) in (85°, 80°).<br />
5. Rezultati meritev<br />
Rezultati meritev kotne porazdelitve svetlosti na obravnavanem vzorcu so podani v nadaljevanju.<br />
V tabeli 1 smo najprej navedli velikost osvetljenosti vzorca pri različnih vpadnih kotih α, ki so<br />
rezultat meritve osvetljenosti pri kotu α = 0°. Vrednosti za ostale kote so izračunane po zgoraj<br />
navedeni formuli.<br />
stran 162 Posvetovanje “Razsvetljava 2006”
“Meritev odsevnosti cestnih površin” R-19<br />
Tabela 1: Funkcija kotne porazdelitve osvetljenosti E za kote α med 0° in 85°<br />
α[°] E [lux]<br />
0 53000<br />
5 52798<br />
10 52195<br />
15 51194<br />
20 49804<br />
25 48034<br />
30 45899<br />
35 43415<br />
40 40600<br />
45 37477<br />
50 34068<br />
55 30400<br />
60 26500<br />
65 22399<br />
70 18127<br />
75 13717<br />
80 9203<br />
85 4619<br />
Izmerjene vrednosti svetlosti obravnavanega vzorca pa so podane v tabelah 2 in 3. Vrednosti v<br />
tabeli 2 se nanašajo na kote odsevanja med 0° in 40°, vrednosti v tabeli 3 pa na kote odsevanja med<br />
45° in 80°. Tabeli sta ločeni zaradi večje preglednosti.<br />
Tabela 2: Izmerjena funkcija porazdelitve svetlosti L(0°−85°, 0°−40°) [cd/m 2 ]<br />
α[°]/β[°] 0 5 10 15 20 25 30 35 40<br />
0 1400 1350 1238 1139 1061 1016 963 926 898<br />
5 1220 1274 1222 1189 1142 1078 1015 981 945<br />
10 1144 1185 1258 1236 1196 1137 1086 1061 1031<br />
15 1044 1099 1169 1227 1234 1201 1166 1138 1110<br />
20 944 1015 1055 1153 1252 1260 1215 1201 1185<br />
25 883 928 998 1085 1185 1276 1296 1267 1250<br />
30 847 884 935 1011 1103 1217 1339 1387 1403<br />
35 766 819 860 931 990 1095 1260 1410 1451<br />
40 680 742 786 841 931 1018 1133 1326 1522<br />
45 631 663 715 783 839 938 1054 1210 1418<br />
50 551 603 627 679 748 819 948 1093 1305<br />
55 500 549 572 627 704 780 886 1034 1231<br />
60 439 478 507 550 610 686 796 928 1089<br />
65 383 405 439 488 532 602 694 814 1005<br />
70 314 331 355 391 449 507 587 689 872<br />
75 226 245 275 309 351 407 479 572 712<br />
80 161 171 194 216 243 287 347 419 519<br />
85 60 74 78 94 110 137 167 200 260<br />
“Lighting Engineering 2006” stran 163
R-19 “Razsvetljava v praksi”<br />
Tabela 3: Izmerjena funkcija svetlosti L(0°−85°, 45°−80°) [cd/m 2 ]<br />
α[°]/β[°] 45 50 55 60 65 70 75 80<br />
0 0,017 0,016 0,017 0,017 0,017 0,017 0,017 0,017<br />
5 0,018 0,018 0,018 0,017 0,018 0,018 0,018 0,018<br />
10 0,019 0,019 0,019 0,019 0,020 0,020 0,020 0,020<br />
15 0,021 0,021 0,021 0,022 0,022 0,023 0,023 0,023<br />
20 0,023 0,023 0,024 0,023 0,024 0,025 0,026 0,027<br />
25 0,026 0,026 0,027 0,026 0,028 0,030 0,031 0,031<br />
30 0,030 0,030 0,031 0,031 0,033 0,035 0,036 0,038<br />
35 0,035 0,034 0,036 0,037 0,039 0,042 0,045 0,047<br />
40 0,040 0,041 0,043 0,045 0,048 0,053 0,057 0,060<br />
45 0,045 0,049 0,054 0,056 0,061 0,069 0,076 0,081<br />
50 0,047 0,057 0,065 0,073 0,081 0,092 0,103 0,111<br />
55 0,049 0,065 0,082 0,096 0,114 0,134 0,153 0,170<br />
60 0,051 0,067 0,090 0,119 0,156 0,195 0,232 0,262<br />
65 0,056 0,074 0,099 0,142 0,209 0,295 0,373 0,443<br />
70 0,061 0,082 0,113 0,161 0,252 0,412 0,574 0,767<br />
75 0,069 0,091 0,129 0,185 0,299 0,514<br />
80 0,078 0,108 0,150 0,227 0,353 0,648<br />
85 0,079 0,117 0,161 0,243 0,417 0,759<br />
Za boljši prikaz rezultatov meritev je v nadaljevanju na sliki 5 podana še kotna porazdelitev<br />
svetlosti v (kvazi) polarnem diagramu. Na sliki so podane vrednosti svetlosti vzorca pri vpadnih<br />
kotih svetlobe med 0° in 40°. Vpadni koti so navedeni v legendi na desni strani slike.<br />
2000<br />
1500<br />
1000<br />
0<br />
5<br />
10<br />
15<br />
20<br />
25<br />
30<br />
35<br />
40<br />
500<br />
0<br />
0 500 1000 1500 2000 2500<br />
Slika 5: Graf kotne porazdelitve svetlosti pri vpadnih kotih od 0° do 40°<br />
stran 164 Posvetovanje “Razsvetljava 2006”
“Meritev odsevnosti cestnih površin” R-19<br />
Na zgornji sliki je na abscisi in na ordinati veličina svetlost enota pa cd/m 2 . Graf je dobljen tako,<br />
da je vrednost svetlosti pri določenem odsevnem kotu razdeljena na horizontalno in vertikalno<br />
komponento, ki nato predstavljata točko v grafu. Posamezne točke za upoštevane odsevne kote so<br />
nato med seboj povezane kot to prikazuje slika 6 za primer, ko je vpadni kot enak 45°. Na obeh oseh<br />
je v tem primeru navedeno razmerje L/E.<br />
0,07<br />
0,06<br />
0,05<br />
0,04<br />
0,03<br />
Vpad 45°<br />
Odboj 45°<br />
0,02<br />
0,01<br />
0,00<br />
-0,02 -0,01 0,00 0,01 0,02 0,03 0,04 0,05 0,06 0,07 0,08<br />
Slika 6: Detajlni graf kotne porazdelitve odsevnosti pri vpadnem kotu 45°<br />
6 Zaključek<br />
Izdelana priprava lahko izmeri funkcijo kotne porazdelitve odsevnosti pri vpadnih kotih od 0° do<br />
85° za odsevne kote od 0° do 70° (ρ[0°-90°, 0°-70°]). Za meritev odsevnosti pri večjih odsevnih<br />
kotih bi morali ali vzeti vzorec z večjo površino ali zmanjšati merilno področje merilnika svetlosti za<br />
celotno meritev. Slednja rešitev ni najbolj primerna, saj so vzorci zrnati in zato rezultati pri manjših<br />
odsevnih kotih ne bi bili pravilni. Dodatna omejitev je še v območju blizu α = 0° in β = 0°, saj<br />
merilnik svetlosti zakriva svetlobni vir.<br />
Pri meritvi testnega vzorca smo se odločili za linearen korak 5° tako pri vpadnem kot tudi pri<br />
odsevnem kotu. Za popolnoma neznan vzorec je tak korak zadovoljiv. Če pa že poznamo približno<br />
kotno porazdelitev merjenca, se lahko odločimo tudi za nelinearen korak in sicer manjši (1°-5°) v<br />
bližini ekstremov in večji (10°-20°) na ostalem območju. S slednjo rešitvijo lahko razpolovimo čas<br />
merjenja.<br />
Pri izmerjenih rezultatih na testnem vzorcu lahko opazimo skoraj zrcalni odboj pri višjih vpadnih<br />
kotih, kar pa nam je že znano iz vsakodnevnega življenja in uporabe cest.<br />
Naprava pa ni uporabna izključno za merjenje odsevnih karakteristik cestnih površin. Eden izmed<br />
primerov uporabe je lahko merjenje odsevne karakteristike svetlobnih celic, saj lahko s pomočjo<br />
kotne porazdelitve odsevnosti izračunamo odstotek odbitega svetlobnega toka. V podobnem duhu<br />
lahko uporabimo napravo tudi na drugih površinah.<br />
“Lighting Engineering 2006” stran 165
R-19 “Razsvetljava v praksi”<br />
LITERATURA<br />
1. DARK SKY SLOVENIJA, http://www.temnonebo.org/<br />
2. Fördergemeinschaft Gutes Licht, Lighting with Artificial Light, http://www.licht.de<br />
3. CIE Publ. No. 44: Absolute methods for reflection measurements, 1979<br />
4. Chuck Moidel: Bi-Directional Reflectance Distribution Functions,<br />
5. T. Lefebvre, A. Kemeny, D. Arquès, L. Joly, S. Michelin: Rendering of complex materials<br />
for driving simulators, DSC, 2005<br />
6. Primož Puhar: Meritev odsevnosti cestnih površin, seminarska naloga pri predmetu<br />
Svetlobna tehnika na podiplomskem študiju Elektrotehnike, Fakulteta za elektrotehniko<br />
Univerze v Ljubljani, 2006<br />
Avtorjev naslov:<br />
Primož Puhar, univ. dipl. inž. el.<br />
4248 LESCE, Finžgarjeva ulica 6<br />
Slovenija<br />
Tel: 031-378-901<br />
Elektronski naslov: primoz.puhar@gmail.com<br />
Grega Bizjak<br />
Univerza v Ljubljani, Fakulteta za elektrotehniko<br />
Tržaška 25, 1000 Ljubljana, Slovenija<br />
Tel.: 01 - 4768 446<br />
Elektronski naslov: grega.bizjak@fe.uni-lj.si<br />
stran 166 Posvetovanje “Razsvetljava 2006”
“Uporaba digitalnega fotoaparata s širokokotnim objektivom v funkciji merilnika površin…” R-20<br />
Matej B. Kobav<br />
UPORABA DIGITALNEGA FOTOAPARATA S ŠIROKOKOTNIM<br />
OBJEKTIVOM V FUNKCIJI MERILNIKA PORAZDELITVE SVETLOSTI NEBA<br />
Povzetek<br />
V članku so predstavljeni postopki uporabe digitalnega fotoaparata kot<br />
merilnika porazdelitve svetlosti neba ter ugotovitve, ki smo jih zabeležili ob<br />
praktični uporabi.<br />
Digitalna fotografija je v zadnjem času doživela velik razcvet in z njo tudi<br />
fotografska oprema. V našem primeru smo za meritev porazdelitve svetlosti<br />
neba uporabili digitalni fotoaparat Nikon Coolpix 5000 in pripadajoči<br />
širokokotni objektiv. Fotografije so bile posnete na meteorološki postaji ENTPE<br />
(Ecole Nationale des Travaux publics de l'Etat) v Lyonu, kjer je bil v letu 2005<br />
nameščen tudi merilnik porazdelitve svetlosti. Digitalne fotografije so bile<br />
najprej obdelane s programom PHOTOLUX, s katerim smo pretvorili digitalno<br />
fotografijo v karto svetlosti. Svetlosti posameznih elementov neba so bile nato<br />
obdelane z dvema računalniškima programoma in nato grafično prikazane ter<br />
analizirane. Na koncu članka so opisane tudi težave, s katerimi se srečamo pri<br />
uporabi digitalnega fotoaparata.<br />
Abstract<br />
In the present article we present the use of digital camera with fish-eye<br />
lenses in function of sky scanner and remarks we noticed at practical work.<br />
We are living in an age that digital photography is in a full bloom. Every day<br />
there are new digital cameras put to the market and together with cameras also<br />
all the needed equipment. In our case we used Nikon Coolpix 5000 digital<br />
camera and appurtenant fish-eye lenses. All digital images of the sky vault were<br />
taken in year 2005 at the ENTPE IDMP station in Vaulx-en-Velin, France. In<br />
the same period (May 2005 - December 2005) on the same IDMP station there<br />
was installed also EKO sky luminance scanner. Images were first transformed<br />
into luminance maps with Photolux. Luminance values were analyzed and<br />
compared to the one derived with sky luminance scanner. At the end we list also<br />
problems occurred with use of digital camera.<br />
“Lighting Engineering 2006” stran 167
R-20 “Dnevna svetloba”<br />
1. Uvod<br />
Strošek, ki ga lastniki objektov namenijo za vzdrževanje le-teh v njegovi življenjski dobi, je<br />
neprimerljivo višji od stroška, ki ga investitor nameni za gradnjo. Želja vseh investitorjev je, da bi<br />
bili stroški vzdrževanja objektov čim manjši in da bi to željo uresničili, so pripravljeni že v začetni<br />
fazi (pri projektiranju) odšteti nekaj več sredstev za kvalitetne študije in projekte, ki bi zagotavljali<br />
maksimalne prihranke oz. zmanjševali stroške rednega vzdrževanja objekta. Med stroški vzdrževanja<br />
poslovnih objektov enega od večjih deležev predstavlja tudi strošek za razsvetljavo. Tako mora biti<br />
že v začetni fazi ena od prednosti pri projektiranju tudi pravilna postavitev oken, okenskih odprtin,<br />
svetlobnikov in svetlobnih cevi. S pravilno postavitvijo oken lahko v dnevnem času zmanjšamo<br />
porabo električne energije za razsvetljavo. Z ustrezno projektiranimi senčili pa lahko zagotovimo še<br />
dodatne prihranke pri energiji, ki se porabi za ustvarjanje primerne klime v objektu. Nikakor pa ne<br />
smemo pozabiti na človekovo ugodje, saj je storilnost v delovnih prostorih, kjer se zaposleni dobro<br />
počuti, veliko večja.<br />
Za dosego vseh teh ciljev pa je potrebno poznati pogoje, ki vplivajo na vnos svetlobe v prostor.<br />
Vsekakor je med njimi najbolj pomembno poznavanje dogajanja na nebu in s tem porazdelitev<br />
svetlosti neba.<br />
Za meritev svetlosti neba se uporabljajo posebne merilne naprave. Na žalost je cena teh merilnih<br />
naprav zelo visoka in tako je na celem svetu nameščenih le dober ducat merilnikov porazdelitve<br />
svetlosti neba.<br />
Zato smo v sodelovanju z ENTPE naredili študijo, v kateri primerjamo rezultate, dobljene s<br />
pomočjo merilnika porazdelitve svetlosti in rezultate, ki jih dobimo z uporabo digitalnega<br />
fotoaparata, širokokotnega objektiva in ustrezne programske opreme.<br />
2. Slikanje z digitalnim fotoaparatom in širokokotnim objektivom<br />
Merilnik porazdelitve svetlosti, ki je bil nameščen na ENTPE meteorološki postaji, je bil<br />
izposojen od Kyushe Univerze (Japonska) za dobo enega leta. Ker je eno leto v raziskovalnem<br />
smislu zelo kratka doba za opazovanje neba, smo želeli nadaljevati z meritvami in opazovanjem tudi<br />
kasneje, ko je bil merilnik porazdelitve svetlosti že vrnjen na Japonsko. Namesto merilnika<br />
porazdelitve svetlosti bi uporabljali digitalni fotoaparat s širokokotnim objektivom in ustrezno<br />
programsko opremo s katero bi lahko odčitali porazdelitev svetlosti.<br />
6. oktober 2005, 10:42 7. september 2005, 9:32 15 september 2005, 14:02<br />
Slika 1. Primeri fotografij za različne tipe neba<br />
stran 168 Posvetovanje “Razsvetljava 2006”
“Uporaba digitalnega fotoaparata s širokokotnim objektivom v funkciji merilnika površin…” R-20<br />
V času, ko je bil merilnik porazdelitve svetlosti še nameščen, smo nekaj dni vzporedno z<br />
meritvijo fotografirali tudi nebo z digitalnim fotoaparatom in širokokotnim objektivom (slika 1).<br />
Nebo smo fotografirali v istem trenutku, ko je deloval tudi merilnik porazdelitve svetlosti. Tako je<br />
bila možna direktna primerjava rezultatov dobljenih iz digitalnih fotografij in merilnika porazdelitve<br />
svetlosti.<br />
3. Pretvorba svetlosti iz digitalnih fotografij v datoteko formata .05D<br />
Če smo želeli celovito primerjavo med rezultati digitalnih fotografij narejenih s širokokotnim<br />
objektivom in rezultati merilnika porazdelitve svetlosti, smo morali digitalne fotografije pretvoriti v<br />
obliko, ki je enaka izhodnim podatkom merilnika porazdelitve svetlosti. Merilni rezultati iz merilnika<br />
porazdelitve svetlosti so podani v .05D datoteki, kjer so svetlosti posameznih 145 elementov neba<br />
nanizane brez ločila druga za drugo v tekstovni obliki. Svetlosti so podane v formatu X.XXX, vendar<br />
niso podane v absolutnih vrednostih, ampak so deljene s faktorjem k (slika 2). Faktor k se izračuna s<br />
pomočjo naslednje enačbe:<br />
L = k ⋅ LF<br />
6<br />
L = 10 / f<br />
C<br />
⋅ k<br />
SS<br />
⋅ L<br />
F<br />
⇒ k<br />
= 10<br />
6<br />
/<br />
f<br />
C<br />
⋅ k<br />
SS<br />
(1)<br />
Kjer je:<br />
L svetlost elementa neba,<br />
f<br />
C<br />
kalibracijski faktor merilnika porazdelitve svetlosti (110.6),<br />
k<br />
SS<br />
faktor merilnika porazdelitve svetlosti, ki smo ga določili pod umetnim nebom (1.65)<br />
L<br />
F<br />
svetlost podana v .05D datoteki.<br />
Izračunana vrednost faktorja k znaša 14.918,63.<br />
Slika 2. Izračun vrednosti svetlosti iz .05D datoteke<br />
4. Merilni postopek<br />
Fotografije so bile posnete z digitalno kamero Nikon Coolpix 5000 in pripadajočim<br />
širokokotnim objektivom.<br />
Prvi korak pri obdelavi fotografij je bil uvoz le-teh v program PHOTOLUX, kjer so se izračunale<br />
svetlosti posamezne točke na fotografiji in kreirala se je karta svetlosti (slika 3). Ko so bile<br />
svetlosti posameznih točk na fotografiji izračunane, smo jih shranili v pravilnem vrstnem redu,<br />
da smo omogočili njihovo uporabo za kasnejše izračune.<br />
“Lighting Engineering 2006” stran 169
R-20 “Dnevna svetloba”<br />
a<br />
b<br />
Slika 3. Originalna fotografija (a) in pripadajoča karta svetlosti (b) za 6. oktober 2005, 10:42<br />
Programska oprema Photolux omogoča izvoz vrednosti svetlosti v Genelux formatu. Pri Genelux<br />
formatu je nebo razdeljeno na elemente, ki imajo med seboj skoraj popolnoma enak prostorski kot.<br />
Gostota mreže, s katero razdelimo nebo, pa je spremenljiva od 1 0 do 30 0 zenitnega kota. Vzporedno s<br />
spreminjanjem gostote mreže se spreminja tudi število elementov, na katere razdelimo celotno<br />
poloblo neba (Tabela 1).<br />
Table 1. Število elementov neba in prostorski kot v odvisnosti od gostote Genelux mreže<br />
Genelux mreža [ 0 ] 1 2 3 5 6 10 15 30<br />
Število elementov 20673 5181 2310 835 583 212 97 26<br />
Prostorski kot [sr] 0.000304 0.001213 0.002720 0.007525 0.010777 0.029638 0.064775 0.241661<br />
Za nadaljnjo analizo smo izbrali najbolj natančne podatke, ki pa so zbrani, če uporabimo Genelux<br />
format z gostoto mreže 1 0 .<br />
5. Povezava rezultatov iz merilnika porazdelitve svetlosti in digitalnih fotografij<br />
Fotografije, ki jih naredimo z digitalnim fotoaparatom in širokokotnim objektivom so zrcalne.<br />
Slika, ki jo dobimo, je enaka podobi, ki jo vidimo z našimi očmi, če se uležemo na tla in se ozremo<br />
proti zenitu. Če je naše telo pri tem poravnano v smeri sever-jug in imamo glavo v smeri severa,<br />
potem je vzhod na naši levi strani in zahod na naši desni strani. Pri podatkih, ki jih dobimo iz<br />
merilnika porazdelitve svetlosti, pa je obratno. Slika iz merilnika porazdelitev svetlosti ima enako<br />
orientacijo kot so strani neba (sever na vrhu, jug na dnu, vzhod na desni in zahod na levi).<br />
stran 170 Posvetovanje “Razsvetljava 2006”
“Uporaba digitalnega fotoaparata s širokokotnim objektivom v funkciji merilnika površin…” R-20<br />
6. Zrcaljenje in rotacija digitalne fotografije<br />
Kot že omenjeno, je potrebno vse fotografije, posnete z digitalno kamero, zrcaliti in tudi rotirati.<br />
Fotografije so bile posnete namreč tako, da je bil zgornji del fotoaparata obrnjen proti zahodu in<br />
poravnan s smerjo sever-jug. Zaradi bližnjih objektov, je bilo namreč pri takšni namestitvi najlažje<br />
poravnati fotoaparat v skladu s smermi neba. Če bi hoteli izvesti samo zrcaljenje fotografije, bi moral<br />
biti zgornji del fotoaparata (in fotografije) obrnjen proti severu.<br />
Poleg zrcaljenja je torej potrebna tudi rotacija. Da smo lahko določili pravi kot rotacije za vsak<br />
posamezen dan, ko smo fotografirali nebo, smo pozicijo sonca na fotografiji primerjali z izračunano<br />
pozicijo. Prav tako smo primerjali tudi lokacijo višjih objektov. Pred prvimi meritvami smo namreč<br />
izmerili azimute nekaterih višjih in dobro vidnih okoliških objektov (slika 4).<br />
Slika 4. Azimuti nekaterih višjih in izrazitejših objektov<br />
Originalna fotografija<br />
Horizontalno zrcaljena fotografija<br />
“Lighting Engineering 2006” stran 171
R-20 “Dnevna svetloba”<br />
Horizontalno zrcaljena fotografija z vrisano<br />
masko azimutov<br />
Horizontalno zrcaljena in rotirana fotografija<br />
za 99 0 v obratni smeri urinega kazalca<br />
Slika 5. Preoblikovanje fotografije<br />
Slika 6. Zrcaljena in rotirana digitalna fotografija z mrežo 145 CIE elementov neba<br />
Ko je fotografija zrcaljena in pravilno orientirana, lahko nanjo napnemo mrežo 145 CIE<br />
elementov neba (slika 6). Elementi neba, ki so definirani s CIE standardom, imajo prostorski kot<br />
približno 150 krat večji kot je prostorski kot posameznega elementa v Genelux datoteki. Tako je<br />
potrebno za vsakega od 145 elementov neba poiskati pripadajoče elemente iz Genelux datoteke (slika<br />
7).<br />
stran 172 Posvetovanje “Razsvetljava 2006”
“Uporaba digitalnega fotoaparata s širokokotnim objektivom v funkciji merilnika površin…” R-20<br />
Slika 7. Določitev elementov Genelux mreže, ki ustrezajo CIE elementu neba št. 1.<br />
Za vsakega od 145 CIE elementov neba se nato izračuna povprečna vrednost svetlosti<br />
pripadajočih elementov iz Genelux mreže in ta vrednost je shranjena kot vrednost svetlosti CIE<br />
elementa, dobljena iz digitalne fotografije.<br />
Izračunane vrednosti svetlosti CIE elementov se nato delijo s faktorjem k in kalibracijskim<br />
faktorjem digitalnega fotoaparata ter zapišejo v .05D datoteko skupaj v uvodnim delom "0.000" in<br />
zaključkom "0.0070.010110.60.00005/10/0610:00:0510:00:28LYON". V zaključku datoteke so<br />
shranjeni podatki o kalibracijskem faktorju merilnika porazdelitve svetlosti ter datum, ura in kraj<br />
meritve"<br />
7. Zrcaljenje in rotacija mreže CIE elementov neba<br />
Zrcaljenje in/ali rotacija digitalne fotografije v grafičnih programih za urejanje slik (Photoshop,<br />
Paint Shop…) ima nepopravljive posledice. Ko je slika grafično obdelana (zrcaljena in rotirana) in<br />
ponovno shranjena, se izgubijo vsi podatki o fotoaparatu in o nastavitvah le-tega pri nastanku<br />
fotografije. S tem pa fotografija postane neuporabna za nadaljnjo obdelavo v programu Photolux.<br />
Zato so fotografije najprej obdelane v programu Photolux, nato pa za grafični prikaz zrcaljene in<br />
rotirane. Za nadaljnje izračune bi torej morali zrcaliti in zavrteti podatke v Genelux datoteki. Ker je<br />
pravilno zrcaljenje in rotacija več kot 20.000 vrednosti svetlosti skoraj nemogoča, je enostavneje<br />
zrcaliti in zavrteti mrežo CIE elementov neba. Zrcaljena in rotirana mreža CIE elementov se nato<br />
napne na originalno digitalno fotografijo in iz Genelux mreže se izberejo elementi, ki ustrezajo<br />
posameznemu CIE elementu (slika 8).<br />
“Lighting Engineering 2006” stran 173
R-20 “Dnevna svetloba”<br />
Originalna mreža CIE elementov<br />
Zrcaljena mreža CIE elementov<br />
Zrcaljena in rotirana mreža CIE elementov<br />
Originalna digitalna fotografija z zrcaljeno in<br />
rotirano mrežo CIE elementov<br />
Slika 8. Preoblikovanje mreže CIE elementov neba<br />
Določitev pripadajočih elementov Genelux mreže za posamezen element neba in oblikovanje<br />
.05D datoteke je enako kot v prvem primeru.<br />
8. Primerjava rezultatov dobljenih s pomočjo .05D iz merilnika porazdelitve<br />
svetlosti in digitalnih fotografij<br />
Pri vrednotenju rezultatov iz digitalnih fotografij smo analizirali dva sklopa meritev. V prvem<br />
sklopu je 112 digitalnih fotografij, ki so bile posnete z Nikon Coolpix 5000 fotoaparatom (v lasti<br />
ENTPE), 7., 8., 13., 15., 16. septembra in 6. oktobra 2005. V drugem sklopu pa je 48 digitalnih<br />
fotografij, posnetih z Nikon Coolpix 5000 fotoaparatom (v lasti FE), 30. novembra ter 1., 2. in 7.<br />
decembra 2005.<br />
S programsko opremo, ki smo jo razvili za obdelavo in analizo podatkov iz merilnika<br />
porazdelitve svetlosti, smo analizirali tudi vseh 160 .05D datotek, ki smo jih dobili z obdelavo<br />
digitalnih fotografij. Rezultate analize smo primerjali z rezultati iz merilnika porazdelitev svetlosti<br />
(slika 9).<br />
stran 174 Posvetovanje “Razsvetljava 2006”
“Uporaba digitalnega fotoaparata s širokokotnim objektivom v funkciji merilnika površin…” R-20<br />
Rezultati iz digitalne fotografije<br />
Rezultati iz merilnika porazdelitve svetlosti<br />
Slika 9. Prikaz rezultatov porazdelitve svetlosti iz digitalne fotografije in merilnika<br />
Za bolj nazoren prikaz rezultatov dobljenih iz digitalne fotografije, smo izbrali tudi predstavitev,<br />
ki je podobna zgoraj opisani, le da smo za prikaz uporabili obratne barve (slika 10).<br />
Slika 10. Prikaz porazdelitve svetlosti dobljene iz digitalne fotografije v obratnih barvah.<br />
“Lighting Engineering 2006” stran 175
R-20 “Dnevna svetloba”<br />
Za vseh 160 digitalnih fotografij smo naredili primerjavo vseh podatkov dobljenih z analizo<br />
(horizontalna osvetljenost, štiri vertikalne osvetljenosti, svetlost zenita, razmerje Lz/Dv in vseh 145<br />
svetlosti elementov neba). Glavne razlike med digitalnimi fotografijami in merilnikom porazdelitve<br />
svetlosti so se pokazale pri vrednostih svetlosti na prvem almukantarju (0-12 stopinj višine). Razlike<br />
v svetlosti na tej višini so bile skoraj trikrat večje kot razlike na ostalih višinah (slika 11). Najbolj<br />
verjeten razlog za velike razlike v svetlosti je širokokotni objektiv, ki ima največje popačenje prav na<br />
robu fotografije (pri majhnih višinah elementov neba).<br />
Zaradi velike razlike v svetlosti elementov pri majhnih višinah smo za nadaljnje analize izločili<br />
elemente, katerih zenitni kot je večji kot 78 stopinj. Večina teh elementov neba je vsaj delno pokritih<br />
z okoliškimi stavbami in ti elementi so bili izvzeti iz analize tudi pri obdelavi podatkov iz merilnika<br />
porazdelitve svetlosti.<br />
Pri izdelavi .05D datotek smo za vsakega od fotoaparatov uporabili drugačen koeficient k. Nova<br />
vrednost, ki smo jo uporabili za Nikon CoolPix 5000 v lasti ENTPE je bila 15945.9, kar je 6.9% več<br />
kot pri prvotni nastavitvi. Povprečna horizontalna osvetljenost, ki je bila izračunana iz digitalnih<br />
fotografij s prvotnim faktorje k, je bila za 6.9% večja kot povprečna horizontalna osvetljenost, ki je<br />
bila izračunana iz podatkov dobljenih iz merilnika porazdelitev svetlosti. Zaradi tega smo se odločili,<br />
da spremenimo faktor k. Zaradi enakega razloga smo spremenili tudi vrednost koeficienta k za<br />
fotoaparat Nikon CoolPix 5000 v lasti FE na vrednost 18018.9.<br />
Za oba sklopa meritev smo naredili primerjalne tabele z najbolj pomembnimi podatki (tabela 2)<br />
in nato povzeli rezultate v tabelah 3 in 4.<br />
Relativna razlika (%) .<br />
40<br />
35<br />
30<br />
25<br />
20<br />
15<br />
10<br />
5<br />
0<br />
6 18 30 42 54 66 78 90<br />
Almukantar (stopinje)<br />
Slika 11. Relativne razlike v svetlosti elementov na različnih višinah.<br />
stran 176 Posvetovanje “Razsvetljava 2006”
“Uporaba digitalnega fotoaparata s širokokotnim objektivom v funkciji merilnika površin…” R-20<br />
Tabela 2. Vzorčna primerjalna tabela podatkov za 8. september ob 9:50 (GMT+1)<br />
Digitalna fotografija Merilnik porazdelitve<br />
svetlosti<br />
Razlika<br />
Horizontalna osvetljenost [lx] 22586 22810 - 0.98%<br />
Svetlost zenita [cd/m 2 ] 8712 9100 + 4.45%<br />
Lz/Dv [cd/m 2 lx] 0.386 0.399 - 3.28%<br />
Postopnost 2 1 +1<br />
Razpršenost 2 2 0<br />
Lz/DV nebo 2 2 0<br />
Tregenza nebo 3 2 +1<br />
Svetlost 115 elementov neba<br />
povprečna razlika 0.77 %<br />
RMS razlika 8.63 %<br />
Tabla 3. Povprečna in povprečna absolutna napaka za prvi sklop meritev<br />
Povprečna razlika<br />
Povprečna absolutna razlika<br />
Horizontalna osvetljenost [lx] + 0.48 % 5.06 %<br />
Svetlost zenita [cd/m 2 ] + 0.80 % 14.66 %<br />
Lz/Dv [cd/m 2 lx] + 0.537 % 13.47 %<br />
Svetlost 115 elementov neba + 3.25 % 13.42 %<br />
Tabela 4. Povprečna in povprečna absolutna napaka za drugi sklop meritev<br />
Povprečna razlika<br />
Povprečna absolutna razlika<br />
Horizontalna osvetljenost [lx] - 1.34 % 5.50 %<br />
Svetlost zenita [cd/m 2 ] - 4.60 % 9.51 %<br />
Lz/Dv [cd/m 2 lx] - 3.31 % 7.14 %<br />
Svetlost 115 elementov neba + 2.66 % 8.82 %<br />
9. Zaključek<br />
Rezultati študije so pokazali, da lahko s kvalitetnim digitalnim fotoaparatom nadomestimo<br />
merilnik porazdelitve svetlosti neba. Pri tem ima digitalni fotoaparat veliko prednost, saj je<br />
njegova resolucija omejena pravzaprav samo z resolucijo CCD elementa. S tem lahko dobimo<br />
resolucijo tudi nekaj MIO točk za celotno poloblo, medtem ko večina merilnikov izmeri<br />
povprečno svetlost le 145 elementom na polobli, pri čemer je kotna širina vsakega elementa 11 0 .<br />
Druga prednost digitalnega aparata je, da lahko beleži hitre spremembe na nebu, saj za vsako<br />
meritev (skupaj s shranjevanjem podatkov na spominsko kartico) potrebuje le nekaj sekund,<br />
medtem ko merilniki potrebujejo tudi do nekaj minut za meritev svetlosti celotne poloble.<br />
Seveda pa ima digitalni fotoaparat tudi slabosti. Ena od večjih slabosti je, da aparat ni odporen<br />
na vse vremenske razmere, zato mora biti zaprt pod stekleno kupolo in v zimskem času tudi<br />
ogrevan. Druga, še večja, slabost pa je izredna občutljivost CDD senzorja. Tako lahko ob<br />
uporabi fotoaparata v jasnem vremenu pričakujemo nepopravljivo škodo na CCD elementu, saj<br />
“Lighting Engineering 2006” stran 177
R-20 “Dnevna svetloba”<br />
direktna sončna svetloba izžge elemente na svetlobnem senzorju. Če želimo uporabljati<br />
fotoaparat tudi ob jasnem vremenu, je obvezna namestitev obroča, ki prepreči dostop direktne<br />
sončne svetlobe na senzor ali vsaj pokrivanje fotoaparata v času, ko meritev ne poteka.<br />
Literatura<br />
[1] CIE S 011/E:2003 /ISO 15469.2004 "Spatial distribution of daylight – CIE standard general sky",<br />
[2] Coutelier, B. Dumortier, D. Luminance calibration of the Nikon Coolpix 900 digital camera. 25th<br />
Session of the CIE, San Diego, pp. 56-59, 25 juin au 2 juillet 2003,<br />
[3] Tregenza, P.R., Analysing sky luminance scans to obtain frequency distribution of CIE Standard<br />
General Sky. Lighting Research and Techology, 2004. 36(4): pp 271-281,<br />
[4] Kittler, R. Darula, S. Perez R., A set of standard skies characterizing daylight conditions for<br />
computer and energy conscious design. Polygrafia SAV, Bratislava, June 1998,<br />
[5] Littlefair, P. J. "A Comparison of Sky Luminance Models with Measured Data from Garston,<br />
United Kingdom". Solar Energy Vol. 53, No. 4, 1994: pp. 315-322,<br />
[6] Perez, R. Seals, R. Michalsky, J.. "All weather model for sky luminance distribution-preliminary<br />
configuration and validation." Solar Energy Vol. 50, No. 3, 1993: pp. 235-245,<br />
[7] Ineichen, P., Molineaux, B., Perez, R. "Sky luminance data validation: comparison of seven<br />
models with four data banks." Solar Energy Vol. 52, No. 4, 1994, pp. 337-346,<br />
[8] Perez, R. Seals, R. Ineichen, P. "Modeling daylight availability and irradiance components from<br />
direct and global irradiance." Solar Energy Vol. 44, No. 5, 1990: pp. 271-289,<br />
[9] Igawa, N. Koga, Y. Matsuzawa, T. Nakamura, H. "Models of sky radiance distribution and sky<br />
luminance distribution". Solar Energy Vol. 77, No. 4, 2004: pp. 137-157<br />
[10] Kittler R.: Relative scattering indicatrix: Derivation from regular radiance/luminance distribution<br />
sky scans, Light Research & Technology 25(3), PP 125-127 (1993)<br />
[11] Kobav M. B., Določanje CIE tipa neba na podlagi meritev porazdelitve svetlosti, štirinajsto<br />
mednarodno posvetovanje Razsvetljava 2005, Postojna, 2005<br />
Avtorjev naslov:<br />
mag. Matej B. Kobav univ. dipl. inž. el<br />
Fakulteta za elektrotehniko<br />
Univerza v Ljubljani<br />
Tržaška 25, Ljubljana, Slovenija<br />
matej.kobav@fe.uni-lj.si<br />
tel.: 01/47 68 759<br />
stran 178 Posvetovanje “Razsvetljava 2006”