GAViewer 0.43 manual (.pdf)
GAViewer 0.43 manual (.pdf)
GAViewer 0.43 manual (.pdf)

Create successful ePaper yourself
Turn your PDF publications into a flip-book with our unique Google optimized e-Paper software.
<strong>GAViewer</strong> Documentation<br />
Version <strong>0.43</strong><br />
Daniël Fontijne<br />
University of Amsterdam<br />
January 12, 2005
Contents<br />
1 Introduction 7<br />
2 The user interface 9<br />
2.1 Theviewwindow........................... 9<br />
2.1.1 Viewpointrotation ...................... 9<br />
2.1.2 Viewpointtranslation .................... 9<br />
2.1.3 Objectselection........................ 10<br />
2.1.4 Objectselection........................ 10<br />
2.1.5 Objecttranslation/modification.............. 10<br />
2.1.6 Viewwindowcontrolsummary .............. 11<br />
2.2 Theconsole .............................. 11<br />
2.3 Objectcontrolswindow ....................... 11<br />
2.4 Scalarcontrolswindow........................ 12<br />
2.5 Themenubar ............................. 12<br />
3 .geo and .gpl files 15<br />
3.1 title ................................... 15<br />
3.2 fgcolor,bgcolor,olcolor,cvcolor................... 16<br />
3.3 e3ga,ca3d,p3ga,ca4d,c3ga,ca5d.................. 16<br />
3.4 label................................... 17<br />
3.5 fontsize................................. 18<br />
3.6 tsmode ................................. 18<br />
3.7 tsfont .................................. 18<br />
3.8 tsreset.................................. 18<br />
3.9 tsinterpret ............................... 19<br />
3.10factor .................................. 19<br />
3.11eyepos,campos ............................ 19<br />
3.12eyetrl,camtrl.............................. 19<br />
3.13eyeori,camori ............................. 19<br />
3.14eyerot,camrot............................. 20<br />
3.15hide,show............................... 20<br />
3.16remove................................. 20<br />
3.17 fade, fade and remove, fade and hide, show and fade ..... 20<br />
3.18sleep .................................. 21<br />
3.19wait................................... 21<br />
3.20exit ................................... 21<br />
3.21clearconsole .............................. 21<br />
3.22console ................................. 21<br />
3
4 CONTENTS<br />
3.23resize .................................. 21<br />
3.24viewwindowsize ........................... 22<br />
3.25consoleheight ............................. 22<br />
3.26consolefontsize ............................ 22<br />
3.27fullscreen................................ 22<br />
3.28bookmark ............................... 22<br />
3.29open,switchto,import ........................ 23<br />
3.30clip ................................... 23<br />
3.31delete.................................. 23<br />
3.32 polygon, simplex . . . ........................ 23<br />
3.33mesh .................................. 24<br />
3.33.1 meshvertex .......................... 24<br />
3.33.2 meshnormal.......................... 25<br />
3.33.3 meshface............................ 25<br />
3.33.4 Full usage example for mesh ................ 25<br />
3.34play(.gplfilesonly).......................... 25<br />
4 The Programming Language and the Console 27<br />
4.1 Comma,semicolonandspace.................... 27<br />
4.2 ans ................................... 28<br />
4.3 Operators,assignment,precendence ................ 28<br />
4.4 Variables,typesandcasting ..................... 29<br />
4.5 BuiltinConstants ........................... 30<br />
4.5.1 Renamingbuiltinconstants ................. 31<br />
4.6 Addingyourownconstants..................... 31<br />
4.7 ’Arrays’................................. 31<br />
4.8 Calling functions . . . ........................ 31<br />
4.9 Built-infunctions ........................... 32<br />
4.9.1 Products............................ 32<br />
4.9.2 BasicGAfunctions...................... 33<br />
4.9.3 Boolean ............................ 33<br />
4.9.4 Drawing............................ 34<br />
4.9.5 Controls ............................ 37<br />
4.9.6 Goniometric functions, sqrt, abs, log, exp, pow. . . . . . . 38<br />
4.9.7 Projectivemodelfunctions ................. 38<br />
4.9.8 Conformalmodelfunctions................. 38<br />
4.9.9 Systemfunctions ....................... 39<br />
4.9.10 Networking.......................... 39<br />
4.10Dynamicstatements ......................... 40<br />
4.10.1 NamedDynamicStatements ................ 41<br />
4.10.2 Animations .......................... 42<br />
4.11Controlconstructs........................... 43<br />
4.11.1 if else .............................. 43<br />
4.11.2 for ............................... 43<br />
4.11.3 while .............................. 44<br />
4.11.4 switch ............................. 44<br />
4.12Writingfunctionsandbatches.................... 45<br />
4.12.1 Batches............................. 46<br />
4.13Autocolor. ............................... 47<br />
4.13.1 Writing your own autocolor() function. .......... 47
CONTENTS 5<br />
5 Typesetting labels. 49<br />
5.1 txt and eqn modes. .......................... 50<br />
5.1.1 txt modedetails: ....................... 50<br />
5.1.2 eqn modedetails:....................... 51<br />
5.2 Fonts .................................. 52<br />
5.3 Scalingoffonts ............................ 53<br />
5.4 Forcedwhitespace,forcednewlines ................ 53<br />
5.5 Alignment . .............................. 54<br />
5.6 Sub-andsuperscript ......................... 54<br />
5.7 Parentheses .............................. 55<br />
5.8 Tabulars ................................ 55<br />
5.9 (Square)roots ............................. 57<br />
5.10Fractions ................................ 58<br />
5.11Hats................................... 58<br />
5.12Colors.................................. 58<br />
5.12.1 Customcolors......................... 59<br />
5.13Customcommands.......................... 59<br />
5.14Specialsymbols ............................ 60
6 CONTENTS
Chapter 1<br />
Introduction<br />
<strong>GAViewer</strong> is a multi-purpose program for performing geometric algebra computations<br />
and visualizing geometric algebra. Some possible uses are:<br />
• Visualizing geometric algebra output from other programs.<br />
• Interactively performing GA computations and visualizing the outcome.<br />
• Presenting lectures, slideshows, doing tutorials, demonstrations, with<br />
(interactive) geometric algebra animations.<br />
• Rendering (hi-res) images of GA objects for use in papers.<br />
• Debugging other programs that use geometric algebra.<br />
We do not consider <strong>GAViewer</strong> appropriate for implementing ’serious’ applications.<br />
The internal (interpreted) programming language is too slow and limited<br />
for such purposes.<br />
<strong>GAViewer</strong> has outgrown its original purpose. We initially created <strong>GAViewer</strong><br />
as a small program for visualizing GABLE/Matlab output because we weren’t<br />
satisfied with the Matlab graphics. Then we wanted to have a typesetting system<br />
for labels and support for slideshows. After some time the desire rose to<br />
add a console for interactive computations inside the viewer. After a console<br />
was added, we wanted to have functions and batches. Then dynamic statements<br />
were added. The latest additions include animations based an dynamic<br />
statements and scalar controls.<br />
In the following chapters, the various features of <strong>GAViewer</strong> are described<br />
in the following order:<br />
• The user interface.<br />
• Visualizing geometric algebra output from other programs using .geo<br />
files.<br />
• The programming language.<br />
• Typesetting labels.<br />
• Using .geo files for slideshows and presentations.<br />
7
8 CHAPTER 1. INTRODUCTION
Chapter 2<br />
The user interface<br />
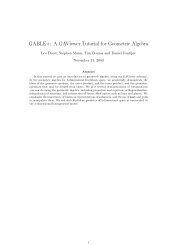
When you start <strong>GAViewer</strong>, it should look something like figure 2.1. At the top<br />
of the window, there is a standard menu bar, desribed in section 2.5. The largest<br />
part of window is occupied the view window (section 2.1). At the bottom, there<br />
is the console (section 2.2). The right part of the window is split into the object<br />
controls (section 2.3) and the scalar controls (section 2.4).<br />
Finally, at the very bottom of the window there is the status bar, andthe<br />
pause button, which is useful during presentations.<br />
2.1 The view window<br />
In the view window, all currently visible objects are drawn. You can rotate<br />
and translate your viewpoint, select objects and translate most types of objects.<br />
All this is done using certain combinations of mouse movements, mouse<br />
clicks/drags and the ctrl button, as explained below.<br />
First, let’s create some objects such that the view window isn’t empty. On<br />
the console, type<br />
>> a = no, b = green(e1), c = e2 ˆ e3<br />
This draws a flat shaded red point a, a green vector b and a blue bivector (disc)<br />
c.<br />
2.1.1 Viewpoint rotation<br />
To rotate the your viewpoint, hold the left mouse button down while the mouse<br />
is inside the viewpoint, and move the mouse. Let’s call this left mouse drag<br />
for short. The view window has a so-called spaceball interface. This means that<br />
if you left mouse drag in the center of the view window, the viewpoint will<br />
rotate about an axis in the screen plane, and if you left mouse drag outside<br />
the center, the viewpoint will rotate about the axis perpendicular to the screen<br />
plane.<br />
2.1.2 Viewpoint translation<br />
Viewpoint translation is a lot simpler than rotation. Middle mouse drag will<br />
translate your viewpoint parallel to the screen plane, right mouse drag will<br />
9
10 CHAPTER 2. THE USER INTERFACE<br />
menu Bar<br />
view<br />
window<br />
object<br />
controls<br />
console<br />
scalar<br />
controls<br />
status bar<br />
pause button<br />
Figure 2.1: <strong>GAViewer</strong> user interface.<br />
translate perpendicular to the screen plane.<br />
2.1.3 Object selection<br />
Hold down the ctrl button and left mouse click on one of the objects in the<br />
view window. This selects the object and shows information and controls in<br />
the object controls window on the right.<br />
If an object is hidden behind another object, you can still select it by cycling<br />
through the objects. For instance, ctrl left mouse click the red point a in the<br />
center of the disc c. This will select a. Now don’t move the mouse, and ctrl left<br />
mouse click again at exactly the same location. This will select c or b. ctrl left<br />
mouse click again to continue cycling until you have selected the object you<br />
want.<br />
2.1.4 Object selection<br />
Sometimes, you may want to select an object and also have it’s name on the<br />
console, to use it in some calculation. This can be achieved by ctrl middle<br />
mouse clicking the object.<br />
2.1.5 Object translation / modification<br />
Many objects allow some kind of translation / modification to be performed<br />
on them by ctrl right mouse dragging. For example, the red point a can be<br />
translated, as can the tip of the green vector b. The blue bivector c can not be<br />
translated, but you can modify its size by ctrl right mouse dragging.
2.2. THE CONSOLE 11<br />
2.1.6 View window control summary<br />
rotate<br />
translate<br />
select<br />
select, copy name to console<br />
translate/modify<br />
left mouse drag<br />
middle mouse drag and<br />
right mouse drag<br />
ctrl left mouse click<br />
ctrl middle mouse click<br />
ctrl right mouse drag<br />
2.2 The console<br />
The console is used to do interactive computations. On the console, you can<br />
write geometric algebra expressions and a lot more, as described in the chapter<br />
4. Here, we describe only the user interface of the console.<br />
To type something on the console, click somewhere after the current prompt<br />
(>>) to place the cursor where you want it. Then type away. If you click before<br />
the current prompt, the first character you type will be lost and the cursor will<br />
jump to the end of the current input.<br />
You can select text by dragging the mouse, or holding shift and using the<br />
arrow keys. Copy selected text with ctrl-c. You can paste text using ctrl-v. Cut<br />
using ctrl-x.<br />
To jump from one bracket to the first one matching it, use ctrl-e. Forexample,<br />
type something like:<br />
>> a = ((c . b) x[3 i]) ˆ y<br />
Locate the cursor at any of the brackets, and press ctrl-e. The cursor will jump<br />
to the matching bracket.<br />
To execute what you have typed, press enter.<br />
To retrieve previous commands, press the up arrow, usethedown arrow<br />
to get back again.<br />
The console is based on the FLTK FL Text Editor widget, so if you want to<br />
know more details, see the FLTK documentation.<br />
2.3 Object controls window<br />
In this section, we assume you have executed the following line from the previous<br />
section:<br />
>> a = no, b = green(e1), c = e2 ˆ e3<br />
You can execute it again if you want the original objects back.<br />
When you ctrl left click one of the objects in the view window, it becomes<br />
the current object and you can control it somewhat using the object controls<br />
window on the right of <strong>GAViewer</strong> (see figure XXX).<br />
Atthetopofthewindow,youseethenameofthecurrentobject.Thetwo<br />
buttons below can be used to remove or hide that object.<br />
For most objects, you can set the foreground color and alpha (opacity) using<br />
the set foreground color and alpha widgets. Some objects, like labels, also<br />
have an outline or background color.
12 CHAPTER 2. THE USER INTERFACE<br />
The checkboxes in the middle of the window can be used to make some<br />
visual distictions between objects. E.g., you could stipple imaginary objects,<br />
or turn of the shading to indicate flatness.<br />
Certain objects can be drawn in multiple ways. For instance, select the blue<br />
bivector c. Ithasadraw method pull down menu from which you can choose<br />
various ways of drawing a bivector.<br />
At the very bottom of the object controls window is a text field that shows:<br />
• The interpretation of the object.<br />
• Some numerical properties that are used to draw the object.<br />
• The coordinates of the object (with limited precision).<br />
When the object controls window is hidden (menu View→Controls), you can<br />
still see a ’condensed’ version of this information in the status bar.<br />
2.4 Scalar controls window<br />
You can create a scalar control on the console like this:<br />
>> ctrl_range(a = 2.0, 0.5, 10.0)<br />
It will appear in the lower right corner of <strong>GAViewer</strong>.<br />
Scalar controls are explained in 4.9.5. For the scalar controls window to be<br />
visible, the console or the object controls window must be visible.<br />
2.5 The menu bar<br />
The menu bar has the following structure:<br />
• File<br />
• View<br />
–Open: allows you to open any type of file.<br />
–Open→<br />
∗ Open geo file: opensa.geo file<br />
∗ Open geo playlist: opensa.gpl file<br />
∗ Open g file: opensa.g file<br />
– Load .g directory: allows you read an entire directory full of .g files<br />
in one run. Will also read subdirectories.<br />
– Save state: save the current state of the <strong>GAViewer</strong> into a .geo file.<br />
–Replay: replays the current .geo file.<br />
– Next file in playlist: switches to the next .geo file in the current<br />
playlist.<br />
– Previous file in playlist: switches to the previous .geo file in the<br />
current playlist.<br />
–Exit:terminates<strong>GAViewer</strong>.
2.5. THE MENU BAR 13<br />
– Select object: pops up a dialog that allows you to select any object.<br />
–Hide: allows interaction with hidden objects.<br />
∗ Unhide all: shows all hidden objects.<br />
∗ Select hidden object: pops up a dialog that allows you to select<br />
a hidden object.<br />
∗ Show hidden object: pops up a dialog that allows to toggle the<br />
hide/show state of hidden objects.<br />
–Canvas: selects the color of the canvas (white, (light) grey or black).<br />
– Console font size: selects the font size used on the console.<br />
– Controls: toggles whether the object controls window is visible.<br />
– Scalar Controls: toggles whether the scalar controls window is visible.<br />
–Console: toggles whether the console is visible.<br />
– Labels always on top: when on, labels will always be drawn on top<br />
of other objects.<br />
– Fullscreen: toggles fullscreen/windowed user interface. In fullscreen<br />
mode, only the view window will be visible.<br />
• Dynamic: contains dynamic statement and animation related items.<br />
• Utils<br />
• Help<br />
– View Dynamic statements: pops up a dialog where you can view/modify<br />
the current dynamic statements (see section 4.10).<br />
– Start / resume animation:startstheatime variable (see section 4.10.2).<br />
– Pause animation: pausestheatime variable.<br />
– Stop animation: stops the atime variable.<br />
– Playback speed: controls how fast animations play.<br />
– Search for next bookmark: goes to the next bookmark in the current<br />
.geo file, if any.<br />
– Output current camera orientation (bivector): prints the current<br />
camera (viewpoint) orientation (camori) to the console, in bivector<br />
form.<br />
– Output current camera orientation (rotor): same as above, but in<br />
rotor form.<br />
– Output current camera translation: prints camera the translation<br />
(campos) to the console.<br />
– Screenshot: pops up a dialog that allows you to renders a screenshot<br />
of the view window in arbitrary resolution. The file is stored in<br />
the .png file format.<br />
– About: displays some info about <strong>GAViewer</strong>.
14 CHAPTER 2. THE USER INTERFACE
Chapter 3<br />
.geo and .gpl files<br />
.geo files are one form of input that <strong>GAViewer</strong> can handle. The others are the<br />
console and .g files. .geo files are harder to write by hand than .g file, but can be<br />
very useful for presentations and displaying output from other programs. The<br />
.geo fileformatisalsousedtostorethe state of the <strong>GAViewer</strong> (menu File→Save<br />
state).<br />
The .geo file format can do things that the .g ’programming language’ can’t<br />
and vice versa. This has grown historically. If we were to redesign <strong>GAViewer</strong><br />
we would choose one unified, richer, programming language able to do everything.<br />
Every line in a .geo filehasthefollowingformat:<br />
keyword arguments<br />
The keyword can be something like fgcolor, e3ga or delete. The arguments<br />
vary per keyword. You can not split keyword and arguments over multiple<br />
line. Everything following a ’#’ sign is considered comment (unless the #’ is<br />
somewhereinsideaquotedstring):<br />
#this is comment<br />
label label_1 [1.0*e1+1.0*e2] "a quoted string with a # inside"<br />
We now describe every keyword and its arguments. At the end of this<br />
list there is one entry play which is valid only for .gpl files. These are ’geo<br />
playlists’ and can be used to play multiple .geo in a sequence. This is useful for<br />
presentations.<br />
3.1 title<br />
Sets the title bar of the viewer window. Usage example:<br />
title "this is my demo"<br />
Sets the title bar of the window to ’<strong>GAViewer</strong>: this is my demo’<br />
15
16 CHAPTER 3. .GEO AND .GPL FILES<br />
3.2 fgcolor, bgcolor, olcolor, cvcolor<br />
Set the current foreground, background outline and canvas color. All objects<br />
read after these keywords will be drawn in those colors. The canvas color<br />
affects only the canvas (background) of the viewing window.<br />
As argument you can either supply a color name or a RGB value with optional<br />
alpha (transparency). Possible color names are:<br />
• ”r” or ”red”<br />
• ”g” or ”green”<br />
• ”b” or ”blue”<br />
• ”w” or ”white”<br />
• ”gray” or ”grey”<br />
• ”k” or ”black”<br />
• ”c” or ”cyan”<br />
• ”m” or ”magenta”<br />
• ”y” or ”yellow”<br />
Usage examples:<br />
fgcolor red<br />
cvcolor 1.0 0.5 0.1<br />
olcolor 0.0 0.0 0.0 0.5<br />
# set foreground color to red<br />
# set canvas color to orange<br />
# set outline color to semi-transparent black<br />
The range for the RGBA values is [0.0 1.0].<br />
3.3 e3ga, ca3d, p3ga, ca4d, c3ga, ca5d<br />
Draws an object from the euclidean (e3ga, ca3d), projective p3ga, ca4d), conformal<br />
model (c3ga, ca5d) of 3D Euclidean Geometry. The names caNd mean<br />
’Clifford Algebra N Dimensional’. e3ga means Euclidean 3D Geometric Algebra.<br />
p3ga means Projective 3D Geometric Algebra. c3ga means Conformal 3D<br />
Geometric Algebra. These algebras are all considered 3D since they are interpreted<br />
as performing 3D geometry. The general syntax is:<br />
c3ga "object name" [multivectorCoordinates] flag1 flag2 flagn<br />
The multivector coordinates must be in the format that the Gaigen multivector<br />
parser can understand.<br />
The ”object name” can be a quoted string or a string not containing any<br />
spaces. A maximum of 8 flags is allowed. The flags can alter certain properties<br />
of the object. Possible flags are:<br />
• hide: immediately hides the object.<br />
• show: immediately draws the object (default).
3.4. LABEL 17<br />
• stipple: draws the object stippled.<br />
• orientation: draws something related to the orientation of the object, if<br />
possible.<br />
• wireframe: draws the object in wireframe, if possible.<br />
• magnitude: draws the magnitude (called weight in the <strong>GAViewer</strong> UI) of<br />
the object, if possible.<br />
• shade: shades the object, if possible.<br />
• versor: force versor interpretation of the multivector (e.g. to interpret a<br />
blade like a versor).<br />
• blade: force blade interpretation of the multivector (e.g. to interpret ’0’<br />
as a blade).<br />
• grade0 ... grade8: force gradeX interpretation of multivector (e.g. to interpret<br />
’0’ as a vector).<br />
• dm1 ... dm7: use draw method 1 to 7, if supported by the object. Some<br />
object can be drawn in multiple ways. The default draw method is ’1’.<br />
Usage examples:<br />
c3ga "the arbitrary origin" [no]<br />
e3ga stippled_vector [e1+e2+e3] stipple<br />
e3ga z [4.0*e3ˆe1] magnitude orientation dm2<br />
3.4 label<br />
Adds a label to the scene. The syntax is:<br />
label "name" "point" "text" flag1 flag2 ... flagn<br />
Draws a label (in current colors and font siz, and other typesetting parameters)<br />
at position ’point’. ’point’ can be any previously specified multivector object<br />
which has a point interpretation, or a 3D multivector coordinates like [1.0*e1 +<br />
2.0*e3].<br />
The flags can be some of the following:<br />
• 2d: label coordinates are in 2D window coordinates.<br />
• 3d: label coordinates are in 3D world coordinates (default).<br />
• cx: x-axis origin is in center of window (only in combination with 2D).<br />
• cy: y-axis origin is in center of window (only in combination with 2D).<br />
• px: positive x axis is towards the right (only in combination with 2D).<br />
• nx: positive x axis is towards the left (only in combination with 2D).<br />
• py: positive y axis is towards the bottom (only in combination with 2D).
18 CHAPTER 3. .GEO AND .GPL FILES<br />
• ny: positive y axis is towards the top (only in combination with 2D).<br />
• acx: the label is x-aligned in the center of the window (overrides all other<br />
commands related to the ’X’-axis, only in combination with 2D).<br />
• dynamic: the position of the label will follow the multivector object ’point’.<br />
• image: the label text is actually a filename of a .png image that will be<br />
displayed inside the label.<br />
• fullscreen: scales the images such that it fill the viewer/screen (only in<br />
combination with image) (image width/height proportion is not fixed).<br />
Usage examples:<br />
label simple [1.0*e1] "a simple label"<br />
label attached_to_z z "this label follows ’z’" dynamic<br />
label fullscreen_image [0] "c:\images\dog.png" 2d image fullscreen px py<br />
3.5 fontsize<br />
Sets the size of the font for the labels in pixels. Usage example:<br />
fontsize 30.0<br />
3.6 tsmode<br />
Sets the initial parsing mode of the typesetting system for labels. See chapter<br />
5 for more details on typesetting. The mode can be any of: text, equation,<br />
verbatim, uppercase or lowercase. In fact, only the first character of the string<br />
is used to determine the mode. Verbatim mode bypasses the whole typesetting<br />
system and displays labels using the regular ASCII characters directly.<br />
Usage example:<br />
tsmode equation<br />
3.7 tsfont<br />
Sets the initial font of the typesetting system for labels See chapter 5 for more<br />
details on typesetting. The font can be any of: regular, bold, italic, greek,<br />
uppercase or lowercase. In fact, only the first character of the string is used to<br />
determine the font.<br />
Usage example:<br />
tsfont italic<br />
3.8 tsreset<br />
Resets the typesetting system to its initial mode. See chapter 5 for more details<br />
on typesetting.<br />
Usage example:<br />
tsreset
3.9. TSINTERPRET 19<br />
3.9 tsinterpret<br />
Sends text to the typesetting system. See chapter 5 for more details on typesetting.<br />
It is then parsed and interpreted, but not displayed. This is useful for<br />
adding custom commands and colors to the typesetting system.<br />
Usage example:<br />
tsinterpret "some string"<br />
Sends ”some string” to the typesetting system. The typesettings system mode<br />
(as set with tsmode)isalwaysforcedtotext during a tsinterpret!<br />
3.10 factor<br />
Specifies a custom factor for factorization. These are used during the interpretation<br />
of some multivectors. (currently only the e3ga bivector and trivector)<br />
Syntax:<br />
factor model idx [vectorCoordinates]<br />
’model’ specifies for which model this factor is intended (c3ga, ca5d), (p3ga,<br />
ca4d), (e3ga, ca3d). ’idx’ specifies the index of the factor [1 ... d] (d = dimension<br />
of the model).<br />
Usage examples:<br />
factor e3ga 1 [1.0*e1]<br />
factor e3ga 2 [1.0*e2]<br />
factor e3ga 3 [1.0*e3]<br />
3.11 eyepos, campos<br />
Sets the position of the eye/camera Usage example:<br />
campos [10.0*e3]<br />
3.12 eyetrl, camtrl<br />
Translates the eye/camera over a specified vector per second during a specified<br />
time. Usage example:<br />
camtrl 10.0 [1.0*e3]<br />
The first argument is the duration, the second the translation vector. If the<br />
duration is 0, the translation in instantanious.<br />
3.13 eyeori, camori<br />
Sets the orientation of the eye/camera Usage example:<br />
camori [1.0*e1ˆe2]<br />
The coordinates specify a bivector that will be exponentiated to create a rotor.
20 CHAPTER 3. .GEO AND .GPL FILES<br />
3.14 eyerot, camrot<br />
Rotates the eye/camera over a specified plane/angle per second during a specified<br />
time. Syntax: Usage example:<br />
camrot 10.0 [1.0*e1ˆe2]<br />
The first argument is the duration, the second the rotation bivector. If the duration<br />
is 0, the rotation in instantanious.<br />
3.15 hide, show<br />
Hides or shows a specified object (can be a label, algebra object, polygon, etc)<br />
or user interface element.<br />
Usage examples:<br />
show "name of object"<br />
hide "name of object"<br />
The user interface elements that can affected by hide and show are:<br />
• controls: object controls window.<br />
• scalar controls: scalar controls window.<br />
• console: the console.<br />
3.16 remove<br />
Removes the specified object. Usage example:<br />
remove x<br />
3.17 fade, fade and remove, fade and hide, show and fade<br />
The keywords allow you to fade in and out objects. Before the fade, the object<br />
can be shown (show and fade). After the fade is over, the object can be hidden<br />
(fade and hide) or removed (fade and remove). The syntax is:<br />
fade "object name" fade_duration fade_target fade_start<br />
The first argument is the name of the object. The second argument is the duration<br />
of the fade in seconds. The third argument is the target alpha of the fade.<br />
The fourth, optional argument is the alpha at the start of the fade. Using fade<br />
will not actually modify the alpha of the any of the colors of the object, but<br />
rather multiplies those alpha values before they are sent to OpenGL.<br />
Usage examples:<br />
fade x 2.0 1.0<br />
fade_and_remove y 1.0 0.0 1.0
3.18. SLEEP 21<br />
3.18 sleep<br />
Pauses the reading of the input file for a specified number of seconds. User<br />
interface will be fully functional during this sleep.<br />
Usage examples:<br />
sleep 10.0<br />
Sleeps for 10.0 seconds. The maximum resolution for the sleep time is about<br />
1/30th of a second.<br />
3.19 wait<br />
Pausesthereadingoftheinputfileuntilthewaiting button is pressed. Usage<br />
example:<br />
wait<br />
3.20 exit<br />
Terminates the <strong>GAViewer</strong> immediately. Usage example:<br />
exit<br />
3.21 clearconsole<br />
Clears the console and removes scalar controls. Usage example:<br />
clearconsole<br />
3.22 console<br />
console allows you to execute a command in a .geo as if it was typed on the<br />
console. Usage example:<br />
console a = e1 ˆ e2<br />
3.23 resize<br />
Changes the size and optionally the position of the <strong>GAViewer</strong> window. Syntax:<br />
resize w h<br />
resize x y w h<br />
The first format (with 2 arguments) changes the width and height of the window<br />
to w and h. The second format (with 4 arguments) also sets the position<br />
to x and y.
22 CHAPTER 3. .GEO AND .GPL FILES<br />
3.24 viewwindowsize<br />
Changes the size of the view window. This will resize the main window and<br />
keep the height of the console and the width of the controls constant. Usage<br />
example:<br />
viewwindowsize 1024 768<br />
3.25 consoleheight<br />
Changes the height of the console. This will resize the console and the view<br />
window to achieve the desired height. Usage example:<br />
consoleheight 10 lines<br />
consoleheight 200 pixels<br />
You must specify eiter pixels or lines.<br />
3.26 consolefontsize<br />
Changes the size (in pixels) of the font used on the console. Usage example:<br />
consolefontsize 14<br />
3.27 fullscreen<br />
Sets the viewer to fullscreen mode or windowed mode. Only the view window<br />
is visible in full screen mode. Usage examples:<br />
fullscreen<br />
fullscreen on<br />
fullscreen off<br />
The first two lines turn fullscreen mode on, the second line turns it off. In<br />
fullscreen mode, a small red W may be visible in the lower right corner when<br />
<strong>GAViewer</strong> would normally flash the waiting button.<br />
3.28 bookmark<br />
Indicates a bookmark in the file. When the user selects menu bar item utils→search<br />
for next bookmark, input will be parsed quickly until such a bookmark is<br />
found. This is useful for skipping through a (slow) demo quickly. Usage example:<br />
bookmark "optional name that is not used yet"
3.29. OPEN, SWITCHTO, IMPORT 23<br />
3.29 open, switchto, import<br />
These keywords all open a .geo file. <strong>GAViewer</strong> maintains an internal stack of<br />
open files.<br />
• open opens a new file at the top level. All current files are removed from<br />
the stack and the new file becomes the only open file.<br />
• switchto closes the top-level file and replaces it with the new file.<br />
• import pushesthenewfileontopofthefilestackandstartsreadingit<br />
You can give argument to these commands which will be available as $1, $2,<br />
etc, in the files. Usage examples:<br />
switchto file1.geo<br />
import conformal_paraboload.geo paraboloid<br />
open matlab.geo<br />
The second example give the argument ’paraboloid’ to conformal paraboload.geo.<br />
Any occurence of $1 in conformal paraboload.geo will be replaced with ’paraboloid’.<br />
3.30 clip<br />
Sets the distance of the clipping planes to the origin. Currently not functional.<br />
Usage examples:<br />
clip 10.0<br />
3.31 delete<br />
Specifies whether to delete this .geo file or not when a new file is opened or<br />
<strong>GAViewer</strong> is terminated. This used to be useful when <strong>GAViewer</strong> was only<br />
used to visualize Matlab output, where .geo files were usually just a temporary<br />
communication channel. Syntax:<br />
delete [yes|no|ask] "question to ask"<br />
If the first argument is ’ask’ the user is asked whether to delete or not. The<br />
question to ask can be supplied as the optional second argument. If you use<br />
’by the name of the file. Usage examples:<br />
delete yes<br />
delete ask "delete %s?"<br />
3.32 polygon, simplex<br />
Creates a polygon or simplex object. Syntax:<br />
polygon "polygon name" nb "p 1" "p 2" "p n" flag1 flag2 flagn<br />
simplex "simplex name" nb "p 1" "p 2" "p n" flag1 flag2 flagn
24 CHAPTER 3. .GEO AND .GPL FILES<br />
The first argument is the name of the object. The second the number of vertices,<br />
followed by a name of a ’point’ for every vertex. After that, a number of flags<br />
can be added. The maximum number of vertices is 3 for a simplex. Polygons<br />
must be convex, or the resulting graphics will be unpredicatble. The ”p 1” ...<br />
”p n” are names of objects that have some kind of point interpretation. E.g.,<br />
they can be vectors in the 3D model, or points in the conformal model.<br />
Possible flags:<br />
• dynamic: the vertices of the polygon will lookup their position from the<br />
original point objects everytime the polygon gets redrawn.<br />
• outline: draws an outline around the polygon.<br />
• dm1 ... dm7: usedrawmethod1to7(dm1: filled, dm2: line strip, dm3:<br />
line loop, dm4: 1D simplex is drawn as true vector).<br />
Usage example:<br />
polygon "P1 -> Q2" 2 P1 Q2 dm2<br />
3.33 mesh<br />
This keyword allows for the creation of a mesh object. A mesh consists of a<br />
number of vertices (with optional surface normals) and polygons. The vertices,<br />
surface normals and polygons are specified after the mesh. The syntax of mesh<br />
is:<br />
mesh "mesh name" normal_flag<br />
’normal flag’ can be<br />
• compute normals flat: compute the surface normals such that the object<br />
will have a flat shaded appearance.<br />
• compute normals gouraud: compute the surface normals such that the<br />
object will have a smooth (Gouraud) shaded appearance.<br />
• specify normals: specify normals in the file.<br />
The mesh must be followed by its vertices, normals and faces, described below.<br />
Usage example (a full example is given after the meshvertex, meshnormal<br />
and meshface have been described:<br />
mesh teapot compute_normals_gouraud<br />
3.33.1 meshvertex<br />
The syntax of meshvertex is:<br />
meshvertex "mesh name" index point<br />
The mesh name refers to the mesh name given in an earlier mesh keyword.<br />
index is the positive index of the vertex in the list of vertices. point can be the<br />
name of an existing object with a point interpretation, or the 3D coordinates of<br />
the point between square brackets. Usage example:<br />
meshvertex teapot 0 [1.0e1 + 1.0*e3]
3.34. PLAY (.GPL FILES ONLY) 25<br />
3.33.2 meshnormal<br />
meshnormal allows you to specify the surface normal at a vertex. The syntax<br />
of meshnormal is:<br />
meshnormal "mesh name" index vector<br />
The mesh name refers to the mesh name given earlier in a mesh keyword.<br />
index is the positive index of the vertex in the list of vertices. point can be the<br />
name of an existing object with a vector interpretation, or the 3D coordinates<br />
of the vector (not a bivector.... :) between square brackets. Usage example:<br />
meshnormal teapot 0 [1.0e1 + 1.0*e3]<br />
3.33.3 meshface<br />
meshface specifies a face of a mesh. It can have an arbitrary (current max 16)<br />
number of vertices. Vertices should be listed in counter clockwise order, when<br />
viewed from the front side. The syntax is:<br />
meshface "mesh name" vertex_idx1 vertex_idx2 ... vertex_idxN<br />
Usage example:<br />
meshface teapot 295 327 328<br />
3.33.4 Full usage example for mesh<br />
This example should draw a cube (you may have to zoom out to see it, if these<br />
are the only commands in a .geo file. Usage example:<br />
mesh cube compute_normals_flat<br />
meshvertex cube 0 [1.0*e1+-1.0*e2+1.0*e3]<br />
meshvertex cube 1 [1.0*e1+-1.0*e2+-1.0*e3]<br />
meshvertex cube 2 [-1.0*e1+-1.0*e2+-1.0*e3]<br />
meshvertex cube 3 [-1.0*e1+-1.0*e2+1.0*e3]<br />
meshvertex cube 4 [1.0*e1+1.0*e2+1.0*e3]<br />
meshvertex cube 5 [1.0*e1+1.0*e2+-1.0*e3]<br />
meshvertex cube 6 [-1.0*e1+1.0*e2+-1.0*e3]<br />
meshvertex cube 7 [-1.0*e1+1.0*e2+1.0*e3]<br />
meshface cube 3 2 1 0<br />
meshface cube 0 1 5 4<br />
meshface cube 0 4 7 3<br />
meshface cube 5 1 2 6<br />
meshface cube 6 2 3 7<br />
meshface cube 4 5 6 7<br />
3.34 play (.gpl files only)<br />
.gpl files are very special .geo files that can contain only one type of keyword:<br />
play. The syntax of play is:
26 CHAPTER 3. .GEO AND .GPL FILES<br />
play filename.geo arg1 arg2 ... argN<br />
The arguments are optional and will replace $1, $2 ... $N. A playlist for a presentation<br />
could look like this:<br />
play ppt/ppt.geo ppt_01_title.png<br />
play ppt/ppt.geo ppt_02_overview_1.png<br />
play ppt/ppt.geo ppt_02_overview_2.png<br />
play ppt/ppt.geo ppt_02_overview_3.png<br />
play ppt/ppt.geo ppt_02_overview_4.png<br />
#block 1<br />
play ppt/ppt.geo ppt_03_block1.png<br />
play demos/crossproduct.geo<br />
play demos/outerproduct.geo<br />
play demos/trivector.geo<br />
play demos/basiselements.geo<br />
...
Chapter 4<br />
The Programming Language<br />
and the Console<br />
<strong>GAViewer</strong> contains a small internal programming language. It is basically a C-<br />
like language, with features like functions and conditional control structures,<br />
global and local scopes. It has a very limited set of types (3D Euclidean multivectors,<br />
4D homogeneous multivectors, 5D conformal multivectors). These<br />
types can be automatically coerced. Functions can be overloaded. There is limited<br />
support for arrays. Dynamic statements allow for quite amazing flexibility.<br />
Dynamic statements depend on the variables used to evaluate them. Every time<br />
such a variable changes, the dynamic statement is reevaluated.<br />
The programming language can be used on the console, and in .g files.<br />
These files typically contain functions and batches.<br />
A large number of built in functions are provided too handle all kinds of<br />
typical GA operations.<br />
4.1 Comma, semicolon and space<br />
As in Matlab, the symbol used to terminate a statement determines if the result<br />
is shown on the console/view window. Typing<br />
>> a = e1,<br />
will pop up a vector in the view window and show you the coordinates of a on<br />
the console. On the other hand, typing<br />
>> a = e1;<br />
hides the vector and does not print its coordinates. The multivector a still exists,<br />
but it is simply not shown. You can use the menu view→hide→show<br />
hidden object to make it appear again. Using no symbol to end a statement is<br />
equivalent to a comma:<br />
>> a = e1<br />
This will again pop up a vector in the view window and show you the coordinates<br />
of a on the console. In .g files, you must always terminate all statements<br />
with either a semicolon or a comma.<br />
27
28 CHAPTER 4. THE PROGRAMMING LANGUAGE AND THE CONSOLE<br />
4.2 ans<br />
When you type e1 on the console:<br />
>> e1<br />
ans = 1.00*e1<br />
you’ll see that the value of the statement e1 gets assigned to ans.<br />
When you enter a statement on the console that’s (implicitly) terminated<br />
with a comma, every variable that was assigned a value is displayed on the<br />
console and in the view window. If no assignments were made, the result of<br />
the statement is assigned to the ans variable.<br />
When you enter a statement that is terminated by a semicolon, ans is deleted.<br />
4.3 Operators, assignment, precendence<br />
A number of operators is available for commonly used functions. Unary prefix<br />
operators:<br />
symbol function<br />
∼ reverse<br />
− negate<br />
! inverse<br />
The unary operators have the highest precedence, so they are executed before<br />
any other operations. Because each of these operators will cancel itself,<br />
<strong>GAViewer</strong> will determine if it is necessary to execute it. So if you can write<br />
minus minus not not tilde tilde x not a single operator function will be to x<br />
because all operators cancel each other.<br />
The following binary operators are available: (in order of precedence):<br />
symbol function precedence level<br />
∧ outer product 9<br />
| join 8<br />
& meet 8<br />
. inner product 7<br />
’space’ geometric product 6<br />
∗ geometric product 6<br />
/ inverse geometric product 6<br />
+ addition 5<br />
− subtraction 5<br />
< less 4<br />
> greater 4<br />
= greater or equal 4<br />
== equal 3<br />
!= not equal 3<br />
&& boolean and 2<br />
|| boolean or 1<br />
= assignment 0<br />
All operators are left associative, except assignment which is right associative<br />
(but it isn’t really an operator...) The geometric product can be written as<br />
either a space or a ∗, so the following two lines are equivalent:
4.4. VARIABLES, TYPES AND CASTING 29<br />
>> x = a b;<br />
>> x = a * b;<br />
All these operators are internally translated to function calls by <strong>GAViewer</strong><br />
(sections 4.9.1 and 4.9.3). The . operator is translated to hip (Hestenes inner<br />
product) by default, but it can be set by the inner product() function. The<br />
default is hip, butmhip, rcont and lcont are also possibilities 1 .Thisexample<br />
shows the effect of changing the inner product from Hestenes inner product to<br />
left contraction:<br />
>> e1 ˆ e2 . e1 // here the default Hestenes inner product<br />
ans = -1.00*e2<br />
>> inner_product(lcont)<br />
>> e1 ˆ e2 . e1 // now the left contraction is used<br />
ans = 0<br />
>><br />
4.4 Variables, types and casting<br />
Variables like x, a and b in the example above always have a type. This type<br />
can be e3ga (Euclidean), p3ga (projective, homogeneous) or c3ga (conformal).<br />
Variables usually ’inherit’ their type from the variables used to compute them.<br />
So if in th example above a and b are both of type p3ga, then the result x will<br />
also be of type p3ga.<br />
The type of a variable determines how a variable gets interpreted and drawn.<br />
<strong>GAViewer</strong> can analyze blades and versors from the three models, and draws<br />
them as such. Multivectors that can not be analyze are cam not be drawn.<br />
The type of a variable can also be explicit set or cast:<br />
>> a = (c3ga)e3<br />
a = e3<br />
>> b = (e3ga)ni<br />
b = 0<br />
As you can see in the example b = (c3ga)ni, no interpretation is done during<br />
casting. Since there is no ni basis vector in the e3ga model, it is simply<br />
discarded. As an other example, a ’free vector’ in the conformal model will not<br />
turn into a regular vector in the Euclidean model by simply casting it.<br />
If a variable name does not exist yet, it is assumed to be 0:<br />
>> a = longVariableNameThatDoesNotExistYet<br />
a = 0<br />
This can be quite confusing if you mistype the name of a function:<br />
>> a = duel(x)<br />
a = 0<br />
Here, a typo was made: duel instead of dual. <strong>GAViewer</strong> will assume duel is<br />
a variable instead of the function dual. It computes the geometric product of<br />
duel (which is assumed to be 0)and(x), so the result will be 0 as well.<br />
1 Actually you can use any 2-argument function
30 CHAPTER 4. THE PROGRAMMING LANGUAGE AND THE CONSOLE<br />
If some identifier, like alpha is currently a function, you can force it to become<br />
a variable by using the variable statement. The other way around can be<br />
done by declaring the function again. Consider:<br />
>> a = alpha(e1, 0.5)<br />
a = 1.00*e1<br />
>> variable alpha; // declare alpha -> variable<br />
>> alpha = 1<br />
alpha = 1.00<br />
>><br />
>> function alpha(x, y); // declare alpha -> function<br />
>> alpha = 1 // this is no longer allowed<br />
line 1:7: expecting (, found ’= ’<br />
ans = 1.00<br />
>> a = alpha(e1, 0.5)<br />
a = 1.00*e1<br />
4.5 Builtin Constants<br />
The following builtin constants are available:<br />
• All scalar numbers are constants. Scalar numbers can have the following<br />
forms: 1, 1.2, 1.2e3, 1.2e-3 They are of type e3ga.<br />
• e1, e2, e3: These are the three Euclidean basis vectors, type e3ga.<br />
• e0: the origin in the projective model, type p3ga.<br />
• ni and no: conformal infinity and origin, type c3ga.<br />
• einf: synonym for conformal infinity, type c3ga.<br />
• pi: 3.1415926535897932384626433832795, type e3ga.<br />
• e : 2.7182818284590452353602874713527, type e3ga 2 .<br />
By default, constants always have the type of the smallest model that contains<br />
them. So scalars and the Euclidean basis vectors are all of type e3ga<br />
by default. But this behaviour can be changed by calling the default model()<br />
function. For example:<br />
>> default_model(c3ga);<br />
After this call to default model(), all constants (except e0) will be of type c3ga.<br />
Ifyouwanttogobacktothenormalbehaviour,justcalldefault model() without<br />
any arguments:<br />
>> default_model();<br />
Why does it matter what the default type/model of constants is? It makes<br />
a difference for certain functions, such as dualization with respect to the whole<br />
space. It also makes a difference in interpretation. For example, e3 is drawn as<br />
avectorinthee3ga model, but drawn as a (dual) plane in the c3ga model.<br />
2 ’e ’ is called ’e ’ and not e because otherwise you could not use e as a variable name, which is<br />
quite common.
4.6. ADDING YOUR OWN CONSTANTS 31<br />
4.5.1 Renaming builtin constants<br />
You can rename the builtin constants using the function rename builtin const().<br />
This also effects the textual output of multivector coordinates, as shown in this<br />
small example, which renames the conformal origin (no by default) and infinity<br />
(ni by default) to e0 and einf, respectively.<br />
>> rename_builtin_const(e0, e4); // proj. origin e0 -> e4<br />
>> rename_builtin_const(no, e0); // conf. origin no -> e0<br />
>> rename_builtin_const(ni, einf); // conf. infinity ni -> einf<br />
>> a = e0 ˆ einf<br />
a = 1.00*e0ˆeinf<br />
You have to be careful to avoid nameclashes. In the example, the projective<br />
origin e0 first had to be renamed to e4,sothatno could be renamed to e0.<br />
4.6 Adding your own constants<br />
You can add your own user constants using the add const() and remove them<br />
using remove const(). This is useful, because ordinary variables are removed<br />
when you do a clf(), constants are not. Also, user constants are subject to<br />
the casting/default model rules described above. Here is an example of using<br />
add const() and remove const():<br />
>> add_const(I3 = e1 ˆ e2 ˆ e3);<br />
>> I3<br />
ans = 1.00*e1ˆe2ˆe3<br />
>> remove_const(I3);<br />
4.7 ’Arrays’<br />
Array indices can be used to generate new variable identifiers. <strong>GAViewer</strong> does<br />
not have any real support for arrays. For example, you can not pass arrays to<br />
functions or return them from functions. The C-like syntax for accessing an<br />
array element in <strong>GAViewer</strong> is A[idx1][idx2] ... [idxN].<br />
4.8 Calling functions<br />
A function is called as follows:<br />
>> returnValue = func_name(arg1_name, ... , argn_name);<br />
For example, if you want to project blade ’a’ onto blade ’b’ and store the result<br />
in ’x’, you can call project like this:<br />
>> x = project(a, b);<br />
<strong>GAViewer</strong> will always search for the best matching function to do the job.<br />
Best matching means:<br />
• The function must have the right name and right number arguments.
32 CHAPTER 4. THE PROGRAMMING LANGUAGE AND THE CONSOLE<br />
• Preferably, all arguments have the right type (e3ga, p3ga, c3ga). This<br />
would be a perfect match.<br />
• If no perfect match can be found, the next best match is searched: all<br />
functions with the right name and right number arguments are collected.<br />
The best matching function is the one for which the ’coercing distance’ is<br />
smallest. This distance is defined as follows: coercing to a higher dimensional<br />
model is preferred over coercing to a lower dimensional model,<br />
since no information is lost. XXX Todo: improve the previous sentence...<br />
4.9 Built-in functions<br />
A description of these functions is also accessible on the <strong>GAViewer</strong> console<br />
through<br />
>> help();<br />
and<br />
>> help(topic);<br />
4.9.1 Products<br />
While many products are accessible through operators, they can also be explicitly<br />
called through the following functions:<br />
function(arguments) return value<br />
gp(a, b)<br />
geometric product of a and b<br />
igp(a, b)<br />
inverse geometric product of a and b<br />
op(a, b) outer product of a and b (a / b)<br />
hip(a, b)<br />
Hestenes inner product of a and b<br />
mhip(a, b)<br />
modified Hestenes inner product of a and b<br />
lcont(a, b)<br />
left contraction of a and b<br />
rcont(a, b)<br />
right contraction of a and b<br />
scp(a, b)<br />
scalar product of a and b<br />
meet(a, b)<br />
meet of a and b<br />
join(a, b)<br />
join of a and b<br />
Since version 0.41, two products are available in a Euclidean Metric flavour<br />
also, which can be useful for low level work (for example, the meet and join<br />
use these products internally):<br />
function(arguments) return value<br />
gpem(a, b)<br />
geometric product (Euclidean Metric) of a and b<br />
lcem(a, b)<br />
left contraction (Euclidean Metric) of a and b
4.9. BUILT-IN FUNCTIONS 33<br />
4.9.2 Basic GA functions<br />
The following table list some basic GA functions:<br />
function(arguments) return value<br />
add(a, b)<br />
the sum of a and b<br />
sub(a, b) the sum of a and -b<br />
scalar(a)<br />
the scalar part of a<br />
dual(a)<br />
the dual of a with respect to the full space<br />
dual(a, b)<br />
the dual of a with respect to b<br />
reverse(a)<br />
the reverse of a<br />
clifford conjugate(a) thecliffordconjugateofa<br />
grade involution(a) the grade involution of a<br />
inverse(a)<br />
the (versor) inverse of a<br />
general inverse(a) the inverse of a even if<br />
a is not a versor (returns 0 if inverse does not exist)<br />
negate(a)<br />
returns the negation of a<br />
To extract a grade part, or to determine the grade of a blade:<br />
• grade(a, b): returnsthegradeb part of a, e.g., grade(a, 2).<br />
• grade(a): ifa is a blade, returns the grade of arg1,returns-1 otherwise.<br />
To determine the parity of a versor :<br />
• versor parity(a): ifa is an even versor returns: 0, odd versor: 1; not a<br />
versor : -1.<br />
To compute the norm of a multivector, orto normalize a multivector, you<br />
can use of the following functions:<br />
function(arguments) return value<br />
norm 2(a)<br />
the sum of the square of all coordinates of a<br />
norm r(a)<br />
the grade 1 part of aã<br />
norm(a)<br />
the square root abs(norm r(a)), multiplied by<br />
the sign of norm r(a)<br />
normalize(a) a / abs(norm r(a))<br />
To wrap it up, there are a few handy functions for doing versor products,<br />
projection, rejection and factorization of a blade:<br />
function(arguments) return value<br />
versor product(a, b) returns a b inverse(a)<br />
vp(a, b) synonym of versor product(a, b)<br />
inverse versor product(a, b) returns inverse(a) b a<br />
ivp(a, b) synonym of inverse versor product(a, b)<br />
project(a, b)<br />
returns the projection of a onto b<br />
reject(a, b)<br />
returns the rejection of a from b<br />
factor(a, b)<br />
returns factor ’b’ ofbladea<br />
(b must be an integer in range [1 gradea])<br />
4.9.3 Boolean<br />
A number of functions for doing boolean arithmetic are available. 0.0 is ’false’.<br />
Any value that is not ’false’ is considered to be ’true’. The function scalar()
34 CHAPTER 4. THE PROGRAMMING LANGUAGE AND THE CONSOLE<br />
returns the grade 0 part of a multivector.<br />
function(arguments) return value<br />
equal(a, b)<br />
true if (a - b)equals0<br />
ne(a, b) true if (a - b) does not equal 0<br />
less(a, b)<br />
true if scalar(a) < scalar(b)<br />
greater(a, b) true if scalar(a) > scalar(b)<br />
le(a, b)<br />
(less or equal) true if scalar(a) ≤ scalar(b)<br />
ge(a, b)<br />
(greater or equal) true if scalar(a) ≥ scalar(b)<br />
and(a, b)<br />
true if a is true and b is true<br />
or(a, b)<br />
true if a is true or b is true<br />
not(a)<br />
true if a is false<br />
Bitwise boolean arithmetic can be done with the functions in the following<br />
table. Arguments are converted to 32 bit unsigned integers before performing<br />
the bitwise operation.<br />
function(arguments) return value<br />
bit not(a)<br />
returns the bitwise not of scalar(a)<br />
bit and(a, b) returns the bitwise and of scalar(a) and scalar(b)<br />
bit or(a, b)<br />
returns the bitwise or of scalar(a) and scalar(b)<br />
bit xor(a, b) returns the bitwise xor of scalar(a) and scalar(b)<br />
bit shift(a, b) returns bitwise shift left of scalar(a) by scalar(b)<br />
The second argument of bit shift() can be negative for right shift. The only<br />
reason to include these bitwise boolean functions was to allow user to write<br />
there own autocolor() 4.13 function, where some tests on bitfields need to be<br />
done. The bitwise boolean functions are not of much use for geometric algebra.<br />
4.9.4 Drawing<br />
Various drawing properties of multivectors can be set with the functions described<br />
below. The functions are always used as in the example:<br />
>> a = cyan(e1)<br />
a = 1.00*e1<br />
>><br />
This draws the vector a in cyan.<br />
Compare this to the following example, which will not work as expected:<br />
>> green(a)<br />
ans = 1.00*e1<br />
One might expect green(a) to turn the multivector a green. Bit what actually<br />
happens is that the value of ’a’ gets assigned to ans, andthenans gets<br />
drawn. Since ans is equal to a, it may or may not be drawn on top of a. Onthe<br />
next statement you enter, the value of ans will be overwritten or removed, and<br />
you’ll see that the actual color of a has not changed.<br />
So the functions that modify drawing properties only set certain flags and<br />
values on the intermediate variables and have no effect unless such intermediate<br />
variables are assigned to something.<br />
Drawing functions can be nested like this:
4.9. BUILT-IN FUNCTIONS 35<br />
>> a = cyan(stipple(e1))<br />
a = 1.00*e1<br />
>><br />
This draws a stippled vector a in cyan.<br />
Color and alpha<br />
The color and opacity (often called ’alpha’ in computer graphics) of variables<br />
can be set using these functions:<br />
function(arguments) effect:<br />
red(a)<br />
a turns red<br />
green(a)<br />
a turns green<br />
blue(a)<br />
a turns blue<br />
white(a)<br />
a turns white<br />
magenta(a)<br />
a turns magenta<br />
yellow(a)<br />
a turns yellow<br />
cyan(a)<br />
a turns cyan<br />
black(a)<br />
a turns black<br />
grey(a)<br />
a turns grey<br />
gray(a)<br />
a turns gray<br />
color(a, R, G, B) the color of a becomes the RGB value [R, G, B]<br />
color(a, R, G, B, A) the color/opacity of a becomes the RGBA value [R, G, B, A]<br />
alpha(a, value) the alpha (opacity) of a becomes alpha<br />
Red, green, blue and alpha values should be in the range [0.0 1.0]. A alpha<br />
of 0.0 is entirely transparent (the object will be invisible), while a value of 1.0<br />
will be entirely opaque. Values outisde the [0.0 1.0] range will be clamped by<br />
OpenGL.<br />
Multivectors can be drawn stippled, wireframed, with or without weight<br />
or orientation, and some multivector interpretations allow for an outline to be<br />
drawn. All of this can be set with these functions:<br />
function(arguments) effect:<br />
stipple(a)<br />
draws a stippled<br />
no stipple(a) draws a not stippled<br />
wireframe(a) draws a in wireframe<br />
no wireframe(a) draws a without wireframe<br />
outline(a)<br />
outlines a<br />
no outline(a) does not outline a<br />
weight(a)<br />
draws the weight of a<br />
no weight(a) does not draw the weight of a<br />
ori(a)<br />
draws the orientation of a<br />
no ori(a)<br />
does not draw the orientation of a<br />
To force hiding/showing a multivector, use the show() and hide() functions,<br />
but rememeber to assign!<br />
>> a = e1 // Draws ’a’<br />
a = 1.00*e1<br />
>> a = hide(a), // Hides ’a’, despite the comma.<br />
a = 1.00*e1<br />
>> a = show(a); // Shows ’a’, despite the semicolon.<br />
a = 1.00*e1
36 CHAPTER 4. THE PROGRAMMING LANGUAGE AND THE CONSOLE<br />
>> hide(a) // Does not hide ’a’.<br />
// Instead, assigns the value of ’a’ to ’ans’,<br />
// and hides ’ans’.<br />
Some multivector interpretations can be drawn in multiple ways. For instance,<br />
if you type:<br />
>> line = ori(ni ˆ no ˆ e1)<br />
you’ll see a popup menu labeled ’draw method’ in the controls on the right<br />
hand side of tha <strong>GAViewer</strong> UI. Use it to select various ways to draw the orientation<br />
of the line. From the console, you can also set the draw method, using<br />
the dm functions:<br />
>> line = dm2(ori(ni ˆ no ˆ e1))<br />
The index (’2’ in the example) can range from ’1’ to ’7’. If it is out of range for<br />
the specific multivector interpretation, the default is used.<br />
You can retrieve the drawing properties of variables using the following<br />
functions:<br />
function(arguments) return value:<br />
get color(a)<br />
a vector with rgb color of a<br />
get alpha(a) a scalar with alpha of a<br />
get stipple(a) a boolean scalar with flag stipple of a<br />
get wireframe(a) a boolean scalar with flag wireframe of a<br />
get outline(a) a boolean scalar with flag outline of a<br />
get weight(a) a boolean scalar with flag weight of a<br />
get ori(a)<br />
a boolean scalar with flag ori of a<br />
get hide(a)<br />
a boolean scalar with flag hide of a<br />
A label can be drawn at the ’position’ of an object using the label() function.<br />
Not every object has a positional aspect to it, in which case the label will be<br />
drawn in the origin. The first argument to label() is the variable that you want<br />
to label. The optional second argument is that text of the label (by default, the<br />
name of the variable is used as the label text). Some examples:<br />
>> a = e1<br />
a = 1.00*e1<br />
>> label(a);<br />
>> label(b = 2 a) // this is short for b = 2a, label(b);<br />
b = 2.00*e1<br />
>> label(c = e2, "this is c")<br />
c = 1.00*e2<br />
The following two functions don’t really affect how a variable is drawn, but<br />
more how a variable is interpreted.<br />
• versor(a): forces a versor interpretation of a.<br />
• blade(a): forces blade interpretation of a.<br />
versor() can be useful when a versor coincidentally becomes single-grade. Consider:<br />
>> a = versor(e1 ˆ e2)<br />
a = 1.00*e1ˆe2
4.9. BUILT-IN FUNCTIONS 37<br />
This draws a rotor, whereas simply<br />
>> a = e1 ˆ e2<br />
a = 1.00*e1ˆe2<br />
draws a bivector.<br />
blade() is useful when floating point noise on some grade parts becomes so<br />
large that <strong>GAViewer</strong> mistakes a blade for a versor. Suppose you have a bivector<br />
a=e1∧ e2 but due to some manipulations, floating point nouse causes the<br />
scalar part to be 0.01 instead of 0:<br />
>> a = e1 ˆ e2 + 0.01<br />
a = 0.01 + 1.00*e1ˆe2<br />
a gets interpreted and drawn as a rotor in this case. Now, to force a to be<br />
interpreted as a blade, use:<br />
>> a = blade(e1 ˆ e2 + 0.01)<br />
a = 0.01 + 1.00*e1ˆe2<br />
4.9.5 Controls<br />
Scalar controls can be created by using the functions described in the list below.<br />
To get an idea of what scalar controls are useful for, enter the following<br />
code on the console:<br />
>> ctrl_range(a = 2.0, 0.5, 10.0);<br />
>> dynamic{v = a e1,}<br />
v = 2.00*e1<br />
Now move the slider that appeared in the lower right window (section 4.10 for<br />
a discussion of dynanic).<br />
• ctrl bool(name = value): creates a boolean control with name name, set<br />
to value.<br />
• ctrl range(name = value, min value, max value): creates a slider control<br />
with name name,settovalue, limited to min value and max value.<br />
• ctrl range(name = value, min value, max value, step): creates a slider<br />
control with name name,settovalue, limited to min value and max value<br />
values, that can only be changed step at a time.<br />
• ctrl select(name = value, option1 = value1, ..., optionN = valueN): creates<br />
a selection menu with name name, settovalue. A maximum op 7<br />
options can be specified, value must be one of the options<br />
• ctrl remove(name): removes any control with name name
38 CHAPTER 4. THE PROGRAMMING LANGUAGE AND THE CONSOLE<br />
4.9.6 Goniometric functions, sqrt, abs, log, exp, pow.<br />
All values for goniometric functions in radians. For all functions except exp<br />
and pow, only the scalar part of the argument is used.<br />
function(arguments) return value:<br />
tan(a)<br />
obvious<br />
sin(a)<br />
obvious<br />
cos(a)<br />
obvious<br />
atan(a)<br />
obvious<br />
asin(a)<br />
obvious<br />
acos(a)<br />
obvious<br />
atan2(a)<br />
obvious<br />
sinh(a)<br />
hyperbolic sine of a<br />
cosh(a)<br />
hyperbolic cosine of a<br />
sinc(a)<br />
sin(a)/a<br />
sqrt(a)<br />
square root of a<br />
abs(a)<br />
absolute value of a<br />
log(a)<br />
natural logarithm of scalar(a)<br />
exp(a) exponentiation of a,<br />
inaccurate and slow series expansion<br />
pow(a, b)<br />
a multiplied b times with itself<br />
(b must be integer ≥ 0)<br />
scalar pow(a, b) a raised to the power of b<br />
4.9.7 Projective model functions<br />
Two functions are available to construct point in the p3ga model.<br />
• p3ga point(c1, c2, c3): returnsthep3ga point constructed from the e3ga<br />
vector [c1 e1 + c2 e2 + c3 e3].<br />
• p3ga point(e3ga a): returns the projective point constructed from the<br />
e3ga vector a.<br />
4.9.8 Conformal model functions<br />
The following functions are of use in the c3ga model:<br />
• c3ga point(c1, c2, c3): returns the conformal point constructed from the<br />
e3ga vector [c1e1+c2e2+c3e3].<br />
• c3ga point(e3ga a): returns the conformal point constructed from the<br />
e3ga vector a.<br />
• c3ga point(p3ga b): returns the conformal point constructed from the<br />
p3ga point a.<br />
• translation versor(a): returns a conformal versor that translates over the<br />
e3ga vector a.<br />
• tv(a): synonym of translation versor(a).
4.9. BUILT-IN FUNCTIONS 39<br />
• translation versor(c1, c2, c3): returns a conformal versor that translates<br />
over vector [c1e1+c2e2+c3e3]<br />
• tv(c1, c2, c3): synonym of translation versor(c1, c2, c3).<br />
4.9.9 System functions<br />
A collection of functions that give access some low level aspects of the viewer.<br />
• assign(a, b): assigns the value of b to a, returnsb. This is what the =<br />
operator evaluates to.<br />
• cprint(”a string”): prints”a string” to the console.<br />
• print(a): prints coordinates of a to the console, returns 0.<br />
• print(a, prec): prints coordinates of a to the console with precision prec<br />
(e.g., prec =”e”),returns0.<br />
• cmd(”a command”) executes ”a command” as if it had been read from a<br />
.geo file.<br />
• prompt() sets the default console prompt.<br />
• prompt(”prompt text”) turns the console prompt into ”prompt text”.<br />
• select(a) selects a as the current variable / object, as if it had been selected<br />
using ctrl-left-click.<br />
• remove(a) removes the variable / object a, asiftheremove this object<br />
had been clicked.<br />
• clc() clears the console and removes all control variables.<br />
• clf() removes all variables / objects.<br />
• reset() resets the entire viewer (console, dynamics, variables, user constants,<br />
etc).<br />
4.9.10 Networking<br />
Since version 0.4, other programs can communicate with <strong>GAViewer</strong>over a TCP<br />
connection. To enable this, use the command:<br />
>> add_net_port(6860);<br />
Server socket setup correctly at port 6860<br />
After this command, <strong>GAViewer</strong>will listen on TCP port 6860 to clients trying to<br />
connect.<br />
You can try the connection out by using telnet. In a Unix terminal, or on a<br />
Windows command prompt use something like<br />
telnet localhost 6860<br />
to connect. <strong>GAViewer</strong>will immediately send the values of all known variables:
40 CHAPTER 4. THE PROGRAMMING LANGUAGE AND THE CONSOLE<br />
"autocolor" = 1.000000000000000e+000;$"camori" = 1.000000000000000e+000;$"camp<br />
" = 1.100000000000000e+001*e3;$<br />
In the telnet application, you can type commands that you would otherwise<br />
type on the <strong>GAViewer</strong>console, but they must be terminated with a dollar sign.<br />
For example:<br />
a = e1 + e2,$<br />
<strong>GAViewer</strong>will reply:<br />
"a" = 1.000000000000000e+000*e1 + 1.000000000000000e+000*e2,$<br />
because the value of variable a changed. Every time a variable changes value,<br />
<strong>GAViewer</strong>will send such a message to all connected clients.<br />
Here are the commands related to networking<br />
• add net port(port): start listening on TCP port.<br />
• remove net port(port): stop listening on TCP port; disconnect all current<br />
clients.<br />
• net status(): prints out a summary of the network status.<br />
• net close(): shuts down all network connections and ports.<br />
You can start up <strong>GAViewer</strong>as follows:<br />
gaviewer -net<br />
This enables TCP port 6860 immediately. Networking is disabled by default,<br />
because anyone on the internet can connect to your <strong>GAViewer</strong>this way (unless<br />
you block this using a firewall) and I can’t guarantee that <strong>GAViewer</strong>can’t be<br />
exploited (through buffer overflows, for example) to give someone illegal access<br />
to your computer. However, it is unlikely that someone will go through<br />
the effort of finding such an exploit as long as <strong>GAViewer</strong>is a niche application.<br />
4.10 Dynamic statements<br />
Dynamic statements are created using the dynamic language construct as shown<br />
in the following example:<br />
>> a = e1,<br />
a = 1.00*e1<br />
>> dynamic{b = a ˆ e2,}<br />
b = 1.00*e1ˆe2<br />
Dynamic statements depend on the variables used to evaluate them. In the example,<br />
the statement b=a∧ e2, depends on the variable a, andb. Everytime<br />
one of these variables changes, the dynamic statement is re-evaluated. Because<br />
constants like e2 never change, they don’t effect when a dynamic statement is<br />
re-evaluated.<br />
If, after entering the example above on the console, you would alter the<br />
value of a, e.g.:
4.10. DYNAMIC STATEMENTS 41<br />
>> a = e1,<br />
a = 2.00*e1<br />
you would see that b gets updated automatically. You can also ctrl-right-drag<br />
a and b will change as well.<br />
If you would set the value of b by hand, e.g.:<br />
>> b = 0,<br />
b = 0<br />
you will notice that b does not change. <strong>GAViewer</strong> detects that b has been<br />
altered and reevaluates all dynamic statement involving b.<br />
You can view, edit and remove active dynamic statements by selecting the<br />
menu item Dynamic→View dynamic statements.<br />
If you enter multiple dynamic statements that assign values to the same<br />
variables, things can get tricky and confusing. Consider:<br />
>> a = e1,<br />
a = 1.00 * e1<br />
>> dynamic{b = a ˆ e2,}<br />
b = 1.00*e1ˆe2<br />
>> dynamic{b = c ˆ e2,}<br />
b = 0<br />
Directly after the second dynamic statement has been entered, b will be set<br />
to 0. But immediately after that, <strong>GAViewer</strong> will notice that the first dynamic<br />
statement (b =a∧ e2,) should be reevaluated, because the value of b has been<br />
altered. Thus <strong>GAViewer</strong> will execute b=a∧ e2,. If no infinite loop protection<br />
was in place, <strong>GAViewer</strong> would now re-evaluate the second dynamic statement<br />
again, followed by the first, etc.<br />
However, <strong>GAViewer</strong> protects against infinite loops in dynamic statement<br />
evaluation. A dynamic statement will never get reevaluated twice due to some<br />
kind of loop-dependency in the dynamic statements. In general it is better to<br />
avoid such loops because they can be quite confusing.<br />
Some short remarks:<br />
• dynamic can only be called in the global scope, not inside functions or<br />
batches called by functions.<br />
• Setting the inner product using inner product() (section 4.3) will not cause<br />
dynamic statements using the . operator to be re-evaluated.<br />
• The function cld() removes all dynamic statements<br />
• Terminating statements with colon or semincolon only effects the visibility<br />
of variables on the first time the dynamic statement is evaluated.<br />
hide() and show() do affect visibility on every re-evaluations.<br />
4.10.1 Named Dynamic Statements<br />
The problem with dynamics is that you have little control over them once they<br />
have been created. You can remove them all using cld(), youcaneditthemin<br />
Dynamic→View dynamic statements,butthat’sit.Named dynamics offer more
42 CHAPTER 4. THE PROGRAMMING LANGUAGE AND THE CONSOLE<br />
flexibility. By adding a name tag to every dynamic, you can overwrite it later,<br />
selectively remove it, etc.<br />
An example of the syntax for creating and overwriting a named dynamic<br />
is:<br />
>> a = e1,<br />
a = 1.00 * e1<br />
>> dynamic{my_dynamic: b = a ˆ e2,}<br />
b = 1.00*e1ˆe2<br />
>> dynamic{my_dynamic: b = a ˆ e3,}<br />
b = 1.00*e1ˆe3<br />
A named dynamic can be removed using the todo todo todo todo todo todo<br />
todo todo function.<br />
4.10.2 Animations<br />
One way to achieve animation in <strong>GAViewer</strong> is by writing dynamic statements<br />
that depend on the atime variable.<br />
For example, enter the following dynamic statement on the console:<br />
>> dynamic{print(atime);}<br />
atime = 0<br />
Now select Dynamic→Start/Resume Animation:<br />
>> atime = 0<br />
>> atime = 0.01<br />
>> atime = 0.07<br />
>> atime = 0.13<br />
>> atime = 0.19<br />
As you can see, atime will be set to the time elapsed since the ’animation’ was<br />
started. atime will be set at most 30 times per second, but it may be slower,<br />
depending on the time required to redraw the view window and to re-evaluate<br />
dynamics.<br />
To stop the animation, select Dynamic→Stop Animation. To pause, select<br />
Dynamic→Stop Animation.<br />
By writing more complicated dynamic statements involving atime, more<br />
interesting animations can be produced.<br />
You can also start and stop animations from the console.<br />
• start animation() starts the animation of dynamics depending on atime.<br />
It is guaranteed that when an animation starts, atime will be 0. Youcan<br />
check atime == 0 and do some kind of initialization if you need to.<br />
• stop animation(): stops animation.<br />
• pause animation(): pausesanimation.<br />
• resume animation(): resumes animation (synonym of start animation()).<br />
For example:
4.11. CONTROL CONSTRUCTS 43<br />
>> cld(); // remove all current dynamics<br />
>> dynamic{a = sin(atime) e1, if (atime > 10) stop_animation();}<br />
a = -0.86*e1<br />
>> start_animation();<br />
This animation will run for about 10 seconds because it stops itself when atime<br />
is larger than 10.<br />
4.11 Control constructs<br />
Several control constucts are available in the language. They are all modelled<br />
after the C programming language.<br />
4.11.1 if else<br />
An if else looks like this<br />
if (condition) statement<br />
[else statement]<br />
As indicated by the square brackets, the else part is optional.<br />
For example:<br />
>> if (a == 1) {b = 1;} else {b = 2;}<br />
For simple if else statements you can leave out the curly brackets. So the example<br />
from above can be rewritten without change in semantics to the following:<br />
>> if (a == 1) b = 1; else b = 2;<br />
4.11.2 for<br />
A for statement allows one to write a loop. It looks like:<br />
for ([init] ; [cond] ; [update]) statement<br />
It works as follows: to begin with, the init statement is executed. Then before<br />
every execution of the statement, it is checked whether cond is true. If so,<br />
statement is executed, otherwise the loop terminates. After the statement has<br />
been executed, update is executed.<br />
Thesquarebracketsaroundinit, cond and update indicate that they are all<br />
optional. If cond is not specified, it is assumed to be true.<br />
An example of a for loop is:<br />
>> for (i = 0; i < 5; i = i + 1) {print(i);}<br />
i = 0<br />
i = 1.00<br />
i = 2.00<br />
i = 3.00<br />
i = 4.00
44 CHAPTER 4. THE PROGRAMMING LANGUAGE AND THE CONSOLE<br />
A for loop can be terminated prematurely by issuing a break statement. A<br />
for loop can be forced to terminate the execution of the current loop body by<br />
using a continue statement.<br />
The following for loop would loop forever, if it wasn’t for the break statement.<br />
The print() of i for i==1is skipped, as you can see in the output.<br />
>> for (;;) {<br />
if (i == 1) continue;<br />
print(i);<br />
if (i == 3) break;<br />
}<br />
i = 0<br />
i = 2.00<br />
i = 3.00<br />
4.11.3 while<br />
The while language construct also allows you to perform loops, but in a slightly<br />
different format. A while loop looks like<br />
while (cond) statement<br />
It loops as long as cond is true, executing the statement on every loop.<br />
An example of a while loop is:<br />
>> while (i < 5) {print(i); i = i + 1}<br />
It is very easy to write infinite for or while loops, for example, by forgetting<br />
to increment i. In such a case, <strong>GAViewer</strong> will hang forever. Try for example:<br />
>> while (1) {}<br />
As with the for loop, continue and break can be used to control the loop.<br />
4.11.4 switch<br />
A switch statement allows you to compare the value of an expression against<br />
the value of a bunch of other expressions, and to undertake some action depending<br />
on the outcome of that. It looks like this:<br />
switch(expression) {<br />
case expr1:<br />
[statements]<br />
case exprn:<br />
[statements]<br />
default:<br />
[statements]<br />
}<br />
All the statements are optional. They may include break statements to leave<br />
the switch.<br />
A more or less typical switch would look like:
4.12. WRITING FUNCTIONS AND BATCHES 45<br />
switch(i) {<br />
case 1:<br />
cprint("i is 1");<br />
break;<br />
case 2:<br />
case 3:<br />
cprint("i is 2 or i is 3");<br />
break;<br />
case j + 2:<br />
cprint("i is (j + 2)");<br />
break;<br />
default:<br />
cprint("the default action was called");<br />
}<br />
Note that, as opposed to C, arbitrary expressions (such as j+2) are allowed for<br />
cases.<br />
4.12 Writing functions and batches<br />
You can write your own functions and batches and load them into <strong>GAViewer</strong>.<br />
A batch is a function, except it executes in the same scope as the caller. In<br />
what follows we will refer to both functions and batches as just ’functions’,<br />
and explain the special stuff for batches later.<br />
You can store functions in .g files, or type them at the console. For example,<br />
a small function that returns the largest of two values can be entered directly<br />
on the console:<br />
>> function max(a, b) {if (norm(a) > norm(b)) {return a;}<br />
else {return b;}};<br />
Added function max( a, b)<br />
You can then use max() like this:<br />
>> max(1, 3)<br />
ans = 3.00<br />
A function definition looks like this:<br />
function func_name([e3ga|p3ga|c3ga] arg1_name, ...<br />
[e3ga|p3ga|c3ga] argn_name) {<br />
// function statements<br />
}<br />
The first word of a function definition is always function or batch. Thisisfollowed<br />
by the name of the function (func name in the example above. Between<br />
a round open and a round close parentheses, the arguments to the function are<br />
specified. A function can have 0 to 8 arguments. The value 8 is hard coded.<br />
More than 8 arguments currently crashes the <strong>GAViewer</strong>. An arbitrary number<br />
of arguments should be allowed for in the future.
46 CHAPTER 4. THE PROGRAMMING LANGUAGE AND THE CONSOLE<br />
The type specifier (e3ga, p3ga, c3ga) is optional. If no type is specified,<br />
actual arguments always match perfectly. A return type specifier can not be<br />
given. A multivector is always returned, without any restrictions on the model/type.<br />
Inside a function, you can type arbitrary statements. A return expr statement<br />
cause the function to terminate and return the value of expr.<br />
It is also allowed to define new functions inside functions. For example:<br />
function f(a) {<br />
function neg(b) {<br />
return -b;<br />
}<br />
return 2 * neg(a);<br />
}<br />
You can declare the existence of a certain function without defining it like<br />
this:<br />
function f(a);<br />
So a function declaration is like a function definition, except you leave out the<br />
function body and replace it with a semicolon.<br />
All variables inside a function are local by default. This means that you can<br />
not see variables from the global scope, nor can you set variables in the global<br />
scope. The :: operator can be used reach variables in the global scope from<br />
inside a function:<br />
function setGlobalVar(a) {<br />
::globalVar = a;<br />
}<br />
4.12.1 Batches<br />
Batches are functions that execute in the same scope as the caller. This means<br />
that you’ll have to be really careful when calling batches and make sure that<br />
variable names used in the batch are not used for some other purpose in the<br />
calling scope. For instance, if formal argument names of a batch are already<br />
present in the scope of the caller, they will be overwritten.<br />
Batches are most useful for writing interactive demos and tutorials. Often<br />
you want to execute a bunch of statements that are too tedious for the user<br />
of your tutorial to type by hand. Then you can collect these statements into<br />
a batch, store them in a .g file and have the user load that. There is a special<br />
suspend statement to allow for interaction inside batches. Consider:<br />
batch demo1() {<br />
a = show(e1);<br />
cprint("’a’ is now equal to e1.");<br />
cprint("Drag the left mouse button to rotate your view.");<br />
cprint("Type arbitrary commands on the console.");<br />
cprint("Press enter to continue.");<br />
// set a special prompt<br />
prompt("demo1 suspended... >> ");
4.13. AUTOCOLOR. 47<br />
// suspend the current batch<br />
suspend;<br />
// set the prompt back to normal<br />
prompt();<br />
cprint("Welcome back to demo1");<br />
a = show(e2);<br />
cprint("’a’ is now equal to e2");<br />
cprint("This is the end of demo1");<br />
}<br />
Using suspend is not allowed outside the global scope.<br />
4.13 Autocolor.<br />
You may have noticed that not all variables are drawn in the same color. Grade<br />
1 variables are red, grade 2 variables are blue, etc. This color is set by a built-in<br />
function called autocolorfunc().<br />
Every time variable in the global scope that is assigned a value, it is send is<br />
through autocolorfunc() to give it a distinctive look before. The default builtin<br />
autocolorfunc() changes the color of the variable depending on it grade (but<br />
only if the color has not been set explicitly by one of the drawings function<br />
(section 4.9.4)). It also turns on stippling for imaginary conformal model objects<br />
(such as the circles of intersection of two spheres that do not intersect).<br />
You can turn the auto-color feature of by setting the global variable autocolor<br />
to false. Ifautocolor is false, all variables get the same default foreground<br />
color.<br />
4.13.1 Writing your own autocolor() function.<br />
You can also write your own autocolorfunc() if you are not satified with the<br />
default. Writing your own autocolorfunc() is pretty low level, so be prepared.<br />
Check out the autocolor.g that is included in the <strong>GAViewer</strong> documentation package<br />
to see what the default autocolorfunc() looks like. Also remember that the<br />
default built-in autocolorfunc() executes faster than ordinary .g files because it<br />
was written in C++ instead and compiled to machine code, while .g files are<br />
interpreted.<br />
Two important things you’ll want to know is:<br />
• How do I get information about how an object is interpreted? You can<br />
find out by calling get interpretation(a). This returns a bitfield that contains<br />
information about the interpretation of a. You can use the bitwise<br />
boolean functions to extract information from the bitfield (see autocolor.g<br />
for an example).<br />
• How do I know whether some drawing property of a variable was already<br />
set explicitly by the user. Of course, you don’t want to override
48 CHAPTER 4. THE PROGRAMMING LANGUAGE AND THE CONSOLE<br />
what the user has explicitly set. So call get draw flags(a). This will return<br />
a bitfield that contains information about which drawing properties<br />
were set by the user.
Chapter 5<br />
Typesetting labels.<br />
<strong>GAViewer</strong> features a simple typesetting language which resembles Latex. It<br />
was implemented by the author as an introduction to parsing and interpreting<br />
languages, and of course because of its functionality. Here is a list of some of<br />
the features the the typesetting system provides:<br />
• text and equation modes,<br />
• sub- and superscripts,<br />
• four scalable fonts (regular, italic, bold, greek),<br />
• some special ’GA’-symbols,<br />
• tabulars,<br />
• left, right, center, and justifyable alignment,<br />
• hats,<br />
• scalable parenthesis,<br />
• (square) roots,<br />
• fractions,<br />
• custom commands (macros), and<br />
• (custom) colors.<br />
The implementation of the typesetting system was kept simple, which makes<br />
it unsuitable for typesetting large amounts of text. The input is parsed, checked<br />
for syntax errors, and converted to a parse tree. After the parse pass have<br />
been completed, the parse tree is interpreted an turned into drawing commands.<br />
Then the parse tree can be released, and the drawing commands sent<br />
to OpenGL (or some other graphics API). Because parsing, interpreting and<br />
drawing do not occur in one pass, large amounts of memory will be required<br />
in large amounts of text are supplied as input. As a side note, lex and yacc (cite<br />
XXX todo) are used for parsing the input.<br />
The font for the typesetting is a 1024 × 1024 pixel ’GL ALPHA’ texture. It<br />
is included directly in the source code, in fontdata.cpp. The font is antialiased<br />
49
50 CHAPTER 5. TYPESETTING LABELS.<br />
Figure 5.1: An example of the use of text and equation modes.<br />
and contains all ASCII symbols of four font: regular, italic, bold, greek. It also<br />
contains several special GA-only symbols.<br />
Figure 5.1 shows an example of a complex typeset label. This figure is representative<br />
for the complexity the typesetting system was designed. The system<br />
can handle multiple lines and such, but don’t use it to typeset entire pages like<br />
you can do with Latex.<br />
5.1 txt and eqn modes.<br />
There are two parse modes with subtle differences. txt mode, the default, is<br />
used to typeset ordinary text, like this sentence. eqn mode is intended for<br />
typesetting equations. Whitespaces, numbers and operators are treated differently<br />
in both modes, and some commands, such as sqrt and frac are only valid<br />
in eqn mode. Here is an example of switching between modes:<br />
\txt{This is ordinary sentence}<br />
\eqn{a = b + c - d}<br />
The former line switches to text mode. This causes all text between the curly<br />
parentheses to be parsed as ordinary text. The latter line uses equation mode.<br />
The following, more complex line combines the uses of txt and eqn modes:<br />
\txt{A sphere: \eqn{\bold{s} = \par{()}<br />
{\bold{q} + \frac{1}{2}\rhoˆ{2}\bold{e}_{\infty}}ˆ{*}}<br />
As you can see, the eqn part is inside embedded in the txt part. Because the<br />
default parsing mode is txt, the following is equivalent to the previous line<br />
(unless you have changed the default parsing mode as described in section<br />
XXX todo):<br />
\txt{A sphere: \eqn{\bold{s} = \par{()}<br />
{\bold{q} + \frac{1}{2}\greek{r}ˆ{2}\bold{e}_{\infty}}ˆ{*}}<br />
Both these sample lines result in the output shown figure 5.1.<br />
5.1.1 txt mode details:<br />
In txt mode, multiple instances of spaces, newline and tabs are interpreted as<br />
a single instance of whitespace. Whitespace at the end of a line is ignored and<br />
deleted. To force the insertion whitespace, use the ws command (section 5.4).
5.2. FONTS 51<br />
Figure 5.2: An example of a number in eqn mode.<br />
Sequences of letters, numbers, underscores, plus and minus signs are interpreted<br />
as words. Other ASCII characters are interpreted as single-character<br />
words. A backslash followed by letters is interpreted as a command. A backslash<br />
followed by numbers is interpreted as a custom command argument (section<br />
5.13). Two backslashes next to each other is short for the newline command.<br />
A backslash followed by any other character is interpreted as an escape<br />
sequence for that character. To produce an actual backslash in the output, use<br />
the backslash command.<br />
The frac, sqrt, har and par commands are not valid in txt mode.<br />
5.1.2 eqn mode details:<br />
In eqn mode, all whitespace is ignored (unless it was forced using the ws command).<br />
Characters and symbols that are recognized as operators are automatically<br />
surrounded by a small amount of whitespace.<br />
A sequence of letters is interpreted as a word. These are printed in italics<br />
by default. A sequence of numbers, possibly followed by an exponent are interpret<br />
as numbers. The following line results in the output shown in figure<br />
5.2.<br />
\eqn{123e-456}<br />
The frac, sqrt, har and par commands can be used to typeset (square) roots,<br />
fractions, to put hats on top of expressions and, and to surround an expression<br />
in parentheses.<br />
Figure 5.3: The four fonts.
52 CHAPTER 5. TYPESETTING LABELS.<br />
Greek symbol command ASCII mapping<br />
α alpha a<br />
β beta b<br />
γ gamma g<br />
δ delta d<br />
ɛ epsilon e<br />
ζ zeta z<br />
η eta h<br />
θ theta q<br />
ι iota i<br />
κ kappa k<br />
λ lambda l<br />
µ mu m<br />
ν nu n<br />
ξ xi x<br />
o omikron o<br />
π pi p<br />
ρ rho r<br />
σ sigma s<br />
τ tau t<br />
υ upsilon u<br />
φ phi f<br />
χ chi c<br />
ψ psi y<br />
ω omega w<br />
Figure 5.4: Mapping of the Greek to the ASCII alfabet.<br />
5.2 Fonts<br />
Four fonts are available, as illustrated in figure 5.3. The input used to generate<br />
the figure speaks for itself:<br />
\regular{Regular font.}\newline<br />
\bold{Bold font.}\newline<br />
\italic{Italic font.}\newline<br />
\greek{Greek font.}<br />
If you find regular, bold, italic, greek, too long to type, you may consider<br />
using the equivalent abbreviations fr, fb, fi, fg, which stand for ’font’ followed<br />
by the first letter of the name of the font.<br />
Of couse, fonts can be embedded in each other as with the txt and eqn<br />
modes. So the following lines also result in the output shown in figure 5.3:<br />
\regular{Regular font.\newline<br />
\bold{Bold font.\newline<br />
\italic{Italic font.\newline<br />
\greek{Greek font.}}}}<br />
The default font in math mode is italic for letters (variables) and regular for<br />
all other symbols.
5.3. SCALING OF FONTS 53<br />
Figure 5.5: Scaling the font using the scale command.<br />
The greek alphabet is mapped to the ASCII alfabet as shown in figure 5.4.<br />
Their are two ways to produce greek characters. The first way is to switch to<br />
the greek font, the second is to use the command supplied for each character,<br />
e.g., alpha to produce the symbol ’α’:<br />
\greek{a}<br />
\alpha<br />
The greek symbol commands work in both txt and eqn modes.<br />
5.3 Scaling of fonts<br />
The typesetting system always start typesetting with a default font size. The<br />
size of the font can change implicitly through the use of certain commands and<br />
constructions. For example, the size of the font of a sub- or superscript is 0.6×<br />
thesizeoftheparenttext.<br />
You can explicitly scale the size of the font by using the scale command, as<br />
shown in the next example (output is in figure 5.5:<br />
\scale{0.5}{Small,} \scale{1.0}{normal, and}<br />
\scale{2.0}{big} text<br />
5.4 Forced whitespace, forced newlines<br />
To force whitespace between words or at the end of a line, use the ws command.<br />
Suppose the typesetting system typesets something badly, e.g.:<br />
\italic{ape}:nut<br />
(see output in figure 5.6a), then you could use whitespace commands to force<br />
some space at both sides of the colon:<br />
Figure 5.6: Forcing whitespace at both sides of the semicolon using the ws<br />
command.
54 CHAPTER 5. TYPESETTING LABELS.<br />
Figure 5.7: The four alignment modes.<br />
\italic{ape}\ws{0.05}:\ws{0.1}nut<br />
(see output in figure 5.6b)<br />
If you don’t supply an argument to the ws command, a default of 0.25 is<br />
used.<br />
Newline are automatically inserted when text is too wide to fit on the current<br />
line. To force a newline to be inserted, you can use the newline command,<br />
as was already shown in the four fonts example above (section 5.2). Two backslashes<br />
is a short synonym for a newline.<br />
5.5 Alignment<br />
Four alignment modes are offered to place text on a line as required, and to fill<br />
out the line if required.<br />
The first mode is left. This places all text as far to the left as possible. right<br />
modes places all text as far to the right as possible. center modes places all text<br />
in the center of the line. justify mode spaces all text such that it nicely fits the<br />
maximum width of the line. The ouput in figure 5.7 was generated from the<br />
following input:<br />
\left{Left mode}\newline<br />
\right{Right mode}<br />
\newline\center{Center mode}<br />
\newline\justify{Justify mode}<br />
5.6 Sub- and superscript<br />
In eqn mode, sub- and superscripts can be added to the previous ’word’ in the<br />
sentence. The syntax of the sub- and superscript constructors is pretty straightforward,<br />
and should become clear from the following input and its output (figure<br />
5.8):<br />
\eqn{xˆ{y} + M_{12} - e_{1}ˆ{2}}
5.7. PARENTHESES 55<br />
If you try to append multiple subscripts or multiple superscripts to a single<br />
word, the system will complain and ignore everthing but the first sub- or<br />
superscript.<br />
5.7 Parentheses<br />
Three types of parentheses can be placed around pieces of text in eqn mode:<br />
square parentheses [], round parentheses () and curly parentheses {}. The<br />
brackets automatically scale with the size of the input. Here are some examples<br />
of their use, the output is in figure 5.9:<br />
\center{<br />
\eqn{\par{()}{\txt{Round parentheses}}}\newline<br />
\eqn{\par{[]}{\txt{Square parentheses}}}\newline<br />
\eqn{\par{\{\}}{\txt{Curly parentheses}}}\newline<br />
\eqn{\par{\{\}}{\frac{\txt{Curly parentheses with some}}<br />
{\scale{2.0}{\txt{big text}}}}}}<br />
As you can see, the first argument to the par command is the parentheses<br />
you would like. These can be any mix of types, e.g.: [], (] or even something<br />
weird like }{. The second arguments specifies the contents of the parentheses.<br />
Note that you always have to be in eqn mode (for no apparent reason...),<br />
but you can cheat you way around this by including txt commands inside the<br />
parentheses command.<br />
5.8 Tabulars<br />
Tabulars can be used for all kinds of purposes where you want to arrange text<br />
in row and columns. Examples of their use are tables and matrices. We will<br />
give an example of both.<br />
The tabular command first argument specify the number of columns, the<br />
alignment of content inside the columns, and optional vertical lines between<br />
them. All following arguments specify rows. Inside a row, each column is<br />
seperated by an ampersand: ’&’. The alignment of a column can be Here is an<br />
example of a table with 4 columns and 4 rows (output in figure 5.10):<br />
\tabular{|r||c|c|c|}<br />
{\hline}<br />
{ &\bold{1998}&\bold{1999}&\bold{2000}}<br />
{\hline}<br />
{\hline}<br />
{\bold{x}&1.0&1.2&1.4}<br />
Figure 5.8: Script example.
56 CHAPTER 5. TYPESETTING LABELS.<br />
Figure 5.9: The three types of parentheses, and an example of how parentheses<br />
scale with their contents.<br />
{\bold{y}&+&-&++}<br />
{\bold{z}&bad&worse&horrible}<br />
{\hline}<br />
The width of a column is determined by the width of the widest item in the<br />
column. The alignment can be ’l’, ’r’, ’c’ or ’j’ (left, right, center, or justify), and<br />
behaves as described in section 5.5. A vertical bar ’—’ in the first argument<br />
produces a vertical line. A row containing only an hline command produces<br />
a horizontal line. Empty or unspecified entries in row are filled with blanks;<br />
surplus columns in row are ignored with a warning issued.<br />
Now for an example of a matrix:<br />
\eqn{\bold{M} =<br />
\par{[]}{<br />
Figure 5.10: Tabular example 1.
5.9. (SQUARE) ROOTS 57<br />
Figure 5.11: Tabular example 2.<br />
\tabular{cccc}<br />
{\fr{R_{11}}\ws{0.2}&\fr{R_{12}}\ws{0.2}&\fr{R_{13}}\ws{0.2}&0}<br />
{\fr{R_{21}}&\fr{R_{22}}&\fr{R_{23}}&0}<br />
{\fr{R_{31}}&\fr{R_{32}}&\fr{R_{33}}&0}<br />
{\fr{t_{1}}&\fr{t_{2}}&\fr{t_{3}}&1}<br />
}}<br />
This produces figure 5.11. Note the use of the ws command to force some extra<br />
whitespace between columns.<br />
5.9 (Square) roots<br />
The construct a (square) root, use the sqrt command. It takes at least one argument<br />
(the contents of the root), and optionally a second argument, which is the<br />
’power’ of the root. For example:<br />
\eqn{\sqrt{x + y}\ws{1.0}<br />
\sqrt{\pi}{3}\ws{1.0}<br />
\sqrt{\fb{Z}}{\scale{0.5}{\frac{1}{2}}}}<br />
This produces the output shown in figure 5.12. As you can see in the last line,<br />
sometimes you have to <strong>manual</strong>ly scale the font size of the ’power’ if you put<br />
something weird or large in there.<br />
Figure 5.12: Square root example.
58 CHAPTER 5. TYPESETTING LABELS.<br />
Figure 5.13: Fraction example.<br />
5.10 Fractions<br />
To construct complicated fractions where the numerator and the denominator<br />
are separated by a horizontal line, use the frac command. It takes two arguments<br />
(the contents of the numerator and the denominator). The size of the<br />
font is implicitly scaled by 0.9 in a fraction, but this can be corrected by using<br />
the scale command (section 5.3). The output in figure 5.13 was generated from<br />
the following input:<br />
\eqn{\frac{1}{x+y}\ws{2.0}<br />
\frac{aˆ{2} - bˆ{2}}{a + b} = a - b}<br />
5.11 Hats<br />
You can add hats, bars and tildes on top of text by using the hat, widehat, bar,<br />
widebar, tilde or widetilde commands. The wide variants scale with the size<br />
of the content, as is illustrated by the following examples, and its output in<br />
figure 5.14.<br />
\eqn{<br />
\hat{A}\ws{1.0}\tilde{\frac{x}{y}}\ws{1.0}<br />
\widehat{A + B + C}\ws{1.0}\widebar{A + B + C}}<br />
All types of hats look rather bad when (OpenGL) antialiasing is turned off.<br />
5.12 Colors<br />
Text can be typeset in arbitrary colors. A fixed number of colors is known to the<br />
system, and custom colors can be defined using a special command described<br />
Figure 5.14: Hats example.
5.13. CUSTOM COMMANDS 59<br />
Figure 5.15: Color example.<br />
below. The default colors are: red, green, blue, magenta, yellow, cyan, black,<br />
white, grey and gray (these last two are synonyms).<br />
The draw text in one of these colors (the default is black by the way), do<br />
something like the following (output in figure 5.15):<br />
Black text, \red{red text}, \blue{blue text}<br />
\newline and a green \green{frog}.<br />
5.12.1 Custom colors<br />
Custom colors can be added using the newcolor command. The command<br />
takes one argument, which is a sentence that contains the name of the color,<br />
the red value (range: [0.0, 1.0]), the green value and the blue value, seperated<br />
by whitespace:<br />
\newcolor{brightpink 1.0 0.0 0.6}<br />
Once a new color is defined like this, it can be used as any other color:<br />
\brightpink{Some bright pink text.}<br />
If a color is already defined, issuing a newcolor command for it will override<br />
its current rgb value. Redefining an existing command as a color is possible<br />
but not recommended.<br />
5.13 Custom commands<br />
When you want to do the same thing a lot of times, it might be useful to create a<br />
custom command or ’macro’. A custom command defines a fixed input string,<br />
a<br />
b<br />
Figure 5.16: Custom command example.
60 CHAPTER 5. TYPESETTING LABELS.<br />
with variable arguments. An example might be when you always want to<br />
typeset your geometric algebra multivectors in bold font. You can define a<br />
new command mv (short for multivector), and use that everytime you want<br />
to typeset something as a multivector. Custom commands can save you a lot<br />
of typing work, make your input more readible, and if you later change your<br />
mind and decide that all you multivectors should be typeset in italics, it is<br />
easier and less error-prone to change a single custom command definition, than<br />
to replace every occurance of the bold command.<br />
Here is an example of defining and using a custom command:<br />
\newcommand{\mv}{\bold{\1}}<br />
\eqn{\mv{C} = \mv{a} \op \mv{b}}<br />
The output is in figure 5.16a. The first argument to the newcommand commandisthenameofthethenewcommand(mv<br />
in this case). The second<br />
argument is what the command should be expanded to. Inside the second<br />
argument, a backslash followed by an positive number i will be replaced i th<br />
argument of the new command. The mv command takes only one argument,<br />
but next we give an example of multiple arguments (output in figure 5.16b).<br />
\newcommand{\wc}{\eqn{\sqrt{\frac{\1}{\2}}{\3}}}<br />
\wc{1}{2}{3}<br />
Note that the eqn command is included inside the custom command, to<br />
force equation mode every time the command is used (otherwise the frac command<br />
may not work). This is like ensuremath in Latex.<br />
Commands with no arguments are also possible by simply not using any<br />
’backslash positive numbers’ inside the custom command string.<br />
If a command is already defined, issuing a newcommand command for it<br />
will override its current value. Redefining an existing predefined command<br />
(such as txt or par is possible but not recommended.<br />
5.14 Special symbols<br />
Several special symbols for geometric algebra use are available, and more can<br />
be added quite easily as required. Currently the following symbols are available<br />
through commands:<br />
Command Symbol<br />
gp<br />
half space<br />
op<br />
∧<br />
ip ·<br />
lc<br />
⌋<br />
rc<br />
⌊<br />
cp ×<br />
infty or inf ∞<br />
Accessing the greek special characters directly was already discussed in<br />
section 5.2. Most ASCII characters that are not numbers or letters can also be<br />
accessed by typing a backslash followed by the character. For some characters,<br />
this is the only way of producing them, since they are reserved (e.g., the<br />
backslash).
Bibliography<br />
[0] To do: fix some of these references.<br />
[1] D. Fontijne, T. Bouma, L. Dorst Gaigen: A Geometric Algebra Implementation<br />
Generator. Available at http://carol.science.uva.nl/∼fontijne/gaigen<br />
61