(SAV) User Guide 15020619 D - Illumina
(SAV) User Guide 15020619 D - Illumina
(SAV) User Guide 15020619 D - Illumina

Create successful ePaper yourself
Turn your PDF publications into a flip-book with our unique Google optimized e-Paper software.
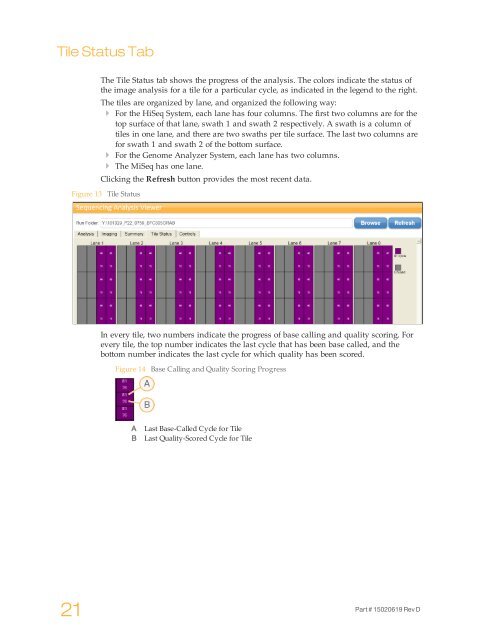
Tile Status Tab<br />
The Tile Status tab shows the progress of the analysis. The colors indicate the status of<br />
the image analysis for a tile for a particular cycle, as indicated in the legend to the right.<br />
The tiles are organized by lane, and organized the following way:<br />
} For the HiSeq System, each lane has four columns. The first two columns are for the<br />
top surface of that lane, swath 1 and swath 2 respectively. A swath is a column of<br />
tiles in one lane, and there are two swaths per tile surface. The last two columns are<br />
for swath 1 and swath 2 of the bottom surface.<br />
} For the Genome Analyzer System, each lane has two columns.<br />
} The MiSeq has one lane.<br />
Clicking the Refresh button provides the most recent data.<br />
Figure 13<br />
Tile Status<br />
In every tile, two numbers indicate the progress of base calling and quality scoring. For<br />
every tile, the top number indicates the last cycle that has been base called, and the<br />
bottom number indicates the last cycle for which quality has been scored.<br />
Figure 14 Base Calling and Quality Scoring Progress<br />
A<br />
B<br />
Last Base-Called Cycle for Tile<br />
Last Quality-Scored Cycle for Tile<br />
21<br />
Part # <strong>15020619</strong> Rev D