(SAV) User Guide 15020619 D - Illumina
(SAV) User Guide 15020619 D - Illumina
(SAV) User Guide 15020619 D - Illumina

Create successful ePaper yourself
Turn your PDF publications into a flip-book with our unique Google optimized e-Paper software.
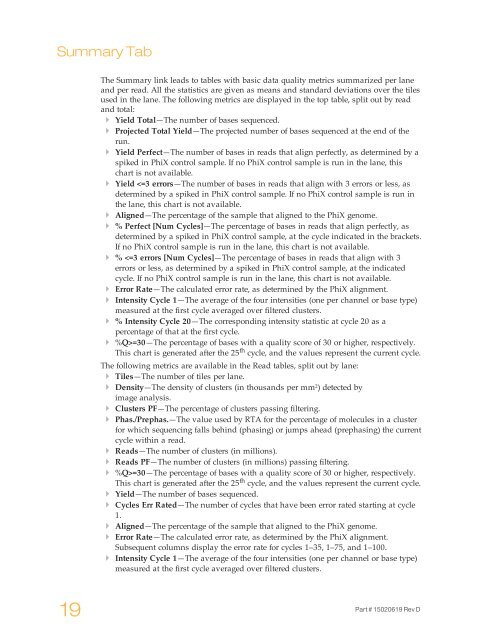
Summary Tab<br />
The Summary link leads to tables with basic data quality metrics summarized per lane<br />
and per read. All the statistics are given as means and standard deviations over the tiles<br />
used in the lane. The following metrics are displayed in the top table, split out by read<br />
and total:<br />
} Yield Total—The number of bases sequenced.<br />
} Projected Total Yield—The projected number of bases sequenced at the end of the<br />
run.<br />
} Yield Perfect—The number of bases in reads that align perfectly, as determined by a<br />
spiked in PhiX control sample. If no PhiX control sample is run in the lane, this<br />
chart is not available.<br />
} Yield =30—The percentage of bases with a quality score of 30 or higher, respectively.<br />
This chart is generated after the 25 th cycle, and the values represent the current cycle.<br />
} Yield—The number of bases sequenced.<br />
} Cycles Err Rated—The number of cycles that have been error rated starting at cycle<br />
1.<br />
} Aligned—The percentage of the sample that aligned to the PhiX genome.<br />
} Error Rate—The calculated error rate, as determined by the PhiX alignment.<br />
Subsequent columns display the error rate for cycles 1–35, 1–75, and 1–100.<br />
} Intensity Cycle 1—The average of the four intensities (one per channel or base type)<br />
measured at the first cycle averaged over filtered clusters.<br />
19<br />
Part # <strong>15020619</strong> Rev D