- Page 1:
Autologous Bone Marrow Transplantat
- Page 5 and 6:
Autologous Bone Marrow Transplantat
- Page 7:
To our colleagues, Drs. R. Lee Clar
- Page 10 and 11:
via ABMT Autologous Bone Marrow Tra
- Page 12 and 13:
X ABMT Pharmacological Manipulation
- Page 14 and 15:
XII ABMT C. INTERNATIONAL RANDOMIZE
- Page 16 and 17:
xiu ABMT Session IV - Breast Cancer
- Page 18 and 19:
xui ABMT Panel Discussion: Session
- Page 20 and 21:
xuiii ABMT Effect of Interleukin 2
- Page 23:
Acknowledgments The publication of
- Page 27 and 28:
Autologous Bone Marrow Transplantat
- Page 29 and 30:
AML in First Remission 5 performed
- Page 31:
AML in First Remission 7 than 50% o
- Page 34 and 35:
10 BAVC + ABMT in Patients With AML
- Page 36 and 37:
BAVC + ABMT in Patients With AML in
- Page 38 and 39:
14 BAVC + ABMTin Patients With AML
- Page 40 and 41:
16 Purged ABMT in CR of Acute Leuke
- Page 42 and 43:
18 Purged ABMT in CR of Acute Leuke
- Page 44 and 45:
20 Purged ABMT in CR of Acute Leuke
- Page 46 and 47:
22 Purged ABMT in CR of Acute Leuke
- Page 48 and 49:
24 First-Remission Autograft forAML
- Page 50 and 51:
26 First-Remission Autograft forAML
- Page 52 and 53:
28 First-Remission Autograft forAML
- Page 55 and 56:
Autologous Bone Marrow Transplantat
- Page 57:
Transplantation in CRI AML 33 DISCU
- Page 60 and 61:
36 ABMT in ALL compared the results
- Page 62 and 63:
38 ABMT in ALL were administered un
- Page 64 and 65:
40 ABMT in ALL CR1 patients receive
- Page 66 and 67:
42 ABMT in ALL 19. Rizzoli V, Mango
- Page 68 and 69:
44 ABMTin CRI program in CR1 is the
- Page 70 and 71:
46 ABMTin CRI RESULTS The AML inves
- Page 73 and 74:
Leukemia: First Remission K A. Dick
- Page 75 and 76:
Panel Discussion: Session IA 51 DR.
- Page 77:
IB. Clinical Studies in Second- or
- Page 80 and 81:
56 ABMTIn CR2 RESULTS OF VARIOUS TR
- Page 82 and 83:
58 ABMTIn CR2 antibodies; for non-T
- Page 84 and 85:
60 ABMT in Acute Nonlymphocytic Leu
- Page 86 and 87:
62 ABMT in Acute Nonlymphocytic Leu
- Page 88 and 89:
64 ABMT in Acute Nonlymphocytic Leu
- Page 90 and 91:
66 ABMT in Acute Nonlymphocytic Leu
- Page 92 and 93:
68 ABMT in Acute Nonlymphocytic Leu
- Page 94 and 95:
70 ABMT in AML With Monoclonal Anti
- Page 96 and 97:
72 ABMT in AML With Monoclonal Anti
- Page 98 and 99:
74 ABMT in AML With Monoclonal Anti
- Page 100 and 101:
76 ABMT in AML With Monoclonal Anti
- Page 102 and 103:
78 ABMT in AML With Monoclonal Anti
- Page 104 and 105:
80 Mafosfamide Purging in Leukemia
- Page 106 and 107:
82 Mafosfamide Purging in Leukemia
- Page 108 and 109:
84 Mafosfamide Purging in Leukemia
- Page 110 and 111:
86 Mafosfamide Purging in Leukemia
- Page 113 and 114:
Autologous Bone Marrow Transplantat
- Page 115 and 116:
ABMT in CR2 Pediatric ALL 91 follow
- Page 117 and 118:
Ex Vivo Use of Monoclonal Antibodie
- Page 119 and 120:
Ex Vivo Marrow Purging 95 Table 1.
- Page 121 and 122:
De Viuo Marrow Purging 97 WBC-f- AN
- Page 123 and 124:
Conditioning Regimens Before Bone M
- Page 125 and 126: Conditioning Regimens in AML 101 Le
- Page 127: Conditioning Regimens in AML 103 co
- Page 130 and 131: 106 Double (Jnpurged ABMT in Leukem
- Page 132 and 133: 108 Double Unpurged ABMT in Leukemi
- Page 134 and 135: 770 Double (Jnpurged ABMT in Leukem
- Page 136 and 137: 7/2 Double Autografting in Acute Le
- Page 138 and 139: 114 Double Autografting in Acute Le
- Page 140 and 141: 116 Double Autografting in Acute Le
- Page 142 and 143: 118 Double Autografting in Acute Le
- Page 144 and 145: 120 Recovery After 4-Hydroperoxycyc
- Page 146 and 147: 122 Recovery After 4-Hydroperoxycyc
- Page 149 and 150: Autologous Bone Marrow Transplantat
- Page 151 and 152: Panel Discussion: Session IB 127 di
- Page 153: Panel Discussion: Session IB 129 tu
- Page 157 and 158: Magnetic Affinity Colloid Eliminati
- Page 159 and 160: Magnetic Separation of Marrow Cells
- Page 161 and 162: Magnetic Separation of Marrow Cells
- Page 163 and 164: *r r- r» u. >>• O S ^ CO ai a> C
- Page 165 and 166: Magnetic Separation of Marrow Cells
- Page 167 and 168: 4-Hydroperoxycyclophosphamide and V
- Page 169 and 170: Chemopurging 145 incubation, the ce
- Page 171 and 172: Chemopurging 147 To date, four pati
- Page 173 and 174: Chemopurging 149 4-HC + VCR IC75 AM
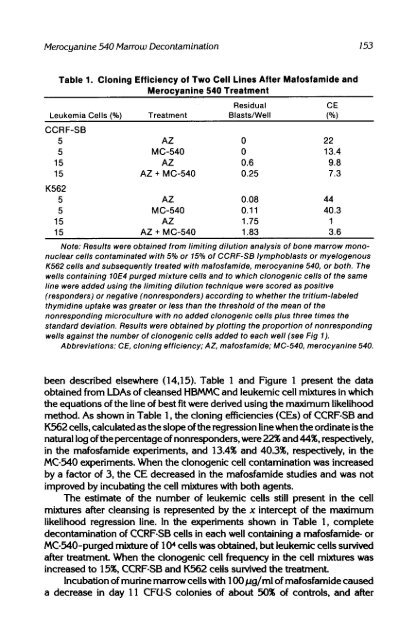
- Page 175: Decontaminating Bone Marrow With Me
- Page 179 and 180: Merocyanine 540 Marrow Decontaminat
- Page 181 and 182: CALLA-Negative Clonogenic Cultures
- Page 183 and 184: CALLA-Negatiœ Clonogenic BCell ALL
- Page 185: CALLA-Negative Clonogenic BCell ALL
- Page 188 and 189: 164 Acetaldophosphamide Ex Vivo Che
- Page 190 and 191: 766 Acetaldophosphamide Ex Vivo Che
- Page 192 and 193: 168 Acetaldophosphamide Ex Viuo Che
- Page 195 and 196: Detecting Residual Disease in Bone
- Page 197 and 198: Detecting Residual Disease in Bone
- Page 199: Detecting Residual Disease in Bone
- Page 202 and 203: 178 Pharmacological Manipulation an
- Page 204 and 205: 180 Pharmacological Manipulation an
- Page 206 and 207: 182 Pharmacological Manipulation an
- Page 208 and 209: 784 Pharmacological Manipulation an
- Page 211: ID. Chronic Myelogenous Leukemia
- Page 214 and 215: 190 CML Chronic Phase Autografting
- Page 216 and 217: 792 CML Chronic Phase Autografting
- Page 218 and 219: 194 CML Chronic Phase Autografting
- Page 220 and 221: 196 CML Blast Crisis Autografting e
- Page 223 and 224: Autologous Transplantation of Phila
- Page 225 and 226: Autografting in Chronic Granulocyti
- Page 227:
Autografting in Chronic Granulocyti
- Page 230 and 231:
206 Panel Discussion: Session ID DR
- Page 233 and 234:
Natural History of Relapsed Hodgkin
- Page 235 and 236:
ABMT in Hodgkin's Disease 211 50%.
- Page 237 and 238:
ABMTin Hodgkin, 's Disease 213 (62%
- Page 239 and 240:
ABMT in Hodgkin's Disease 215 LLLLL
- Page 241 and 242:
Updated Results of CBV and Autologo
- Page 243 and 244:
CBV and ABMT in Hodgkin's Disease 2
- Page 245:
CBV and ABMT in Hodgkin 's Disease
- Page 248 and 249:
224 Chemotherapy and ABMT in Hodgki
- Page 250 and 251:
226 Chemotherapy and ABMTin Hodgkin
- Page 252 and 253:
228 Chemotherapy and ABMT in Hodgki
- Page 254 and 255:
230 Chemotherapy and ABMT in Hodgki
- Page 256 and 257:
232 ABMT for Advanced Hodgkin's Dis
- Page 258 and 259:
234 ABMTfor Advanced Hodgkin's Dise
- Page 261 and 262:
Hodgkin's Disease J. O. Armitage an
- Page 263 and 264:
Panel Discussion: Session IIA 239 D
- Page 265:
IIB. Non-Hodgkin's Lymphoma
- Page 268 and 269:
244 Salvage Chemotherapy for Lympho
- Page 270 and 271:
246 Salvage Chemotherapy for Lympho
- Page 273 and 274:
Autologous Bone Marrow Transplantat
- Page 275 and 276:
ABMT in Burkitt's Lymphoma 251 Tabl
- Page 277 and 278:
ABMT in Burkitt's Lymphoma 253 medi
- Page 279 and 280:
ABMT in Burkitt's Lymphoma 255 Heal
- Page 281 and 282:
ABMT in Burkitt's Lymphoma 257 •
- Page 283 and 284:
ABMT in Burkitt's Lymphoma 259 init
- Page 285:
ABMT in Burkitt's Lymphoma 261 11.
- Page 288 and 289:
264 Myeloma Biology and Therapy hig
- Page 290 and 291:
266 Myeloma Biology and Therapy mon
- Page 292 and 293:
265 Myeloma Biology and Therapy 5.
- Page 294 and 295:
270 BMT in Relapsed Diffuse Large C
- Page 296 and 297:
272 BMT in Relapsed Diffuse Large C
- Page 298 and 299:
274 BMT in Relapsed Diffuse Large C
- Page 300 and 301:
276 Transplantation for Malignant L
- Page 303 and 304:
Optimum Timing of Autologous Bone M
- Page 305 and 306:
ABMT Timing in Lymphoma 281 PATIENT
- Page 307 and 308:
3 o + + + + o LO T— T— LO co Tf
- Page 309 and 310:
ABMT Timing in Lymphoma 285 RESULTS
- Page 311 and 312:
co co I I I I I I I I I I 2 2 2 CD
- Page 313 and 314:
ABMT Timing in Lymphoma 289 Median
- Page 315 and 316:
ABMT Timing in Lymphoma 291 in a mi
- Page 317 and 318:
ABMT Timing in Lymphoma 293 Develop
- Page 319:
ABMT Timing in Lymphoma 295 53. Sto
- Page 322 and 323:
298 Treatment Strategies for NHL PA
- Page 324 and 325:
300 Treatment Strategies for NHL 10
- Page 326 and 327:
302 Treatment Strategies for NHL 2)
- Page 328 and 329:
304 Treatment Strategies for NHL al
- Page 330 and 331:
306 Treatment Strategies for NHL 31
- Page 332 and 333:
308 Panel Discussion: Session IIB m
- Page 335:
IIC. International Randomized Study
- Page 338 and 339:
314 Proposed International Adult Ly
- Page 340 and 341:
316 Proposed International Adult Ly
- Page 342 and 343:
318 Proposed International Adult Ly
- Page 344 and 345:
320 Proposed International Adult Ly
- Page 346 and 347:
322 Proposed International Adult Ly
- Page 348 and 349:
324 Proposed International Adult Ly
- Page 350 and 351:
326 Proposed International Adult Ly
- Page 352 and 353:
328 Proposed International Adult Ly
- Page 354 and 355:
330 Proposed International Adult Ly
- Page 356 and 357:
332 Proposed International Adult Ly
- Page 359 and 360:
International Randomized Trial in N
- Page 361 and 362:
International NHL Trial 337 dispari
- Page 363 and 364:
International NHL Trial 339 cannot
- Page 365 and 366:
International NHL Trial 341 ORGANIZ
- Page 367 and 368:
Lymphoma T. Philip and G. Spitzer,
- Page 369:
IID. Purging and Detection
- Page 372 and 373:
348 Chemoimmunoseparation of T Lymp
- Page 374 and 375:
350 Chemoimmunoseparation of T Lymp
- Page 376 and 377:
352 Burkitt's Lymphoma Purging Assa
- Page 378 and 379:
354 Burkitts Lymphoma Purging Assay
- Page 380 and 381:
356 Burkitt's Lymphoma Purging Assa
- Page 382 and 383:
358 Burkitts Lymphoma Purging Assay
- Page 384 and 385:
360 Purging Methods in Burkitt's Ly
- Page 386 and 387:
362 Purging Methods in Burkitt's Ly
- Page 388 and 389:
364 Purging Methods in Burkitt's Ly
- Page 390 and 391:
366 Leukemia Cell Sensitivity to Im
- Page 392 and 393:
368 Leukemia Cell Sensitivity to Im
- Page 394 and 395:
370 Leukemia Cell Sensitiuity to Im
- Page 396 and 397:
372 Panel Discussion: Session IID D
- Page 399 and 400:
Autologous Bone Marrow Transplantat
- Page 401 and 402:
ABMTfor Neuroblastoma 377 sedimenta
- Page 403 and 404:
ABMT for Neuroblastoma 379 EX VIVO
- Page 405 and 406:
ABMTfor Neuroblastoma 381 PATIENTS
- Page 407 and 408:
Repeated High-Dose Chemotherapy Fol
- Page 409 and 410:
ABMT in Metastatic Neuroblastoma 38
- Page 411 and 412:
ABMT in Metastatic Neuroblastoma 38
- Page 413 and 414:
ABMT in Metastatic Neuroblastoma 38
- Page 415:
ABMT in Metastatic neuroblastoma 39
- Page 418 and 419:
394 Clnpurged ABMTfor Neuroblastoma
- Page 420 and 421:
396 Unpurged ABMTfor Neuroblastoma
- Page 422 and 423:
398 Unpurged ABMTfor Neuroblastoma
- Page 425 and 426:
ENSG 1—Randomized Study of High-D
- Page 427 and 428:
High-Dose Melphalan in Neuroblastom
- Page 429:
High-Dose Melphalan in Neuroblastom
- Page 432 and 433:
408 ABMTin 65 Patients With Neurobl
- Page 434 and 435:
410 ABMT in 65 Patients With. Neuro
- Page 436 and 437:
412 ABMTin 65 Patients With Neurobl
- Page 438 and 439:
414 ABMTin 65 Patients With Neurobl
- Page 440 and 441:
416 ABMTin 65 Patients With neurobl
- Page 443 and 444:
A Single Institution's Experience o
- Page 445 and 446:
ABMT in Neuroblastoma 421 procedure
- Page 447:
ABMT in Neuroblastoma 423 therapies
- Page 450 and 451:
426 Purged Marrow Engraftment in Ne
- Page 452 and 453:
428 Purged Marrow Engraftment in Ne
- Page 454 and 455:
430 Purged Marrow Engraftment in Ne
- Page 457 and 458:
Digital Image Analysis System for D
- Page 459 and 460:
Digital Image Analysis System 435 d
- Page 461 and 462:
Digital Image Analysis System 437 c
- Page 463 and 464:
Digital Image Analysis System 439 C
- Page 465:
Digital Image Analysis System 441 1
- Page 468 and 469:
444 Immune-magnetic Purging ofBurki
- Page 470 and 471:
446 Immune-magnetic Purging ofBurki
- Page 472 and 473:
448 Immune-magnetic Purging ofBurki
- Page 474 and 475:
450 Panel Discussion: Session III W
- Page 476 and 477:
452 Panel Discussion: Session III e
- Page 479 and 480:
High-Dose Chemotherapy Intensificat
- Page 481 and 482:
High-Dose Chemotherapy and ABMT in
- Page 483 and 484:
High-Dose Chemotherapy and ABMT in
- Page 485 and 486:
High-Dose Chemotherapy and ABMT in
- Page 487:
High-Dose Chemotherapy and ABMT in
- Page 490 and 491:
466 Treatment Strategies in Breast
- Page 492 and 493:
468 Treatment Strategies in Breast
- Page 494 and 495:
470 Treatment Strategies in Breast
- Page 496 and 497:
10 CO 0) I- m c o a. a. 3 W ? o k_
- Page 498 and 499:
474 Treatment Strategies in Breast
- Page 500 and 501:
476 Phase I and II Studies of Alkyl
- Page 502 and 503:
478 Phase I and II Studies of Alkyl
- Page 504 and 505:
480 Phase I and II Studies of Alkyl
- Page 506 and 507:
482 High-Dose Therapy and ABMT in B
- Page 508 and 509:
484 High-Dose Therapy and ABMT in B
- Page 510 and 511:
486 Immunodetection of Breast Carci
- Page 513 and 514:
Autologous Bone Marrow Transplantat
- Page 515 and 516:
ABMTfor Breast Cancer 491 only adju
- Page 517 and 518:
ABMT for Breast Cancer 493 Table 3.
- Page 519:
ABMTfor Breast Cancer 495 4. Eder J
- Page 522 and 523:
498 Occult Breast Cancer Cells in M
- Page 524 and 525:
500 Occult Breast Cancer Cells in M
- Page 526 and 527:
502 Occult Breast Cancer Cells in M
- Page 528 and 529:
504 Panel Discussion: Session IV DR
- Page 530 and 531:
506 Panel Discussion: Session IV a
- Page 533 and 534:
Detection of Bone Marrow Metastases
- Page 535 and 536:
Tumor Cell Detection 511 Two separa
- Page 537:
Tumor Cell Detection 513 immunofluo
- Page 540 and 541:
516 Etoposide and Cisplatin for Lun
- Page 542 and 543:
518 Etoposide and Cisplatin for Lun
- Page 544 and 545:
520 Etoposide and Cisplatin for Lun
- Page 547 and 548:
Lung Cancer G. Spitzer and H. Lazar
- Page 549 and 550:
Panel Discussion: Session V 525 com
- Page 551:
Panel Discussion: Session V 527 col
- Page 555 and 556:
Treatment of Advanced Melanoma With
- Page 557 and 558:
ABMT in Melanoma 533 Table 1. Three
- Page 559 and 560:
ABMT in Melanoma 535 mg/m 2 ). The
- Page 561 and 562:
Melanoma/ Sarcoma/ Carcinoma R. Ben
- Page 563 and 564:
Panel Discussion: Session VI 539 re
- Page 565:
VII. Brain Cancer
- Page 568 and 569:
544 Carmustine and ABMT for Maligna
- Page 570 and 571:
546 Carmustine and ABMTfor Malignan
- Page 573 and 574:
Pilot Study of High-Dose Carmustine
- Page 575 and 576:
High-Dose Carmustine and Transplant
- Page 577 and 578:
High-Dose Carmustine and Transplant
- Page 579 and 580:
High-Dose Carmustine and Transplant
- Page 581 and 582:
High-Dose Chemotherapy With Autolog
- Page 583 and 584:
High-Dose Therapy of CNS Gliomas Ta
- Page 585 and 586:
High-Dose Therapy of CHS Gliomas 56
- Page 587:
High-Dose Therapy of CHS Gliomas 56
- Page 590 and 591:
566 Panel Discussion: Session VII A
- Page 593:
VIII. New Regimens
- Page 596 and 597:
572 Clinical Intensification Regime
- Page 598 and 599:
574 Clinical Intensification Regime
- Page 600 and 601:
Clinical Intensification Regimens f
- Page 602 and 603:
Clinical Intensification Regimens f
- Page 605 and 606:
High-Dose Busulfan and Cyclophospha
- Page 607 and 608:
Busulfan + Cyclophosphamide in Chil
- Page 609 and 610:
Busulfan + Cyclophosphamide in Chil
- Page 611 and 612:
Busulfan + Cyclophosphamide in Chil
- Page 613 and 614:
The Intensive Use of Carmustine Wit
- Page 615:
Intensive Use ofCarmustine 591 6. P
- Page 618 and 619:
594 BEAM: Cytoreductive Regimen for
- Page 620 and 621:
596 BEAM: Cytoreductiue Regimen for
- Page 622 and 623:
598 BEAM: Cytoreductiue Regimen for
- Page 624 and 625:
600 BEAM: Cytoreductiue Regimen for
- Page 626 and 627:
602 Total Body Irradiation, Cytarab
- Page 628 and 629:
604 Total Body Irradiation, Cytarab
- Page 630 and 631:
606 Panel Discussion: Session VIII
- Page 633 and 634:
Herpesvirus Infections After Autolo
- Page 635 and 636:
Herpesvirus Infections 611 Table 2.
- Page 637:
Herpesvirus Infections 613 contrast
- Page 640 and 641:
616 Peripheral Stem Cell Transplant
- Page 642 and 643:
678 Peripheral Stem Cell Transplant
- Page 644 and 645:
CO ^ CO COi-t'ycOi-T-CO O E « to T
- Page 646 and 647:
622 Peripheral Stem Cell Transplant
- Page 648 and 649:
fc CD rr ^ O < c E + o — ce S O O
- Page 650 and 651:
o E ra o CD .Q Û ra co CL o E o 15
- Page 652 and 653:
628 Peripheral Stem Cell Transplant
- Page 654 and 655:
630 Peripheral Stem Cell Transplant
- Page 656 and 657:
632 Peripheral Stem Cell Transplant
- Page 658 and 659:
634 Toxic Deaths in ABMT PATIENTS A
- Page 660 and 661:
636 Toxic Deaths in ABMT Table 2. D
- Page 662 and 663:
638 Toxic Deaths in ABMT defined an
- Page 664 and 665:
640 Infectious Complications ofABMT
- Page 666 and 667:
642 Infectious Complications ofABMT
- Page 668 and 669:
644 Infectious Complications ofABMT
- Page 671 and 672:
Infectious Complications of Autolog
- Page 673 and 674:
Infections in ABMT 649 Table 1. ABM
- Page 675 and 676:
Infections in ABMT 651 herpes simpl
- Page 677 and 678:
Newer Antibiotic Regimens in Cancer
- Page 679 and 680:
Antibiotics in Cancer Patients 655
- Page 681:
Antibiotics in Cancer Patients 657
- Page 684 and 685:
660 Amphotericin B for Neutropenic
- Page 686 and 687:
662 Amphotericin B for Neutropenie
- Page 688 and 689:
664 Amphotericin B for Neutropenie
- Page 690 and 691:
666 IVIg in ABMT in autologous tran
- Page 692 and 693:
668 IVlg in ABMT 25. Neiman PE, Ree
- Page 694 and 695:
670 Natural Killer Cells and Transp
- Page 696 and 697:
672 Natural Killer Cells and Transp
- Page 699 and 700:
Autologous Transplantation of Circu
- Page 702 and 703:
678 Transplantation of Circulating
- Page 705 and 706:
Restoration of Hematopoietic Functi
- Page 707 and 708:
Peripheral Stem Cell Transplants 68
- Page 709:
Peripheral Stem Cell Transplants 68
- Page 712 and 713:
688 Peripheral Blood Stem Cell Tran
- Page 714 and 715:
690 Peripheral Blood Stem Cell Tran
- Page 716 and 717:
692 Peripheral Blood Stem Cell Tran
- Page 718 and 719:
694 Bronchoscopy in Marrow Transpla
- Page 720 and 721:
696 Bronchoscopy in Marrow Transpla
- Page 722 and 723:
698 T Lymphocyte CFU After ABMT cer
- Page 724 and 725:
700 T Lymphocyte CFCI After ABMT RE
- Page 726 and 727:
702 T Lymphocyte CFU After ABMT CMV
- Page 729 and 730:
Supportive Therapy H. Vriesendorp a
- Page 731:
X. Molecular Biology
- Page 734 and 735:
770 Human ADA in Monkeys years in a
- Page 736 and 737:
7/2 Human ADA in Monkeys supernatan
- Page 738 and 739:
714 Human ADA in Monkeys Number of
- Page 740 and 741:
776 Human ADA in Monkeys primate ma
- Page 742 and 743:
718 Electric Field-Mediated DMA Tra
- Page 744 and 745:
720 Electric Field-Mediated DNA Tra
- Page 747 and 748:
Aberrant Gene Expression in Acute M
- Page 749 and 750:
+ z + + + les •ras a z E i ü (0
- Page 751 and 752:
Aberrant Gene Expression in AML 727
- Page 753:
Aberrant Gene Expression in AML 729
- Page 756 and 757:
732 Clonal Detection of Remission p
- Page 758 and 759:
734 Clonal Detection of Remission K
- Page 760 and 761:
736 Clonal Detection of Remission 3
- Page 763 and 764:
Summary D. W. van Bekkum Attempts t
- Page 765 and 766:
Summary 741 T cell-depleted bone ma
- Page 767 and 768:
Summary 743 hybridization technique
- Page 769:
Summary 745 GENETIC THERAPY The las
- Page 772 and 773:
748 Concluding Remarks time of the
- Page 774 and 775:
750 Contributors and Participants F
- Page 776 and 777:
752 Contributors and Participants F
- Page 778 and 779:
754 Contributors and Participants P
- Page 780 and 781:
756 Contributors and Participants A
- Page 782 and 783:
758 Contributors and Participants P
- Page 784 and 785:
760 Contributors and Participants F
- Page 786 and 787:
762 Contributors and Participants H
- Page 788 and 789:
764 Contributors and Participants A
- Page 790 and 791:
766 Contributors and Participants G
- Page 792 and 793:
768 Contributors and Participants G
- Page 794 and 795:
770 Contributors and Participants S
- Page 796 and 797:
772 Contributors and Participants C
- Page 798 and 799:
774 Contributors and Participants G
- Page 800:
776 Contributors and Participants D