The state of water resources in the Philippines - Greenpeace
The state of water resources in the Philippines - Greenpeace
The state of water resources in the Philippines - Greenpeace

You also want an ePaper? Increase the reach of your titles
YUMPU automatically turns print PDFs into web optimized ePapers that Google loves.
Region I - San Fernando, La Union<br />
Region II - Cagayan, Nueva Viscaya<br />
Region III - Pampanga<br />
Region IV-B - Oriental M<strong>in</strong>doro<br />
Region VI - Iloilo City<br />
Region VII - Cebu City<br />
Region VIII - Leyte<br />
Region IX - Zamboanga City<br />
Region XI - Davao City<br />
D. Pollution hot spots<br />
Reviewed materials from <strong>the</strong> DENR and <strong>the</strong> PEM series identified three ma<strong>in</strong><br />
sources <strong>of</strong> pollution: domestic waste<strong>water</strong> discharges (also called ‘municipal’),<br />
agricultural waste<strong>water</strong>, and <strong>in</strong>dustrial waste<strong>water</strong>.<br />
<strong>The</strong>se were fur<strong>the</strong>r classified as ei<strong>the</strong>r ‘po<strong>in</strong>t sources’, those which emit harmful<br />
substances directly <strong>in</strong>to a particular <strong>water</strong> body, or ‘non-po<strong>in</strong>t sources’, which<br />
have no identifiable source but are scattered with pollutants delivered <strong>in</strong>directly.<br />
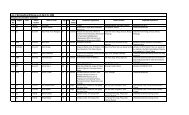
Table 3 presents <strong>the</strong> data from PEM 2003 and those presented <strong>in</strong> <strong>the</strong> EMB 2001-<br />
2005 National Water Quality Status Report.<br />
PEM 2003<br />
EMB 2001-2005 Status<br />
Report<br />
Po<strong>in</strong>t Sources:<br />
- Domestic Waste<strong>water</strong> 48 % 33 %<br />
- Agricultural Waste<strong>water</strong> 37 % 29 %<br />
- Industrial Waste<strong>water</strong> 15 % 27 %<br />
Non-po<strong>in</strong>t sources Not <strong>in</strong>cluded 11 %<br />
Table 3. Pollution from key potential sources<br />
Although accounts <strong>of</strong> key sources <strong>of</strong> pollution for <strong>the</strong> two reports are both based<br />
on BOD load, <strong>the</strong>se reports represent two different sets <strong>of</strong> references. One is<br />
based on data compiled from 1995 – 2001 (PEM 2003 report), and <strong>the</strong> o<strong>the</strong>r is<br />
based on results <strong>of</strong> <strong>the</strong>ir assessment for 2001 - 2005 (EMB Status Report).<br />
Domestic waste<strong>water</strong><br />
Domestic effluents are generated from activities such as bath<strong>in</strong>g, laundry,<br />
clean<strong>in</strong>g, cook<strong>in</strong>g, wash<strong>in</strong>g, and o<strong>the</strong>r kitchen activities. This conta<strong>in</strong>s a large<br />
amount <strong>of</strong> organic waste with suspended solids and coliforms. Calculations made<br />
based on available data show that half <strong>the</strong> organic waste is from <strong>the</strong> domestic<br />
sector (PEM, 2003).<br />
GREENPEACE | <strong>The</strong> <strong>state</strong> <strong>of</strong> <strong>water</strong> <strong>in</strong> <strong>the</strong> Philipp<strong>in</strong>es 18