SCANIA INTERIM REPORT – JANUARY - MARCH 2002 “In western ...
SCANIA INTERIM REPORT – JANUARY - MARCH 2002 “In western ...
SCANIA INTERIM REPORT – JANUARY - MARCH 2002 “In western ...
You also want an ePaper? Increase the reach of your titles
YUMPU automatically turns print PDFs into web optimized ePapers that Google loves.
22 April, <strong>2002</strong><br />
<strong>SCANIA</strong> <strong>INTERIM</strong> <strong>REPORT</strong> – <strong>JANUARY</strong> - <strong>MARCH</strong> <strong>2002</strong><br />
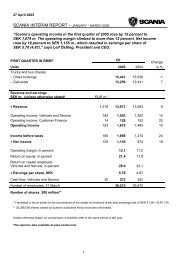
“In <strong>western</strong> Europe the slowdown in demand flattened out, at least<br />
temporarily. Cost adjustments in European operations and action<br />
programmes in Latin America are continuing,” says Leif Östling,<br />
President and CEO.<br />
FIRST QUARTER IN BRIEF<br />
First quarter<br />
Units USD m.* <strong>2002</strong> 2001<br />
Trucks and buses<br />
Change in<br />
%<br />
– Order bookings 12,735 12,569 1<br />
– Deliveries 10,040 11,727 -14<br />
Sales and earnings 1<br />
SEK m. unless otherwise stated<br />
Sales 1,208 12,487 12,405 1<br />
Operating income 74 770 952 -19<br />
Income after financial items 54 564 819 -31<br />
Net income 37 383 573 -33<br />
Operating margin,<br />
Scania Group, percent 6.2 7.7<br />
Operating margin,<br />
Scania products 2 , percent<br />
6.6 8.5<br />
Return on equity, percent 5.4 20.2<br />
Return on capital employed, excluding<br />
customer finance operations, percent 7.9 18.6<br />
Earnings per share, SEK 0.19 1.92 2.87<br />
Cash flow excluding customer finance<br />
operations and acquisitions<br />
13 130 571<br />
Number of employees, 31 March 28,619 28,770<br />
Number of shares: 200 million<br />
Unless otherwise stated, all comparisons in brackets refer to the same period of last year.<br />
This report is also available at www.scania.com<br />
* Translated solely for the convenience of the reader at a closing exchange rate of SEK 10.3375 = USD 1.00.<br />
1 Excluding capital gains on the divestment of Svenska Volkswagen AB and Din Bil AB. See page 5 for more information.<br />
2<br />
Trucks, buses, engines and service-related products.<br />
1
<strong>SCANIA</strong> <strong>INTERIM</strong> <strong>REPORT</strong> - <strong>JANUARY</strong> – <strong>MARCH</strong> <strong>2002</strong><br />
<strong>SCANIA</strong>, FIRST QUARTER OF <strong>2002</strong> – COMMENTS BY THE PRESIDENT AND CEO<br />
“The operating income of the Scania Group during the first quarter of <strong>2002</strong> was SEK 770 m.<br />
Operating income for Scania products totalled SEK 724 m. Truck deliveries declined by 13 percent in<br />
<strong>western</strong> Europe, while sales of service-related products in European operations rose by 9 percent.<br />
Earnings in customer finance operations continued to increase,” Leif Östling notes.<br />
“Macroeconomic forecasts for <strong>western</strong> Europe have recently become more favourable, although a<br />
number of potential threats remain. The slowdown in demand for heavy trucks in <strong>western</strong> Europe<br />
recently appears to have flattened out, at a higher level than I had anticipated. It is still too early to<br />
predict whether this is a lasting trend.<br />
“Order bookings rose during the first quarter, and the pace of production will increase in European<br />
operations. Scania’s market share rose during the quarter to 14.9 percent in <strong>western</strong> Europe.<br />
“Productivity improvements in the European production system are continuing, following the<br />
departure of about 1,200 persons from the company since the market turned downward late in 2000.<br />
Cab production is being concentrated at Oskarshamn, Sweden as the new topcoat paintshop and<br />
investments for higher production volume are placed in service. The co-ordination between buses<br />
and trucks will also lead to productivity improvements. These ventures will decrease the workforce by<br />
about another 600 persons. The measures will have a gradual effect during the latter part of the year.<br />
“Order bookings in bus operations increased. The co-ordination between trucks and buses in<br />
European operations is continuing as planned.<br />
“Volume declined in Latin America. In practice, the Argentinean market disappeared as a<br />
consequence of economic and political chaos. At the same time, our volume declined in Brazil<br />
mainly as a consequence of the price hikes we are implementing in order to bring truck prices to a<br />
world market level. The improvement in prices, along with the lowering of the cost level, has begun to<br />
have an effect. At the same time, exports of components from Latin America to the European<br />
production system will increase.<br />
“We sold our 50 percent holding in the Swedish importer operations of Svenska Volkswagen and the<br />
dealership chain Dil Bil to Volkswagen AG of Germany. On behalf of Scania’s Board of Directors,<br />
ABN-Amro Bank reviewed both transactions and issued financial fairness opinions. The main reason<br />
behind these divestments is the increasingly rapid divergence in operations, with trucks as<br />
investment products and cars as consumer goods. As soon as the relevant authorities have<br />
approved these divestments, the item ‘Car operations’ will disappear from Scania Group financial<br />
statements. The overall capital gain on the divestments is estimated at around SEK 550 m.<br />
“The co-operation agreement we have now entered with the Japanese truck manufacturer Hino will<br />
give us the opportunity to get a foot into the Japanese market in a cost-effective way. In the long<br />
term, there is good development potential in the agreement, since Hino and Scania complement<br />
each other both in terms of product range and geographic presence.<br />
“In <strong>western</strong> Europe the slowdown in demand flattened out, at least temporarily. Cost adjustments in<br />
European operations and action programmes in Latin America are continuing,” Mr Östling concludes.<br />
2
<strong>SCANIA</strong> <strong>INTERIM</strong> <strong>REPORT</strong> - <strong>JANUARY</strong>- <strong>MARCH</strong> <strong>2002</strong><br />
<strong>SCANIA</strong> <strong>INTERIM</strong> <strong>REPORT</strong> - <strong>JANUARY</strong> - <strong>MARCH</strong> <strong>2002</strong><br />
THE MARKET<br />
In <strong>western</strong> Europe, the slowdown in demand<br />
flattened out during the first quarter. Measured as<br />
registrations, the total market for heavy trucks was<br />
about 52,400 (64,400) units. Scania’s market<br />
share rose to 14.9 (14.5) percent. Order bookings<br />
rose by 5 percent to 8,254 (7,882) units.<br />
In central and eastern Europe, economic growth<br />
continued, which led to an increase in order<br />
bookings in these markets.<br />
In Latin America, order bookings declined by 60<br />
percent compared to the same period of last year.<br />
In Argentina the decline was due to the political<br />
and economic crisis in the country. In Brazil it was<br />
mainly due to the sharp price hike Scania carried<br />
out at the turn of the year. Scania’s market share<br />
in Brazil declined to 17.6 (29.1) percent.<br />
Order bookings for buses and coaches rose by 35<br />
percent to 1,375 (1,015) units. In Europe, order<br />
bookings rose by 70 percent, while they declined<br />
by 5 percent in Latin America.<br />
Scania’s sales of industrial and marine engines<br />
fell during the first quarter to 643 (760) units.<br />
Number of Scania truck registrations,<br />
January-March<br />
<strong>2002</strong> 2001<br />
Change<br />
in %<br />
Great Britain 1,366 1,329 2.8<br />
France 1,188 1,488 -20.2<br />
Germany* 957 1,099 -12.9<br />
Italy 867 977 -11.3<br />
Spain 846 900 -6.0<br />
Brazil 703 1,288 -45.4<br />
The Netherlands 575 830 -30.7<br />
Belgium 374 521 -28.2<br />
Sweden 364 421 -13.5<br />
South Korea 339 267 27.0<br />
Western Europe 7,826 9,349 -16.3<br />
Scania’s market shares,<br />
January-March, percent<br />
<strong>2002</strong> 2001<br />
Great Britain 20.3 18.3<br />
France 10.6 10.8<br />
Germany* 9.0 8.0<br />
Italy 15.3 14.7<br />
Spain 14.1 12.8<br />
Brazil 17.6 29.1<br />
The Netherlands 18.2 20.0<br />
Belgium 18.6 19.2<br />
Sweden 48.2 43.7<br />
South Korea 12.9 16,3<br />
Western Europe 14.9 14.5<br />
* Preliminary figures<br />
3
<strong>SCANIA</strong> <strong>INTERIM</strong> <strong>REPORT</strong> - <strong>JANUARY</strong>- <strong>MARCH</strong> <strong>2002</strong><br />
SALES (SEK m.)<br />
SALES<br />
During the first quarter, the Scania Group’s<br />
deliveries of trucks totalled 9,132 (10,893)<br />
units, which was a decline of 16 percent. Bus<br />
and coach deliveries totalled 908 (834) units,<br />
an increase of 9 percent.<br />
The Scania Group’s sales rose by 1 percent to<br />
SEK 12,487 m. (12,405). Group sales were<br />
positively influenced by net currency rate<br />
effects of about SEK 500 m., including<br />
hedging.<br />
16,000<br />
14,000<br />
12,000<br />
10,000<br />
8,000<br />
6,000<br />
4,000<br />
2,000<br />
0<br />
Q 1 Q 2 Q 3 Q 4<br />
OPERATING INCOME (SEK m.)<br />
2000<br />
2001<br />
<strong>2002</strong><br />
Sales of service-related products rose by 9<br />
percent to SEK 2,681 m. (2,465).<br />
2,500<br />
2,000<br />
EARNINGS<br />
The Scania Group’s operating income<br />
amounted to SEK 770 m. (952), equivalent to a<br />
margin of 6.2 (7.7) percent. The operating<br />
margin for Scania products amounted to 6.6<br />
(8.5) percent. Capitalisation of research and<br />
development expenses positively affected the<br />
EBIT-margin with approximately 0.8<br />
percentage points compared to last year.<br />
1,500<br />
1,000<br />
500<br />
0<br />
Q 1 Q 2 Q 3 Q 4<br />
2000<br />
2001<br />
<strong>2002</strong><br />
Operating income for European operations 3 amounted to SEK 1,247 m. (1,520), excluding research<br />
and development expenses as well as corporate costs. Compared to last year, earnings were<br />
favourably influenced by:<br />
• Positive net currency rate effects, including hedging, of about SEK 350 m.<br />
• Somewhat higher average revenue per truck.<br />
Earnings were adversely influenced by:<br />
• Lower volume, including lower capacity utilisation.<br />
• Production changeover expenses of about SEK 100 m.<br />
Operating income in Latin American operations amounted to SEK -58 m. (-36). In practice, the<br />
market in Argentina disappeared due to economic and political chaos. In Brazil, volume fell mainly as a<br />
consequence of price hikes that Scania carried out in order to achieve a reasonable world market price.<br />
The price hikes carried out in Brazil, cost savings in both Brazil and Argentina plus an improved<br />
currency rate situation could not fully offset lower volume.<br />
Research and development expenses for the Group amounted to SEK 392 m. (485). Aside from the<br />
year’s expense of SEK 392 m., SEK 105 m. was capitalised in compliance with Recommendation RR<br />
15 of the Swedish Financial Accounting Standards Council.<br />
Earnings in customer finance operations rose to SEK 81 m. (70). The growth in the customer finance<br />
portfolio ceased due to lower vehicle sales in the first quarter, and the portfolio amounted to SEK 24,447<br />
m. (22,761).<br />
3 European operations are the portion of Scania’s operations that, in principle, supply all markets except Latin American<br />
ones with the company’s products, services and financing.<br />
4
<strong>SCANIA</strong> <strong>INTERIM</strong> <strong>REPORT</strong> - <strong>JANUARY</strong>- <strong>MARCH</strong> <strong>2002</strong><br />
Operating income in car operations 4 rose to SEK 46 m. (9) due to higher volume as well as somewhat<br />
improved margins. Scania and Volkswagen AG of Germany reached an agreement to the effect that<br />
Volkswagen will acquire Scania’s fifty percent holding in Svenska Volkswagen AB plus the Swedish car<br />
distributor Din Bil AB. The purchase prices are SEK 870 m. and SEK 450 m., respectively, and are<br />
expected to result in capital gains of about SEK 250 m. and about SEK 300 m., respectively. These<br />
gains will be reported as soon as the relevant competition authority has granted its approval, minus the<br />
earnings reported during the first quarter.<br />
Net financial items totalled SEK -206 m. (-133). The reason for the lower net financial items is that<br />
last year’s net financial items included an exchange gain on loans in local currencies in Latin<br />
America.<br />
The Scania Group’s tax expenses were equivalent to 31.9 (30.1) percent of income after financial<br />
items. The increase was explained by changes in the geographic distribution of earnings.<br />
CASH FLOW<br />
Scania’s cash flow, excluding customer finance operations and acquisitions, amounted to<br />
SEK 130 m. (571).<br />
Cash from operating activities amounted to SEK 960 m.<br />
Tied-up working capital rose by SEK 341 m., mainly due to an increase in inventories, which was<br />
partially offset by increased operating liabilities.<br />
Net investments excluding acquisitions/divestments of businesses totalled SEK -489 m. (-419),<br />
including capitalisation of SEK 105 m. of Scania Group’s research and development expenses. Net<br />
investments through acquisitions/divestments of businesses amounted to SEK -129 m. (-859).<br />
MISCELLANEOUS<br />
Number of employees<br />
The total number of employees at the close of the first quarter was 28,619, compared to 28,342 at yearend<br />
2001. The net effect of acquisitions/divestments resulted in an increase of 271 persons.<br />
Changes in accounting principles<br />
Beginning with the first quarter of <strong>2002</strong>, Scania is applying recommendation RR 15 of the Swedish<br />
Financial Accounting Standards Council, related to intangible assets. This means that a certain portion<br />
of Scania’s Group-wide research and development expenditures will be recognised as assets and<br />
amortised over its estimated useful life.<br />
Södertälje, 22 April <strong>2002</strong><br />
LEIF ÖSTLING<br />
President and CEO<br />
This Interim report has not been subjected to special review by the company’s auditors.<br />
5
<strong>SCANIA</strong> <strong>INTERIM</strong> <strong>REPORT</strong> - <strong>JANUARY</strong>- <strong>MARCH</strong> <strong>2002</strong><br />
4<br />
Car operations include half the importer operations of the Svenska Volkswagen Group in Sweden; the wholly<br />
owned Swedish car dealership network Din Bil; and car dealership networks in Finland and Switzerland.<br />
Financial information from Scania<br />
Scania’s Interim Report for January-June <strong>2002</strong> will be published on 19 July <strong>2002</strong>.<br />
This report contains forward-looking statements that reflect management’s current views with respect to certain<br />
future events and potential financial performance. Such forward-looking statements involve risks and<br />
uncertainties that could significantly alter potential results. These statements are based on certain assumptions,<br />
including assumptions related to general economic and financial conditions in the company’s markets and the<br />
level of demand for the company’s products.<br />
This report does not imply that the company has undertaken to revise these forward-looking statements, beyond<br />
what is required under the company’s registration contract with Stockholmsbörsen (formerly the OM Stockholm<br />
Stock Exchange) if and when circumstances arise that will lead to changes compared to the date when these<br />
statements were provided.<br />
For further information, please contact:<br />
Magnus Hahn, Business Communications tel. +46-8 5538 3510,<br />
mobile tel. +46-70 551 7903<br />
Joanna Daugaard, Investor Relations tel. +46-8 5538 3716,<br />
mobile tel. +46-70 518 3716<br />
Torbjörn Boije, Corporate Control tel. +46 8 5538 2228<br />
mobile tel. +46-70 591 5016<br />
6
Earnings by area of operations<br />
<strong>SCANIA</strong> <strong>INTERIM</strong> <strong>REPORT</strong> - <strong>JANUARY</strong>- <strong>MARCH</strong> <strong>2002</strong><br />
Amounts in SEK m.<br />
First quarter Change<br />
Apr 01-<br />
unless otherwise stated USD m.* <strong>2002</strong> 2001 in % 2001 Mar 02<br />
Number of trucks and buses<br />
delivered<br />
European operations 8,961 9,933 -10 40,626 39,654<br />
Latin American operations 1,079 1,794 -40 7,705 6,990<br />
Total Scania vehicles delivered 10,040 11,727 -14 48,331 46,644<br />
Sales<br />
European operations 980 10,127 10,101 0 42,496 42,522<br />
Latin American operations 108 1,114 1,260 -12 5,806 5,660<br />
Less intra-Group sales -19 -194 -279 -30 -1,089 -1,004<br />
Total Scania products 1,069 11,047 11,082 0 47,213 47,178<br />
Car operations 5 139 1,440 1,323 9 5,852 5,969<br />
Scania Group total 1,208 12,487 12,405 1 53,065 53,147<br />
Operating income<br />
European operations 121 1,247 1,520 -18 5,031 4,758<br />
Latin American operations -6 -58 -36 61 -581 -603<br />
Customer finance operations 8 81 70 16 278 289<br />
Research and development expenses -38 -392 -485 -19 -1,955 -1,862<br />
Corporate costs -15 -154 -126 22 -417 -445<br />
Total Scania products 70 724 943 -23 2,356 2,137<br />
Car operations 6 4 46 9 111 148<br />
Scania Group total 74 770 952 -19 2,467 2,285<br />
Operating margin in percent<br />
European operations 12.3 15.0 11.8 11.2<br />
Latin American operations -5.2 -2.9 -10.0 -10.7<br />
Total Scania products 6.6 8.5 5.0 4.5<br />
Car operations 3.2 0.7 1.9 2.5<br />
Scania Group total 6.2 7.7 4.6 4.3<br />
5 Sales include the wholly owned portion of the Swedish dealership network for Svenska Volkswagen products, Din Bil,<br />
plus a car dealership network in Finland and Switzerland. Sales of Svenska Volkswagen products totalled SEK 1,146<br />
m.<br />
6 Aside from wholly-owned businesses, this included operating income from the half-owned importing business Svenska<br />
Volkswagen Group.<br />
* Translated solely for the convenience of the reader at a closing exchange rate of SEK 10.3375 = USD 1.00.<br />
7
Sales by product category<br />
<strong>SCANIA</strong> <strong>INTERIM</strong> <strong>REPORT</strong> - <strong>JANUARY</strong>- <strong>MARCH</strong> <strong>2002</strong><br />
Amounts in SEK m.<br />
First quarter Change<br />
Apr 01-<br />
unless otherwise stated USD m.* <strong>2002</strong> 2001 in % 2001 Mar 02<br />
Trucks 611 6,313 7,134 -12 29,139 28,318<br />
Buses 102 1,051 850 24 4,701 4,902<br />
Engines 10 99 104 -5 608 603<br />
Service-related products 259 2,681 2,465 9 10,279 10,495<br />
Used vehicles etc. 104 1,078 901 20 4,370 4,547<br />
Revenue deferral -17 -175 -372 -1,884 -1,687<br />
Total Scania products 1,069 11,047 11,082 0 47,213 47,178<br />
Car operations 139 1,440 1,323 9 5,852 5,969<br />
Total 1,208 12,487 12,405 1 53,065 53,147<br />
7<br />
Refers to the difference between sales recognised as revenues and sales value based on deliveries.<br />
* Translated solely for the convenience of the reader at a closing exchange rate of SEK 10.3375 = USD 1.00.<br />
8
<strong>SCANIA</strong> <strong>INTERIM</strong> <strong>REPORT</strong> - <strong>JANUARY</strong>- <strong>MARCH</strong> <strong>2002</strong><br />
Income statement<br />
Amounts in SEK m.<br />
First quarter Change<br />
Apr 01-<br />
unless otherwise stated USD m.* <strong>2002</strong> 2001 in % 2001 Mar 02<br />
Sales 9 1,208 12,487 12,405 1 53,065 53,147<br />
Cost of goods sold -953 -9,855 -9,588 3 -42,601 -42,868<br />
Gross income 9 255 2,632 2,817 -7 10,464 10,279<br />
Research and development<br />
expenses -38 -392 -485 -19 -1,955 -1,862<br />
Selling expenses 9,10 -132 -1,368 -1,256 9 -5,594 -5,706<br />
Administrative expenses 11 -23 -229 -200 15 -785 -814<br />
Income from customer finance<br />
operations 8 81 70 16 278 289<br />
Share of income of associated<br />
companies 4 46 6 59 99<br />
Operating income 8, 9 74 770 952 -19 2,467 2,285<br />
Financial revenues and<br />
expenses -20 -206 -133 -926 -999<br />
Income after financial items 54 564 819 -31 1,541 1,286<br />
Taxes -17 -180 -246 -27 -496 -430<br />
Minority interests 0 -1 0 3 2<br />
Net income 37 383 573 -33 1,048 858<br />
Number of shares: 200 million<br />
Operating margin, percent 6.2 7.7 4.6<br />
Return on equity, percent 5.4 20.2 6.5<br />
Return on capital employed,<br />
excluding customer finance<br />
operations, percent 7.9 18.6 8.4<br />
Return on capital employed,<br />
percent 5.2 12.3 5.6<br />
Earnings per share, SEK 1.92 2.87 5.24<br />
8 Includes depreciation of -574 -530 -2,157<br />
9 Acquired and divested companies increased “Sales” by SEK 29 m., decreased “Gross income” by SEK 17 m., and<br />
increased “Selling expenses” by SEK 31 m. “Operating income” was negatively impacted by SEK 48 m.<br />
10 Selling expenses: Defined as sales-related expenses, including goodwill amortisation, in commercial companies<br />
and costs of central commercial-related resources.<br />
11 Administrative expenses: Defined as Group-wide costs for management and for the staff units in European and<br />
Latin American operations.<br />
* Translated solely for the convenience of the reader at a closing exchange rate of SEK 10.3375 = USD 1.00.<br />
9
<strong>SCANIA</strong> <strong>INTERIM</strong> <strong>REPORT</strong> - <strong>JANUARY</strong>- <strong>MARCH</strong> <strong>2002</strong><br />
Earnings by quarter<br />
Amounts in SEK m.<br />
<strong>2002</strong> 2001<br />
unless otherwise stated USD m.* Q1 Full year Q4 Q3 Q2 Q1<br />
Sales<br />
European operations 980 10,127 42,496 12,304 9,182 10,909 10,101<br />
Latin American operations 108 1,114 5,806 1,589 1,387 1,570 1,260<br />
Less intra-Group sales -19 -194 -1,089 -259 -275 -276 -279<br />
Total Scania products 1,069 11,047 47,213 13,634 10,294 12,203 11,082<br />
Car operations 139 1,440 5,852 1,531 1,413 1,585 1,323<br />
Scania Group total 1,208 12,487 53,065 15,165 11,707 13,788 12,405<br />
Operating income<br />
European operations 121 1,247 5,031 1,385 914 1,212 1,520<br />
Latin American operations -6 -58 -581 -380 -118 -47 -36<br />
Customer finance operations 8 81 278 55 81 72 70<br />
Research and development expenses -38 -392 -1,955 -548 -401 -521 -485<br />
Corporate costs -15 -154 -417 -80 -92 -119 -126<br />
Total Scania products 70 724 2,356 432 384 597 943<br />
Car operations 4 46 111 31 18 53 9<br />
Scania Group total 74 770 2,467 463 402 650 952<br />
Financial items -20 -206 -926 -446 -104 -243 -133<br />
Income after financial items 54 564 1,541 17 298 407 819<br />
Net income 37 383 1,048 11 199 265 573<br />
Earnings per share, SEK 0.19 1.92 5.24 0.05 0.99 1.33 2.87<br />
Operating margin, percent<br />
European operations 12.3 11.8 11.3 10.0 11.1 15.0<br />
Latin American operations -5.2 -10.0 -23.9 -8.5 -3.0 -2.9<br />
Total Scania products 6.6 5.0 3.2 3.7 4.9 8.5<br />
Car operations 3.2 1.9 2.0 1.3 3.3 0.7<br />
Scania Group total 6.2 4.6 3.1 3.4 4.7 7.7<br />
10
<strong>SCANIA</strong> <strong>INTERIM</strong> <strong>REPORT</strong> - <strong>JANUARY</strong>- <strong>MARCH</strong> <strong>2002</strong><br />
* Translated solely for the convenience of the reader at a closing exchange rate of SEK 10.3375 = USD 1.00.<br />
11
<strong>SCANIA</strong> <strong>INTERIM</strong> <strong>REPORT</strong> - <strong>JANUARY</strong>- <strong>MARCH</strong> <strong>2002</strong><br />
Units by quarter<br />
<strong>2002</strong> 2001<br />
Q1 Full year Q4 Q3 Q2 Q1<br />
Order bookings, trucks<br />
Western Europe 8,254 30,158 8,046 6,105 8,125 7,882<br />
Central and eastern Europe 836 2,825 713 731 770 611<br />
Latin America 698 6,222 1,420 1,400 1,657 1,745<br />
Asia 1,090 3,324 975 478 960 911<br />
Other markets 482 1,388 367 225 391 405<br />
Total 11,360 43,917 11,521 8,939 11,903 11,554<br />
Trucks delivered<br />
Western Europe 6,980 30,416 7,872 6,353 8,205 7,986<br />
Central and eastern Europe 477 2,579 964 526 652 437<br />
Latin America 786 6,181 1,507 1,354 1,811 1,509<br />
Asia 638 2,994 972 607 771 644<br />
Other markets 251 1,489 452 326 394 317<br />
Total 9,132 43,659 11,767 9,166 11,833 10,893<br />
Order bookings, buses<br />
Europe 675 1,613 501 320 394 398<br />
Latin America 359 1,522 143 356 645 378<br />
Other markets 341 1,667 670 372 386 239<br />
Total 1,375 4,802 1,314 1,048 1,425 1,015<br />
Buses delivered<br />
Europe 402 1,828 563 356 535 374<br />
Latin America 294 1,595 378 508 424 285<br />
Other markets 212 1,249 458 314 302 175<br />
Total 908 4,672 1,399 1,178 1,261 834<br />
12
<strong>SCANIA</strong> <strong>INTERIM</strong> <strong>REPORT</strong> - <strong>JANUARY</strong>- <strong>MARCH</strong> <strong>2002</strong><br />
Balance sheet<br />
With customer finance operations reported according to the equity accounting method<br />
Amounts in SEK m.<br />
<strong>2002</strong> 2001<br />
unless otherwise stated USD m.* 31 Mar 31 Dec 30 Sep 30 Jun 31 Mar<br />
ASSETS<br />
Intangible fixed assets 150 1,549 1,364 1,267 1,083 1,199<br />
Tangible fixed assets 2,388 24,689 25,695 26,265 25,803 25,043<br />
Shares and participations 330 3,415 3,287 3,030 2,795 2,716<br />
Inventories 808 8,352 7,880 8,660 8,844 9,225<br />
Other receivables 1,038 10,729 11,016 11,865 12,298 11,612<br />
Interest-bearing receivables 166 1,712 1,773 1,671 1,736 1,721<br />
Liquid investments 362 3,743 3,931 2,828 3,222 2,882<br />
Total assets 5,242 54,189 54,946 55,586 55,781 54,398<br />
SHAREHOLDERS’ EQUITY<br />
AND LIABILITIES<br />
Shareholders’ equity 1,526 15,776 15,995 16,116 15,792 16,450<br />
Provisions for pensions 210 2,174 2,087 2,010 1,937 1,921<br />
Other provisions 338 3,488 3,670 3,329 3,364 3,182<br />
Other liabilities 2,066 21,354 21,473 23,128 22,152 21,725<br />
Borrowings 1,102 11,397 11,721 11,003 12,536 11,120<br />
Total shareholders’ equity<br />
and liabilities 5,242 54,189 54,946 55,586 55,781 54,398<br />
Net indebtedness, excluding<br />
provisions for pensions 740 7,654 7,790 8,175 9,314 8,238<br />
Debt/equity ratio 0.49 0.49 0.51 0.59 0.50<br />
Equity per share, SEK 7.63 78.88 79.98 80.58 78.96 82.25<br />
* Translated solely for the convenience of the reader at a closing exchange rate of SEK 10.3375 = USD 1.00.<br />
13
Balance sheet<br />
Customer finance operations<br />
<strong>SCANIA</strong> <strong>INTERIM</strong> <strong>REPORT</strong> - <strong>JANUARY</strong>- <strong>MARCH</strong> <strong>2002</strong><br />
Amounts in SEK m.<br />
<strong>2002</strong> 2001<br />
unless otherwise stated USD m.* 31 Mar 31 Dec 30 Sep 30 Jun 31 Mar<br />
ASSETS<br />
Lease assets 866 8,948 9,894 10,146 9,865 9,644<br />
Financial receivables 1,499 15,499 15,197 14,798 13,894 13,117<br />
Other assets 65 675 987 670 739 516<br />
Liquid investments 16 163 176 272 128 426<br />
Total assets 2,446 25,285 26,254 25,886 24,626 23,703<br />
SHAREHOLDERS’ EQUITY<br />
AND LIABILITIES<br />
Shareholders’ equity 255 2,635 2,492 2,260 2,064 1,967<br />
Borrowings 1,997 20,643 21,691 21,596 20,487 20,078<br />
Other liabilities and provisions 194 2,007 2,071 2,030 2,075 1,658<br />
Total shareholders’ equity<br />
and liabilities 2,446 25,285 26,254 25,886 24,626 23,703<br />
Balance sheet<br />
Including customer finance operations<br />
Amounts in SEK m.<br />
<strong>2002</strong> 2001<br />
unless otherwise stated USD m.* 31 Mar 31 Dec 30 Sep 30 Jun 31 Mar<br />
ASSETS<br />
Intangible fixed assets 150 1,549 1,364 1,267 1,083 1,199<br />
Tangible fixed assets 2,391 24,716 25,714 26,290 25,828 25,058<br />
Shares and participations 75 780 795 770 732 750<br />
Inventories 816 8,431 7,946 8,719 8,902 9,319<br />
Other receivables 1,067 11,031 11,544 12,008 12,272 11,685<br />
Interest-bearing receivables 1,626 16,812 16,969 16,470 15,630 14,816<br />
Liquid investments 378 3,906 4,107 3,100 3,350 3,307<br />
Total assets 6,503 67,225 68,439 68,624 67,797 66,134<br />
SHAREHOLDERS’ EQUITY<br />
AND LIABILITIES<br />
Shareholders’ equity 1,526 15,776 15,995 16,116 15,792 16,450<br />
Provisions for pensions 211 2,179 2,092 2,014 1,941 1,922<br />
Other provisions 422 4,366 4,575 4,137 4,124 3,892<br />
Other liabilities 1,245 12,863 12,365 13,758 12,917 12,672<br />
Borrowings 3,099 32,041 33,412 32,599 33,023 31,198<br />
Total shareholders’ equity<br />
and liabilities 6,503 67,225 68,439 68,624 67,797 66,134<br />
Equity/assets ratio, % 23,5 23.4 23.5 23.3 24.9<br />
* Translated solely for the convenience of the reader at a closing exchange rate of SEK 10.3375 = USD 1.00.<br />
14
<strong>SCANIA</strong> <strong>INTERIM</strong> <strong>REPORT</strong> - <strong>JANUARY</strong>- <strong>MARCH</strong> <strong>2002</strong><br />
Statement of changes in shareholders’ equity<br />
Amounts in SEK m.<br />
31 Mar<br />
unless otherwise stated USD m.* <strong>2002</strong> 2001<br />
Shareholders’ equity, 1 January 1,547 15,995 15,698<br />
Translation differences -58 -602 179<br />
Net income for the period 37 383 573<br />
Dividends to shareholders 0 0 0<br />
Shareholders’ equity, 31 March 1,526 15,776 16,450<br />
* Translated solely for the convenience of the reader at a closing exchange rate of SEK 10.3375 = USD 1.00.<br />
15
Statement of cash flow<br />
<strong>SCANIA</strong> <strong>INTERIM</strong> <strong>REPORT</strong> - <strong>JANUARY</strong>- <strong>MARCH</strong> <strong>2002</strong><br />
Amounts in SEK m.<br />
<strong>2002</strong> 2001<br />
unless otherwise stated USD m.* Q1 Q4 Q3 Q 2 Q1<br />
Cash from operating activities 93 960 499 628 622 1,229<br />
Change in working capital etc. -33 -341 636 1,127 371 -239<br />
Cash flow from operating activities 60 619 1,135 1,755 993 990<br />
Net investments excluding acquisitions/<br />
divestments of companies -47 -489 -516 -464 -479 -419<br />
Cash flow before acquisitions/divestments<br />
of companies 13 130 619 1,291 514 571<br />
Net investment through acquisitions/divestments<br />
of companies -13 -129 -32 -11 -27 -859<br />
Cash flow excluding customer<br />
finance operations 0 1 587 1,280 487 -288<br />
Expansion in customer finance operations 12 14 147 -767 -416 -503 -742<br />
Change in net indebtedness including<br />
customer finance operations 14 148 -180 864 -16 -1,030<br />
Change in indebtedness through<br />
financing activities -27 -281 1,219 -1,098 1,387 611<br />
Dividend to shareholders 0 0 0 0 -1,400 0<br />
Net change in liquid assets and short-term<br />
investments -13 -133 1,039 -234 -29 -419<br />
Effect of exchange rate fluctuations on liquid<br />
assets and short-term investments -6 -68 -32 -16 72 145<br />
Liquid assets and short-term investments at<br />
beginning of period 397 4,107 3,100 3,350 3,307 3,581<br />
Liquid assets and short-term investments at<br />
end of period 378 3,906 4,107 3,100 3,350 3,307<br />
12<br />
Including allocated acquisition value of the customer finance operations of Beers.<br />
* Translated solely for the convenience of the reader at a closing exchange rate of SEK 10.3375 = USD 1.00.<br />
16
<strong>SCANIA</strong> YEAR-END <strong>REPORT</strong> - <strong>JANUARY</strong>- <strong>MARCH</strong> <strong>2002</strong><br />
Number of employees<br />
<strong>2002</strong> 2001<br />
31 Mar 31 Dec 30 Sep 30 Jun 31 Mar<br />
Production companies 13,715 13,321 13,587 13,698 13,963<br />
Commercial companies 10,655 10,583 10,499 10,478 10,428<br />
European operations 24,370 23,904 24,086 24,176 24,391<br />
Latin American operations 4,014 4,199 4,269 4,246 4,160<br />
Customer finance operations 235 239 235 230 219<br />
Total number of employees 28,619 28,342 28,590 28,652 28,770<br />
17


