Scania Year-end Report January-December 2009
Scania Year-end Report January-December 2009
Scania Year-end Report January-December 2009
You also want an ePaper? Increase the reach of your titles
YUMPU automatically turns print PDFs into web optimized ePapers that Google loves.
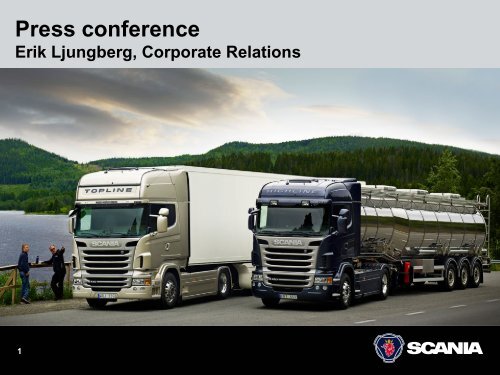
Press conference<br />
Erik Ljungberg, Corporate Relations<br />
1
<strong>Year</strong>-<strong>end</strong> <strong>Report</strong> <strong>January</strong>-<strong>December</strong> <strong>2009</strong><br />
Jan Ytterberg, CFO<br />
2
<strong>2009</strong> – highlights<br />
• Positive operating income despite sharp volume<br />
decrease<br />
– Low capacity utilisation<br />
– Positive effects from cost reduction<br />
– Increased bad debt in Financial Services<br />
• Cash flow of SEK 5,512 m. (Vehicles & Services)<br />
– Successful working capital reduction<br />
3
Volume tr<strong>end</strong><br />
Total deliveries, trucks and buses<br />
• Deliveries -41%<br />
<strong>2009</strong><br />
• Sizeable inventory<br />
reduction<br />
• Higher sequential<br />
production rate in<br />
H2 <strong>2009</strong><br />
Units<br />
24,000<br />
20,000<br />
16,000<br />
12,000<br />
8,000<br />
4,000<br />
0<br />
Q1 Q2Q3Q4<br />
2005<br />
Q1 Q2Q3Q4 Q1 Q2 Q3 Q4 Q1Q2 Q3Q4 Q1 Q2 Q3Q4<br />
2006 2007 2008 <strong>2009</strong><br />
4
Service revenue<br />
• Lower transport<br />
demand<br />
• Volume<br />
decrease ~10%<br />
• Positive impact<br />
from currency<br />
SEK m.<br />
5,000<br />
4,000<br />
3,000<br />
2,000<br />
1,000<br />
0<br />
Q1 Q2Q3Q4<br />
2005<br />
Q1 Q2Q3Q4 Q1 Q2 Q3 Q4 Q1Q2 Q3Q4 Q1 Q2 Q3Q4<br />
2006 2007 2008 <strong>2009</strong><br />
5
Earnings tr<strong>end</strong><br />
Operating income, <strong>Scania</strong> Group<br />
• Net sales -30%<br />
<strong>2009</strong><br />
• EBIT -80% <strong>2009</strong><br />
SEK m.<br />
4,500<br />
4,000<br />
3,500<br />
3,000<br />
2,500<br />
2,000<br />
1,500<br />
1,000<br />
500<br />
0<br />
Q1 Q2Q3Q4<br />
2005<br />
Q1 Q2Q3Q4 Q1 Q2 Q3 Q4 Q1Q2 Q3Q4 Q1 Q2 Q3Q4<br />
2006 2007 2008 <strong>2009</strong><br />
6
Operating income<br />
Vehicles & Services<br />
• EBIT decrease due to:<br />
– Lower volume<br />
– Capacity utilisation<br />
– Price<br />
• Positive impact:<br />
– Cost reduction<br />
EBIT decrease:<br />
SEK 9,450 m.<br />
<strong>2009</strong><br />
+ Cost<br />
- Volume<br />
- Capacity<br />
- Price<br />
7
Activity/Cost reduction<br />
Volume decrease<br />
<strong>2009</strong><br />
Service<br />
Network<br />
Production<br />
Units<br />
R&D, Admin<br />
& Other<br />
~10%<br />
~55%<br />
Reduction of cost<br />
<strong>2009</strong> (adjusted for<br />
currency)<br />
>10%<br />
>20%<br />
>30%<br />
8
Cash flow<br />
Vehicles & Services<br />
• Inventory reduction<br />
completed<br />
SEK m.<br />
4,000<br />
3,000<br />
• Lower investments 2,000<br />
1,000<br />
0<br />
Q1 Q2Q3Q4<br />
2005<br />
-1,000<br />
Q1 Q2Q3Q4 Q1Q2 Q3 Q4 Q1Q2 Q3<br />
Q4<br />
Q1 Q2Q3 Q4<br />
2006 2007 2008 <strong>2009</strong><br />
-2,000<br />
Note: Excluding acquisitions/divestments and Financial Services<br />
9
Net debt<br />
Vehicles & Services<br />
• Net debt SEK<br />
4,038 m. (8,364<br />
<strong>end</strong> of 2008)<br />
• Divid<strong>end</strong><br />
payment SEK<br />
2 bn in Q2<br />
• Rated A- by<br />
S&P,<br />
confirmed in<br />
Aug <strong>2009</strong><br />
SEK m.<br />
Percent<br />
10,000<br />
70<br />
Net debt Net debt/equity ratio<br />
60<br />
8,000<br />
50<br />
6,000<br />
40<br />
4,000<br />
30<br />
2,000<br />
20<br />
2006 2007<br />
10<br />
0<br />
1999 2000 2001 2002 2003 2004 2005<br />
2008 <strong>2009</strong><br />
0<br />
-2,000<br />
-10<br />
-4,000<br />
-20<br />
-6,000 -30<br />
10
Volume tr<strong>end</strong><br />
Credit portfolio, Financial Services<br />
• Portfolio -12%,<br />
local currencies<br />
• Increased bad debt<br />
provisions<br />
• Increased<br />
repossessions<br />
• High level of<br />
SEK m.<br />
50,000<br />
45,000<br />
40,000<br />
35,000<br />
30,000<br />
25,000<br />
20,000<br />
15,000<br />
10,000<br />
5,000<br />
rescheduling 0<br />
1997 1998 1999 2000 2001 2002 2003 2004 2005 2006 2007 2008 <strong>2009</strong><br />
11
Summary<br />
• Lower volume and low capacity utilisation<br />
impacted profitability<br />
• Positive effects from cost reduction<br />
• Positive cash flow tr<strong>end</strong><br />
• Improved net debt position compared to year<strong>end</strong><br />
2008<br />
12
Outlook<br />
Leif Östling, President and CEO<br />
14
Market tr<strong>end</strong>s<br />
• Low economic activity in Europe<br />
• Good economic tr<strong>end</strong> in Latin America<br />
• Recovery in some segments in Asia<br />
15
European truck demand<br />
Units<br />
20,000<br />
18,000<br />
16,000<br />
14,000<br />
12,000<br />
10,000<br />
8,000<br />
6,000<br />
4,000<br />
2,000<br />
<strong>Scania</strong> orders<br />
<strong>Scania</strong> deliveries<br />
0<br />
1996<br />
1997<br />
1998 1999 2000 2001 2002 2003 2004 2005 2006 2007 2008 <strong>2009</strong><br />
16
Latin American truck demand<br />
Units<br />
5,000<br />
4,000<br />
<strong>Scania</strong> orders<br />
<strong>Scania</strong> deliveries<br />
3,000<br />
2,000<br />
1,000<br />
0<br />
1996 1997 1998 1999 2000 2001 2002 2003 2004 2005 2006 2007 2008 <strong>2009</strong><br />
-1,000<br />
17
Service tr<strong>end</strong><br />
• Limiting drop in<br />
Group earnings<br />
SEK m.<br />
5,000<br />
• Stable margins<br />
4,000<br />
• Lower demand in<br />
Europe, stable in<br />
Latin America and<br />
Asia<br />
3,000<br />
2,000<br />
1,000<br />
• Capacity adjusted<br />
to demand level<br />
0<br />
Q1 Q2Q3Q4<br />
2005<br />
Q1 Q2Q3Q4 Q1 Q2 Q3 Q4 Q1Q2 Q3Q4 Q1 Q2 Q3Q4<br />
2006 2007 2008 <strong>2009</strong><br />
18
Improved service to customers<br />
• Repairs and parts<br />
for trailers, superstructures<br />
&<br />
buses<br />
• New facility in<br />
Kazakhstan, hub<br />
in central Asia<br />
• Efficiency<br />
programme<br />
19
New R-series<br />
• Better fuel<br />
economy<br />
• Improved driver<br />
environment<br />
• <strong>Scania</strong> Driver<br />
Support<br />
• Awarded<br />
“International<br />
Truck of the<br />
<strong>Year</strong>”<br />
20
<strong>Scania</strong> Touring<br />
• Partnership<br />
with Chinese<br />
bus builder<br />
Higer<br />
• Quality product<br />
& cost-effective<br />
production<br />
• Expand<br />
services of<br />
buses<br />
21
Engines<br />
• Substantial<br />
agreement with<br />
Terex<br />
• Leading USbased<br />
supplier<br />
of construction<br />
and industrial<br />
equipment<br />
• Key element to<br />
increase sales<br />
to OEMs<br />
22
Positioned for profitability and growth<br />
• Training at production units platform for<br />
efficiency improvements<br />
• More efficient cost structure<br />
• Strengthened product portfolio<br />
23


