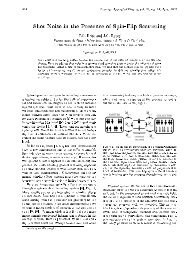
140 J. C. Krause and C. Paduani Figure 3. 3d PDOS for the Cr (a) and Mn (b) impurities at the FeI site (c) the pure host PDOS. The partial density <strong>of</strong> states (PDOS) are shown <strong>in</strong> gs. 2-7, for both FeI and FeII central sites. They are broadened by a Lorentzian prole, accord<strong>in</strong>g to the energy precision <strong>of</strong> the calculations, <strong>in</strong> order to obta<strong>in</strong> a cont<strong>in</strong>uum. No signicant change <strong>of</strong> structure was observed throughout this series for the conduction band, which have similar shapes to that <strong>of</strong> pure 0 ; Fe 4 N . The host 3d PDOS is shown <strong>in</strong> Fig. 3c, for comparison. The structure <strong>of</strong> t 2g-like peaks <strong>of</strong> the host is drastically reduced, for those impurities atoms at the left <strong>of</strong> iron <strong>in</strong> the periodic table. This reects the opposite orientation <strong>of</strong> their magnetic moments, relative to the pure host. Figs. 2a-2c show the 3d PDOS at FeI site for Sc, Ti and V. No signicant change <strong>of</strong> structure was observed throughout this series. In these diagrams one can see how the sp<strong>in</strong>-down states are be<strong>in</strong>g <strong>in</strong>creas<strong>in</strong>gly lled up by the <strong>in</strong>com<strong>in</strong>g d electrons, thus <strong>in</strong>creas<strong>in</strong>g the value, which is negative. For the Cr atom (Fig. 3a), the additional d electron is almost entirely located <strong>in</strong> the sp<strong>in</strong>-down band, which <strong>in</strong>creases the value. The 3d PDOS shows a resonant peak just on the Fermi energy (E F ), <strong>in</strong> the sp<strong>in</strong>-down band, besides a very pronounced peak for sp<strong>in</strong>-up electrons. Nevertheless, the <strong>in</strong>com<strong>in</strong>g d electron <strong>of</strong> Mn prefers the sp<strong>in</strong>-down states, <strong>in</strong>creas<strong>in</strong>g aga<strong>in</strong> the local moment, which <strong>in</strong>turnachieves its maximum. Fig.3bshows for the Mn atom two e g -like peaks just above E F , for the sp<strong>in</strong>-down virtual bound states, and a very pronounced peak for sp<strong>in</strong>-up states. For the pure host, Fig. 3c displays a full lled 3d band for sp<strong>in</strong>-up states. This reverses the sign <strong>of</strong> the local moment. The additional d electron <strong>of</strong> Co is partially located <strong>in</strong> the sp<strong>in</strong>-down band and thereby decreas<strong>in</strong>g (Fig. 4a). For the Ni atom, the next d electron occupies the sp<strong>in</strong>-down band, decreas<strong>in</strong>g aga<strong>in</strong> (Fig. 4b). Note the large peak just over E F for Ni, <strong>in</strong> the sp<strong>in</strong>down band, where is the only possible occupation for the next d electron <strong>of</strong> Cu. One feature depicted from these diagrams is the accumulation <strong>of</strong> the d states near the Fermi surface, leav<strong>in</strong>g empty the bottom <strong>of</strong> the d band.
Brazilian Journal <strong>of</strong> Physics, vol. 27, no. 2, june, 1997 141 Figure 4. 3d PDOS for the Co (a), Ni (b) and Cu (c) impurities at the FeI site. Figure 5. 3d PDOS for the Sc (a), Ti (b) and V (c) impurities at the FeII site.