Electronic Structure of Substitutional 3D Impurities in $\gamma
Electronic Structure of Substitutional 3D Impurities in $\gamma
Electronic Structure of Substitutional 3D Impurities in $\gamma

Create successful ePaper yourself
Turn your PDF publications into a flip-book with our unique Google optimized e-Paper software.
140 J. C. Krause and C. Paduani<br />
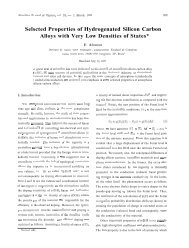
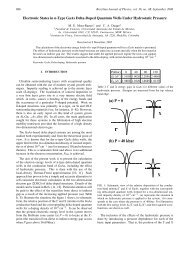
Figure 3. 3d PDOS for the Cr (a) and Mn (b) impurities at the FeI site (c) the pure host PDOS.<br />
The partial density <strong>of</strong> states (PDOS) are shown <strong>in</strong><br />
gs. 2-7, for both FeI and FeII central sites. They are<br />
broadened by a Lorentzian prole, accord<strong>in</strong>g to the energy<br />
precision <strong>of</strong> the calculations, <strong>in</strong> order to obta<strong>in</strong> a<br />
cont<strong>in</strong>uum. No signicant change <strong>of</strong> structure was observed<br />
throughout this series for the conduction band,<br />
which have similar shapes to that <strong>of</strong> pure 0 ; Fe 4 N .<br />
The host 3d PDOS is shown <strong>in</strong> Fig. 3c, for comparison.<br />
The structure <strong>of</strong> t 2g-like peaks <strong>of</strong> the host is drastically<br />
reduced, for those impurities atoms at the left <strong>of</strong> iron<br />
<strong>in</strong> the periodic table. This reects the opposite orientation<br />
<strong>of</strong> their magnetic moments, relative to the pure<br />
host.<br />
Figs. 2a-2c show the 3d PDOS at FeI site for Sc, Ti<br />
and V. No signicant change <strong>of</strong> structure was observed<br />
throughout this series. In these diagrams one can see<br />
how the sp<strong>in</strong>-down states are be<strong>in</strong>g <strong>in</strong>creas<strong>in</strong>gly lled<br />
up by the <strong>in</strong>com<strong>in</strong>g d electrons, thus <strong>in</strong>creas<strong>in</strong>g the <br />
value, which is negative. For the Cr atom (Fig. 3a), the<br />
additional d electron is almost entirely located <strong>in</strong> the<br />
sp<strong>in</strong>-down band, which <strong>in</strong>creases the value. The 3d<br />
PDOS shows a resonant peak just on the Fermi energy<br />
(E F ), <strong>in</strong> the sp<strong>in</strong>-down band, besides a very pronounced<br />
peak for sp<strong>in</strong>-up electrons. Nevertheless, the <strong>in</strong>com<strong>in</strong>g<br />
d electron <strong>of</strong> Mn prefers the sp<strong>in</strong>-down states, <strong>in</strong>creas<strong>in</strong>g<br />
aga<strong>in</strong> the local moment, which <strong>in</strong>turnachieves its<br />
maximum. Fig.3bshows for the Mn atom two e g -like<br />
peaks just above E F , for the sp<strong>in</strong>-down virtual bound<br />
states, and a very pronounced peak for sp<strong>in</strong>-up states.<br />
For the pure host, Fig. 3c displays a full lled 3d band<br />
for sp<strong>in</strong>-up states. This reverses the sign <strong>of</strong> the local<br />
moment. The additional d electron <strong>of</strong> Co is partially<br />
located <strong>in</strong> the sp<strong>in</strong>-down band and thereby decreas<strong>in</strong>g<br />
(Fig. 4a). For the Ni atom, the next d electron occupies<br />
the sp<strong>in</strong>-down band, decreas<strong>in</strong>g aga<strong>in</strong> (Fig. 4b).<br />
Note the large peak just over E F for Ni, <strong>in</strong> the sp<strong>in</strong>down<br />
band, where is the only possible occupation for<br />
the next d electron <strong>of</strong> Cu. One feature depicted from<br />
these diagrams is the accumulation <strong>of</strong> the d states near<br />
the Fermi surface, leav<strong>in</strong>g empty the bottom <strong>of</strong> the d<br />
band.