Supporting Documents (Data and Analysis) - Satellite Beach
Supporting Documents (Data and Analysis) - Satellite Beach
Supporting Documents (Data and Analysis) - Satellite Beach

You also want an ePaper? Increase the reach of your titles
YUMPU automatically turns print PDFs into web optimized ePapers that Google loves.
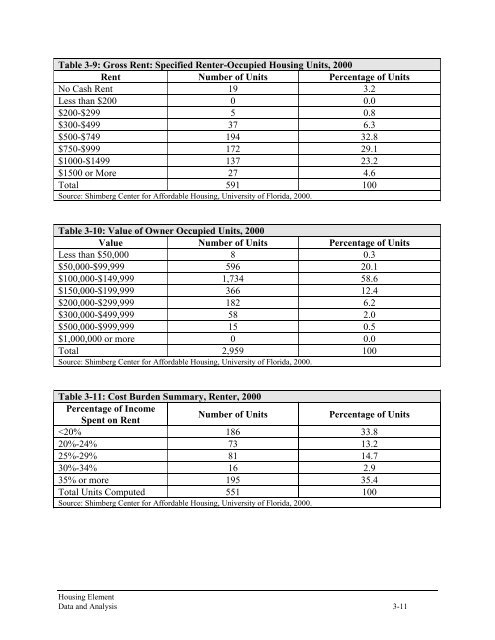
Table 3-9: Gross Rent: Specified Renter-Occupied Housing Units, 2000<br />
Rent Number of Units Percentage of Units<br />
No Cash Rent 19 3.2<br />
Less than $200 0 0.0<br />
$200-$299 5 0.8<br />
$300-$499 37 6.3<br />
$500-$749 194 32.8<br />
$750-$999 172 29.1<br />
$1000-$1499 137 23.2<br />
$1500 or More 27 4.6<br />
Total 591 100<br />
Source: Shimberg Center for Affordable Housing, University of Florida, 2000.<br />
Table 3-10: Value of Owner Occupied Units, 2000<br />
Value Number of Units Percentage of Units<br />
Less than $50,000 8 0.3<br />
$50,000-$99,999 596 20.1<br />
$100,000-$149,999 1,734 58.6<br />
$150,000-$199,999 366 12.4<br />
$200,000-$299,999 182 6.2<br />
$300,000-$499,999 58 2.0<br />
$500,000-$999,999 15 0.5<br />
$1,000,000 or more 0 0.0<br />
Total 2,959 100<br />
Source: Shimberg Center for Affordable Housing, University of Florida, 2000.<br />
Table 3-11: Cost Burden Summary, Renter, 2000<br />
Percentage of Income<br />
Spent on Rent<br />
Number of Units<br />
Percentage of Units<br />