2005 NALL REPORT - Aircraft Owners and Pilots Association
2005 NALL REPORT - Aircraft Owners and Pilots Association
2005 NALL REPORT - Aircraft Owners and Pilots Association
Create successful ePaper yourself
Turn your PDF publications into a flip-book with our unique Google optimized e-Paper software.
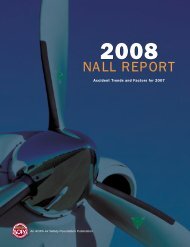
<strong>2005</strong> <strong>NALL</strong> <strong>REPORT</strong><br />
Accident Trends <strong>and</strong> Factors for 2004<br />
AOPA AIR SAFETY<br />
FOUNDATION
Dedication<br />
The Joseph T. Nall Report is the<br />
AOPA Air Safety Foundation’s<br />
annual review of general aviation<br />
aircraft accidents that occurred<br />
during the previous year. The<br />
report is dedicated to the<br />
memory of Joe Nall, an NTSB<br />
Board member who died as a<br />
passenger in an airplane accident<br />
in Caracas, Venezuela,<br />
in 1989.<br />
Final vs. Preliminary Statistics<br />
This report is based on NTSB reports of accidents involving<br />
fixed-wing general aviation aircraft weighing 12,500<br />
pounds or less. To provide the pilot community with the<br />
most current safety information, ASF gathered NTSB data<br />
on 2004 accidents throughout <strong>2005</strong>. By November<br />
<strong>2005</strong>, the NTSB had finalized 82.8 percent of the year<br />
2004 reports. The remaining 17.2 percent contained<br />
preliminary data.<br />
Prior year comparisons suggest that this mix of preliminary<br />
<strong>and</strong> final data will not significantly change the<br />
conclusions presented here when all final reports are<br />
analyzed.<br />
As a supplement to the information contained in this<br />
report, ASF now offers its accident database online. You<br />
may search the database by selecting specific criteria.<br />
To view the database, visit www.asf.org/database.<br />
The AOPA Air Safety Foundation gratefully acknowledges<br />
the technical support <strong>and</strong> assistance of:<br />
National Transportation Safety Board<br />
Federal Aviation Administration<br />
<strong>Aircraft</strong> <strong>Owners</strong> <strong>and</strong> <strong>Pilots</strong> <strong>Association</strong><br />
Financial support for the Nall Report comes from the<br />
Emil Buehler Trust <strong>and</strong> pilot donors to the AOPA Air Safety<br />
Foundation.<br />
Publisher: Bruce L<strong>and</strong>sberg<br />
Statistician: Kristen Hummel<br />
Writer: Neil C. Krey<br />
Editors: Kristen Hummel, Kevin D. Murphy, David Wright<br />
Art Director: Chris Rose<br />
© Copyright 2006 AOPA Air Safety Foundation
Table of Contents<br />
Overview of 2004 Accident Trends <strong>and</strong> Factors...........................................................2<br />
Accident Analysis........................................................................................................2<br />
Accident Trends.............................................................................................................2<br />
Accident Causes...........................................................................................................2<br />
Accident Category..........................................................................................................3<br />
Pilot-Related Accidents..................................................................................................3<br />
Type of Operation..........................................................................................................3<br />
Emergency Phase of Flight..............................................................................................4<br />
Accidents <strong>and</strong> <strong>Aircraft</strong> Class............................................................................................4<br />
Lethality Index...............................................................................................................5<br />
Single-Engine Fixed-Gear <strong>Aircraft</strong>................................................................................5<br />
Overview.......................................................................................................................5<br />
Fatal Accident Factors....................................................................................................6<br />
Instructional Flying........................................................................................................6<br />
Single-Engine Retractable-Gear <strong>Aircraft</strong>......................................................................7<br />
Overview.......................................................................................................................7<br />
Fatal Accident Factors....................................................................................................7<br />
Multiengine <strong>Aircraft</strong>....................................................................................................8<br />
Overview.......................................................................................................................8<br />
Fatal Accident Factors....................................................................................................9<br />
Pilot-Related Accident Factors....................................................................................9<br />
Time-in-Type...............................................................................................................10<br />
Certificate Level..........................................................................................................10<br />
Personal Flying............................................................................................................11<br />
Business Flying...........................................................................................................11<br />
Mechanical/Maintenance Accidents..........................................................................12<br />
Night <strong>and</strong> Weather....................................................................................................12<br />
Special Emphasis Topic: Thunderstorms <strong>and</strong> ATC.......................................................13<br />
Homebuilt <strong>Aircraft</strong>.....................................................................................................14<br />
Other Accident Factors.............................................................................................15<br />
Fuel Management......................................................................................................15<br />
Midair Collisions..........................................................................................................15<br />
Alcohol <strong>and</strong> Drugs.......................................................................................................15<br />
Pilot Incapacitation......................................................................................................15<br />
Ground Injuries: Off-Airport...........................................................................................15<br />
Propeller Strike Injuries................................................................................................15<br />
Summary..................................................................................................................15<br />
Appendix...................................................................................................................16<br />
GA Safety vs. Airlines...................................................................................................16<br />
What Is General Aviation?.............................................................................................16<br />
What Does General Aviation Fly?...................................................................................16<br />
Interpreting Aviation Accident Statistics..........................................................................17<br />
NTSB Definitions.........................................................................................................17<br />
Additional Resources................................................................................................19
<strong>2005</strong> <strong>NALL</strong> <strong>REPORT</strong> ACCIDENT TRENDS AND FACTORS FOR 2004<br />
Nall Executive Summary<br />
Bruce L<strong>and</strong>sberg<br />
Executive Director,<br />
AOPA Air Safety Foundation<br />
www.asf.org<br />
General Aviation (GA) accident rates continue gradually down, based on NTSB accident data <strong>and</strong><br />
the FAA’s estimate of flight hours. In 2004, the rate was 6.2 accidents for every 100,000 flight<br />
hours, with 1.2 of those fatal. In all, there were 1,413 GA accidents in 2004, with 290 fatal.<br />
A few highlights:<br />
• Total pilot-related accidents are down seven percent from 2003.<br />
• The most likely phase of flight for non-fatal accidents: L<strong>and</strong>ing.<br />
• The most likely phase of flight for fatal accidents: Maneuvering.<br />
• Fatal pilot-related accidents are down 3.4 percent compared to 2003.<br />
• Weather-related accidents: 45 fatal in 2004.<br />
• 10 involved thunderstorms, <strong>and</strong> all of the pilots were talking to Air Traffic Control.<br />
• For single-engine fixed-gear aircraft, the majority (90.5 percent) of weather-related<br />
accidents were caused by pilots attempting to continue VFR flight into instrument<br />
conditions.<br />
Looking back 10 years, the overall <strong>and</strong> fatal accident rates are down<br />
about 25 percent. That’s something to be pleased about, but we<br />
shouldn’t be too proud. There is still room for improvement. Our<br />
record is not nearly as bad as GA detractors would have you believe,<br />
<strong>and</strong> not as good as it could be. There are more l<strong>and</strong>ings to be<br />
practiced, more weather to be avoided <strong>and</strong> more good decisions<br />
to be made.<br />
In <strong>2005</strong>, ASF continued to place a special emphasis on<br />
weather education <strong>and</strong> encouraged pilots to remember basic<br />
airmanship. We introduced five new online courses, several minicourses<br />
<strong>and</strong> multiple new publications, all aimed at inoculating pilots<br />
against serious mistakes. The ASF Web site at www.asf.org has become a virtual one-stop<br />
shopping center for pilots who are serious about improving their aviation safety.<br />
We’ve made some changes to the Nall Report this year to make it an easier read <strong>and</strong> to provide<br />
the safety information you need for risk assessment <strong>and</strong> decision making. Regardless of<br />
how fat your logbook may be or how many years you have or haven’t been flying, the most<br />
important flight is your next one. That never changes.<br />
Enjoy <strong>and</strong> fly safely. We want to see you here next year.<br />
Safe Flights…<br />
1
Overview/Accident Analysis<br />
Overview of 2004 Accident Trends<br />
<strong>and</strong> Factors<br />
The AOPA Air Safety Foundation’s Nall Report is the nation’s<br />
foremost annual review of general aviation (GA) accident statistics.<br />
GA comprises the majority of civil aviation activity in the<br />
United States.<br />
10<br />
8<br />
U.S. General Aviation Accidents<br />
per 100,000 Flight Hours 1995-2004<br />
8.21<br />
Total<br />
Fatal<br />
These statistics are based on National Transportation Safety<br />
Board (NTSB) investigations of accidents that occurred in 2004<br />
involving fixed-wing GA aircraft with a gross weight of 12,500<br />
pounds or less, approximately 90 percent of all GA aircraft. This<br />
data will help members of the media, the public, <strong>and</strong> the<br />
aviation community better underst<strong>and</strong> the factors involved in<br />
GA accidents.<br />
Rate<br />
6<br />
4<br />
6.22<br />
The data is broken out by accident cause <strong>and</strong> category, type of<br />
operation, class of aircraft, <strong>and</strong> other factors. This allows the<br />
reader to explore the many aspects of GA safety. For instance,<br />
pilots can learn more about the accident profile of the particular<br />
class of aircraft they fly, or the particular type of flying<br />
they do.<br />
2 1.63<br />
0<br />
'95 '96<br />
'97<br />
'98<br />
'99<br />
'00<br />
'01<br />
'02<br />
1.20<br />
'03 '04<br />
Fig. 2<br />
The total number of GA accidents is relatively low, but remains<br />
significantly higher than the airlines. (See Appendix for an<br />
overview of GA vs. airline safety.) This is due largely, to the differences<br />
in pilot experience <strong>and</strong> training, regulatory structure,<br />
aircraft, airports, <strong>and</strong> the more challenging operating environment<br />
of GA.<br />
Accident Analysis<br />
In 2004, general aviation safety continued to improve in most<br />
major categories (Figure 1) as compared to 2003. There were<br />
6.7 percent fewer total accidents (1,413 vs. 1,514) in fixedwing<br />
aircraft. Fatal accidents declined by 7.1 percent (to 290<br />
from 312), <strong>and</strong> fatalities were reduced by 8.4 percent (to 510<br />
from 557). These reductions are even more impressive considering<br />
that FAA estimated GA flight hours have increased by<br />
about 200,000 hours in each of the last three years. As always,<br />
exercise caution when using rate numbers, as GA flight hours<br />
are estimates.<br />
Accident Statistics<br />
2000 2001 2002 2003 2004<br />
Total Fixed-Wing GA Accidents 1,595 1,500 1,477 1,514 1,413<br />
Fatal Fixed-Wing GA Accidents 302 300 312 312 290<br />
Total Fixed-Wing GA Fatalities 524 557 518 557 510<br />
Estimated GA Flight Hrs. (millions) 27.8 25.4 25.5 25.7 25.9<br />
Fig. 1<br />
Accident Trends<br />
By themselves, the numbers of accidents <strong>and</strong> fatalities do not<br />
tell the whole story. Accident rates are a more useful tool than<br />
raw numbers for analyzing accident trends. In aviation, accident<br />
rates are typically calculated as the number of accidents<br />
per 100,000 flight hours.<br />
The total GA accident rate (Figure 2) for 2004 reached a historic<br />
low of 6.22 accidents per 100,000 flight hours. The 2004<br />
fatal accident rate of 1.20 per 100,000 hours was bettered<br />
only in 1999. Over the past decade, there has been a dramatic<br />
reduction in the rates for both total <strong>and</strong> fatal accidents.<br />
While there have been annual variations, the total <strong>and</strong> fatal GA<br />
accident rates have dropped by 24.2 percent <strong>and</strong> 26.4 percent<br />
respectively since 1995.<br />
Accident Causes<br />
In this report, the causes of aircraft accidents have been<br />
divided into three groups:<br />
• Pilot-related – accidents that arise from the improper action<br />
or inaction of the pilot.<br />
• Mechanical/Maintenance – accidents that arise from<br />
failure of a mechanical component or errors in maintenance.<br />
• Other/Unknown – accidents that include causes such as<br />
pilot incapacitation, as well as accidents whose cause could<br />
not be determined.<br />
The number of 2004 accidents by cause is shown in Figure 3.<br />
General Aviation Accidents 2004<br />
MAJOR CAUSE All Accidents Fatal Accidents<br />
Pilot 1067 (75.5%) 228 (78.6%)<br />
Mechanical/<br />
Maintenance 221 (15.6%) 29 (10.0%)<br />
Other/Unknown 125 (8.8%) 33 (11.4%)<br />
TOTAL 1413 290<br />
Fig. 3<br />
2
<strong>2005</strong> <strong>NALL</strong> <strong>REPORT</strong> ACCIDENT TRENDS AND FACTORS FOR 2004<br />
Accident Analysis<br />
As is the case in all sectors of aviation, the majority are pilotrelated,<br />
with 75.5 percent (1,067) of the total <strong>and</strong> 78.6 percent<br />
(228) of the fatal accidents. Because GA aircraft are generally<br />
very reliable, only 15.6 percent (221) of the total <strong>and</strong><br />
10.0 percent (29) of the fatal accidents were attributed to<br />
mechanical or maintenance issues. Other or unknown causes<br />
accounted for 8.8 percent (125) of the total <strong>and</strong> 11.4 percent<br />
(33) of the fatal accidents.<br />
Accident Category<br />
Each of the causes described above can be further divided by<br />
accident category. For this report, accident categories are<br />
defined by the phase of flight in which the accident occurred<br />
(for example, l<strong>and</strong>ing or maneuvering), or by primary factor,<br />
such as fuel management or weather.<br />
Pilot-Related Accidents<br />
1,067 total/ 228 fatal<br />
As with the overall improvement in GA accident statistics, the<br />
number of pilot-related accidents in 2004 declined by 7.0 percent,<br />
to 1,067 from 1,147 in 2003 (Figure 4). Fatal accidents<br />
decreased less dramatically, dropping by 3.4 percent from 236<br />
in 2003 to 228 in 2004.<br />
Accident Causes - Pilot Related<br />
Preflight/Taxi<br />
3.6% (38)<br />
0.0% (0)<br />
Total<br />
Takeoff/Climb<br />
15.7% (167)<br />
Fatal<br />
15.8% (36)<br />
Fuel Management<br />
12.7% (136)<br />
7.0% (16)<br />
Weather<br />
4.5% (48)<br />
19.7% (45)<br />
Other Cruise<br />
Descent/Approach<br />
1.8% (19)<br />
4.0% (9)<br />
5.7% (61)<br />
15.3% (35)<br />
Go-Around<br />
3.8% (41)<br />
2.6% (6)<br />
Maneuvering<br />
9.7% (103)<br />
22.8% (52)<br />
L<strong>and</strong>ing<br />
Other<br />
4.0% (9)<br />
2.7% (29)<br />
8.8% (20)<br />
39.8% (425)<br />
0% 5% 10% 15% 20% 25% 30% 35% 40%<br />
NOTE: Accident counts for each category<br />
are displayed in parentheses.<br />
Fig. 4<br />
The takeoff/climb <strong>and</strong> l<strong>and</strong>ing categories accounted for 55.5<br />
percent of all pilot-related accidents. These two phases of flight<br />
occur close to the ground with slow airspeeds, making the<br />
maneuvering skills of the pilot critical. Even though these phases<br />
accounted for a high percentage of total accidents, they only<br />
accounted for 19.8 percent of the fatal pilot-related accidents.<br />
The relatively low death rate of takeoff <strong>and</strong> l<strong>and</strong>ing accidents is<br />
likely related to slow airspeeds used during these operations<br />
<strong>and</strong> the relative lack of obstructions in the airport environment.<br />
The deadliest pilot-related accident categories were weather,<br />
maneuvering, <strong>and</strong> descent/approach. While weather-related<br />
accidents comprised only 4.5 percent of total accidents, they<br />
accounted for nearly one in five (19.7 percent) of fatal accidents.<br />
These frequently resulted from pilots continuing VFR<br />
flight into instrument meteorological conditions (IMC) or from<br />
in-flight encounters with thunderstorms. In 2004, there was a<br />
significant increase in the number of fatal weather-related accidents,<br />
as compared to previous years. Unfortunately, there is no<br />
identifiable trend or commonality.<br />
Similarly, maneuvering accidents were only 9.7 percent of all<br />
pilot-related accidents, but nearly one in four (22.8 percent) of<br />
the fatal accidents. Maneuvering accidents often involve questionable<br />
decision making, such as a pilot choosing to engage in<br />
buzzing, low passes, or other high-risk activities.<br />
Pilot-related descent <strong>and</strong> approach accidents accounted for<br />
only 5.7 percent of total accidents, but 15.3 percent of the<br />
fatal accidents. Such accidents often result from high-speed<br />
collisions with the ground, or loss of control due to stall/spin.<br />
Type of Operation<br />
General aviation aircraft are operated for a wide variety of<br />
reasons, from recreational <strong>and</strong> personal flying to commercial<br />
operations. Analyzing accidents by the purpose of the flight<br />
(Figure 5 next page) shows that most 2004 GA flying was for<br />
personal (50.1 percent), instructional (19.4 percent), <strong>and</strong><br />
business (14.4 percent) purposes. Definitions for all types of<br />
operations are found in the Appendix.<br />
Personal flights – visiting friends or family, traveling to a<br />
vacation home, or for recreation – accounted for seven out of<br />
10 total accidents in 2004 (70.6 percent), <strong>and</strong> nearly threequarters<br />
(73.8 percent) of fatal accidents, making it more<br />
hazardous than all other operations.<br />
3
Accident Analysis<br />
TYPE OF OPERATION<br />
Type of Operation<br />
Percent of<br />
Flying (2003)<br />
Percent of Total<br />
Accidents (2004)<br />
Percent of Fatal<br />
Accidents (2004)<br />
Personal 50.1% 70.6% 73.8%<br />
Instructional 19.4% 12.7% 4.1%<br />
Aerial Application 4.4% 4.8% 2.8%<br />
Business 14.4% 3.8% 5.9%<br />
Positioning * 1.8% 3.5%<br />
Ferry * 0.4% 0.3%<br />
Other Work Use 1.4% 1.4% 1.7%<br />
Aerial Observation 3.3% 0.6% 0.7%<br />
Exec./Corporate 5.1% 0.4% 0.3%<br />
Other/Unknown 1.9% 3.5% 6.9%<br />
*Included in Other/Unknown<br />
Fig. 5<br />
By contrast, instructional flying is relatively safe. While accounting<br />
for one out of every five flight hours, it resulted in just 12.7<br />
percent of all accidents <strong>and</strong> only 4.1 percent of fatal accidents.<br />
This is due, in part, to the high level of supervision <strong>and</strong> structure<br />
in the training environment.<br />
Business flying – flights made in furtherance of the pilot’s own<br />
livelihood – is one of the safest operations. It comprised 14.4<br />
percent of GA operations in 2004, but accounted for only 3.8<br />
percent of all accidents <strong>and</strong> 5.9 percent of all fatal accidents.<br />
For business pilots, flying is secondary to their primary business<br />
or occupation. This differs from executive/corporate flying, in<br />
which professional pilots are hired solely to fly.<br />
Note that there is some overlap in the terms used to describe<br />
the emergency phase <strong>and</strong> the accident category. For example,<br />
fuel exhaustion during cruise would be categorized as a fuel<br />
management accident, but the emergency phase of flight would<br />
be listed as cruise.<br />
Figure 6 (below, left) depicts pilot-related accidents by the<br />
phase of flight in which the accident chain began. In 2004, half<br />
started in either the takeoff or l<strong>and</strong>ing phase of flight.<br />
Significant increases in fatal accidents over 2003 were noted<br />
for accidents that began in the takeoff (from 2.9 to 19.4 percent)<br />
<strong>and</strong> maneuvering (from 5.9 to 30.6 percent) phases. The<br />
overall number of accidents that started during approach<br />
increased from 10.2 to 17.2 percent, <strong>and</strong> the percentage of<br />
those that were fatal dropped from 29.4 to 13.1 percent.<br />
Accidents that began during the approach phase were evenly<br />
split between VMC <strong>and</strong> IMC weather conditions, yet significantly<br />
more flying is done in visual conditions. While these appear<br />
to be significant changes, the 2003 numbers appear to be the<br />
anomaly, with 2004 percentages being closer to the historical<br />
trends.<br />
Accidents <strong>and</strong> <strong>Aircraft</strong> Class<br />
There are three classes of fixed-wing general aviation aircraft<br />
covered by this report: single-engine fixed-gear (SEF), singleengine<br />
retractable-gear (SER), <strong>and</strong> multiengine (ME). <strong>Aircraft</strong><br />
performance, along with the complexity of cockpit instrumentation<br />
<strong>and</strong> aircraft systems, typically increases on each succeeding<br />
type. That said, however, the emergence of a new class of<br />
advanced SEF aircraft like the Cirrus <strong>and</strong> Lancair – many of<br />
which are capable of speeds comparable to light twins – has<br />
changed this hierarchy.<br />
Emergency Phase of Flight<br />
In a typical accident scenario, a series of related mistakes<br />
<strong>and</strong>/or failures occurs over time, resulting in the crash. This is<br />
called the accident chain. In its investigations, the NTSB tries to<br />
determine the phase of flight in which these critical events<br />
began. This analysis can be helpful in identifying important<br />
safety issues.<br />
Emergency Phase of Flight<br />
80%<br />
70%<br />
60%<br />
50%<br />
Accident/Fatality Rate by Class<br />
69.9%<br />
(987)<br />
57.9%<br />
(168)<br />
51.0%<br />
(260)<br />
SE Fixed<br />
SE Retract<br />
Multi<br />
St<strong>and</strong>ing<br />
0.8% (11)<br />
0.0% (0)<br />
Total<br />
Taxi<br />
Takeoff<br />
Climb<br />
3.2% (41)<br />
Fatal<br />
0.0% (0)<br />
18.0% (234)<br />
19.4% (31)<br />
2.1% (27)<br />
3.1% (5)<br />
Cruise<br />
12.9% (168)<br />
25.6% (41)<br />
Descent<br />
2.9% (38)<br />
2.5% (4)<br />
Approach<br />
17.2% (224)<br />
13.1% (21)<br />
Go-Around<br />
L<strong>and</strong>ing<br />
2.0% (26)<br />
0.6% (1)<br />
3.8% (6)<br />
31.7% (413)<br />
Maneuvering<br />
8.7% (113)<br />
30.6% (49)<br />
Unknown<br />
0.5% (6)<br />
1.3% (2)<br />
0% 5% 10% 15% 20% 25% 30% 35%<br />
Fig. 6<br />
40%<br />
30%<br />
20%<br />
10%<br />
0%<br />
20.8%<br />
(294)<br />
Total Acc.<br />
9.3%<br />
(132)<br />
24.2%<br />
(70)<br />
17.9%<br />
(52)<br />
Fatal Acc.<br />
25.3%<br />
23.7%<br />
(129)<br />
(121)<br />
Fatalities<br />
Fig. 7<br />
Figure 7 displays GA accidents by aircraft class. It indicates that<br />
the more complex <strong>and</strong> capable the aircraft, the greater the<br />
chance of a fatality in an accident. In 2004, SEF aircraft, which<br />
comprise the majority of the GA fleet, accounted for 69.9 percent<br />
of all accidents but only 57.9 percent of fatal accidents.<br />
SER aircraft had about one out of five of total accidents<br />
4
<strong>2005</strong> <strong>NALL</strong> <strong>REPORT</strong> ACCIDENT TRENDS AND FACTORS FOR 2004<br />
Single-Engine Fixed-Gear<br />
(20.8 percent) <strong>and</strong> almost one out of four (24.2 percent) of<br />
fatal accidents.<br />
ME aircraft accounted for only 9.3 percent of all accidents,<br />
but a disproportionately high 17.9 percent of fatal accidents.<br />
These aircraft are typically operated in a wider range of weather<br />
conditions than the other two classes. Also, with their higher<br />
performance <strong>and</strong> stall speeds, they are less forgiving of pilot<br />
mistakes. The accident categories for each of these aircraft<br />
classes are examined in detail later.<br />
Lethality Index<br />
One method of giving visibility to the severity of accidents is<br />
through the creation of a Lethality Index (Figure 8). This chart<br />
illustrates the likelihood that pilot-related accidents in each category<br />
will result in a fatality.<br />
Preflight/Taxi 0.0%<br />
Takeoff/Climb<br />
Fuel Management<br />
Weather<br />
Other Cruise<br />
Descent/Approach<br />
Go-Around<br />
Maneuvering<br />
L<strong>and</strong>ing<br />
Other<br />
2.1%<br />
Lethality Index - All<br />
11.8%<br />
14.6%<br />
21.6%<br />
47.4%<br />
50.5%<br />
57.4%<br />
69.0%<br />
93.8%<br />
0% 20% 40% 60% 80% 100%<br />
Fig. 8<br />
By a large margin (more than nine out of 10, or 93.8<br />
percent), accidents due to weather were fatal in 2004.<br />
Descent/approach accidents also tended to be lethal, ending in<br />
fatality nearly six out of 10 times (57.4 percent). These are<br />
both large increases from the 71.4 <strong>and</strong> 48.9 percentage rates,<br />
respectively, registered in 2003. Maneuvering accidents resulted<br />
in death half (50.5 percent) of the time.<br />
The “other” category also had a high level of lethality, at 69.0<br />
percent. These include accidents for which no cause could be<br />
found. This often means the cause could not be determined by<br />
investigators due to lack of evidence or witnesses.<br />
The Lethality Index for each class of aircraft is presented as part<br />
of the following discussions.<br />
Single-Engine Fixed-Gear <strong>Aircraft</strong><br />
788 total/ 137 fatal<br />
Overview<br />
Accident Causes<br />
Single-Engine Fixed-Gear (SEF)<br />
4.2% (33)<br />
Total<br />
Preflight/Taxi<br />
0.0% (0)<br />
Fatal<br />
16.0% (126)<br />
Takeoff/Climb<br />
15.3% (21)<br />
Fuel Management<br />
11.5% (91)<br />
6.6% (9)<br />
Weather<br />
2.9% (23)<br />
15.3% (21)<br />
Other Cruise<br />
1.9% (15)<br />
4.4% (6)<br />
Descent/Approach<br />
Go-Around<br />
Maneuvering<br />
4.7% (37)<br />
13.1% (18)<br />
3.7% (29)<br />
2.2% (3)<br />
11.3% (89)<br />
29.2% (40)<br />
L<strong>and</strong>ing<br />
Other<br />
2.9% (4)<br />
2.8% (22)<br />
11.0% (15)<br />
41.0% (323)<br />
0% 10% 20% 30% 40% 50%<br />
Fig. 9<br />
Single-engine fixed-gear (SEF) aircraft are the largest group in<br />
general aviation. They are used for a wide variety of operations,<br />
but their relatively low operating costs make them particularly<br />
attractive for pleasure flights <strong>and</strong> instruction.<br />
SEF aircraft accidents in 2004 dropped by 69 (857 in 2003 to<br />
788 in 2004) compared to the previous year. Fatal accidents<br />
rose slightly, from 133 to 137 for the same timeframe. The distribution<br />
of accidents (Figure 9) was similar to 2003. The top<br />
four categories for fatal crashes accounted for a combined 72.9<br />
percent of the total, as shown here:<br />
Maneuvering: 29.2 percent (40)<br />
Takeoff/Climb: 15.3 percent (21)<br />
Weather: 15.3 percent (21)<br />
Descent/Approach: 13.1 percent (10 VMC, 8 IMC)<br />
5
Single-Engine Fixed-Gear<br />
Fatal Accident Factors<br />
Maneuvering Accidents<br />
Single-Engine Fixed-Gear (SEF)<br />
resulted from continued VFR flight into IMC. In such cases, a<br />
pilot flying by reference to outside visual cues flies into clouds<br />
or low visibility conditions, <strong>and</strong> loses control of the aircraft or<br />
hits terrain. <strong>Pilots</strong> must be able to effectively assess weatherrelated<br />
risks to avoid these situations.<br />
Lost Control<br />
Hit Terrain/<br />
Wires/Trees<br />
Lethality Index<br />
Single-Engine Fixed-Gear (SEF)<br />
Preflight/Taxi 0.0%<br />
50.0%<br />
(3)<br />
50.0%<br />
(3)<br />
Takeoff/Climb<br />
Fuel Management<br />
9.9%<br />
16.7%<br />
Weather<br />
91.3%<br />
Other Cruise<br />
Descent/Approach<br />
40.0%<br />
48.6%<br />
Fig. 10<br />
Go-Around<br />
10.3%<br />
There were 89 SEF maneuvering accidents in 2004, of which<br />
40 resulted in fatalities. There are three primary reasons for<br />
these deaths as shown in Figure 10. Loss of aircraft control was<br />
the most common (45.0 percent) followed by hitting terrain,<br />
wires, or other obstacles (32.5 percent). Accidents occurring<br />
while performing aerobatic maneuvers accounted for 22.5 percent<br />
of the SEF fatal maneuvering crashes. Maneuvering accidents<br />
are generally preventable through the use of good pilot<br />
judgment <strong>and</strong> decision making.<br />
Of the 21 fatal takeoff <strong>and</strong> climb accidents, over half (13)<br />
were the result of control loss due to failure to attain or maintain<br />
airspeed.<br />
Weather-Related Accidents<br />
Single-Engine Fixed-Gear (SEF)<br />
4.8%<br />
(1)<br />
4.8%<br />
(1)<br />
90.4%<br />
(19)<br />
Icing<br />
Lost Control<br />
IFR in IMC<br />
VFR in IMC<br />
Fig. 11<br />
As in previous years, weather made up only a small portion (2.9<br />
percent) of total SEF accidents, but a relatively large number<br />
(15.3 percent) of the fatal ones. Figure 11 shows that 90.4<br />
percent of fatal weather-related accidents in SEF aircraft<br />
Maneuvering<br />
L<strong>and</strong>ing<br />
Other<br />
1.2%<br />
44.9%<br />
68.2%<br />
0% 20% 40% 60% 80% 100%<br />
Fig. 12<br />
Figure 12 depicts the Lethality Index for SEF aircraft. It closely<br />
resembles the chart of the lethality index for all GA aircraft<br />
(Figure 9, page 5) because SEF aircraft represent the majority<br />
of the GA fleet.<br />
Instructional Flying<br />
The area of greatest improvement for 2004 was in number of<br />
instructional accidents. Instructional flying provides the training<br />
<strong>and</strong> practice that allows pilots to develop <strong>and</strong> maintain skills,<br />
habits, <strong>and</strong> attitudes that directly contribute to safety. Following<br />
a spike in instructional accidents in 2003, the Air Safety<br />
Foundation <strong>and</strong> other industry groups launched initiatives to<br />
address the sudden increase. As a result, instructional accidents<br />
have returned to their historic low levels. We caution that<br />
one-year or even several-year fluctuations do not constitute<br />
long-term trends. Causal factors may be addressed, but broad<br />
pronouncements of a fundamental shift, based on such limited<br />
data, are usually premature.<br />
The total number of instructional accidents decreased 10.4<br />
percent in 2004 (from 173 to 155), while fatal training<br />
accidents declined 41.2 percent (from 17 to 10). Figure 13<br />
(next page) shows the breakdown of instructional flying accidents<br />
by category. Some noteworthy points regarding 2004<br />
instructional accidents are:<br />
• The proportion of go-around accidents attributed to instructional<br />
flying increased from 19.0 percent in 2003 to 29.3<br />
percent in 2004, although none in 2004 were fatal. These<br />
go-around accidents were split evenly between dual <strong>and</strong> solo<br />
operations.<br />
6
<strong>2005</strong> <strong>NALL</strong> <strong>REPORT</strong> ACCIDENT TRENDS AND FACTORS FOR 2004<br />
Single-Engine Retractable-Gear<br />
Proportion of Accidents - Instructional Flying<br />
Preflight/Taxi<br />
0.0% (0)<br />
Takeoff/Climb<br />
Fuel Management<br />
6.6% (9)<br />
0.0% (0)<br />
2.1% (1)<br />
Weather<br />
0.0% (0)<br />
0.0% (0)<br />
Other Cruise<br />
0.0% (0)<br />
Descent/Approach<br />
Go-Around<br />
Maneuvering<br />
0.0% (0)<br />
2.8% (1)<br />
7.8% (8)<br />
7.7% (4)<br />
15.8% (6)<br />
13.2% (22)<br />
13.1% (8)<br />
11.4% (4)<br />
Total<br />
Fatal<br />
29.3% (12)<br />
L<strong>and</strong>ing<br />
11.1% (1)<br />
20.7% (88)<br />
3.4% (1)<br />
Other<br />
0.0% (0)<br />
0% 5% 10% 15% 20% 25% 30%<br />
19.4% proportion<br />
of flying<br />
Fig. 13<br />
• There was a significant reduction in the proportion of<br />
preflight/taxi (from 25.8 to 15.8 percent) <strong>and</strong> takeoff/climb<br />
(from 20.5 to 13.2 percent) accidents that occurred during<br />
instructional flights.<br />
Single-Engine Retractable-Gear<br />
<strong>Aircraft</strong><br />
184 total/ 49 fatal<br />
Overview<br />
Accident Causes<br />
Single-Engine Retractable-Gear (SER)<br />
Preflight/Taxi<br />
Takeoff/Climb<br />
Fuel Management<br />
Weather<br />
2.2% (4)<br />
0.0% (0)<br />
12.5% (23)<br />
8.2% (4)<br />
18.5% (34)<br />
6.1% (3)<br />
9.8% (18)<br />
36.7% (18)<br />
Total<br />
Fatal<br />
Other Cruise<br />
1.6% (3)<br />
6.1% (3)<br />
Descent/Approach<br />
6.5% (12)<br />
14.3% (7)<br />
Go-Around<br />
4.3% (8)<br />
2.0% (1)<br />
Maneuvering<br />
3.8% (7)<br />
12.3% (6)<br />
L<strong>and</strong>ing<br />
8.2% (4)<br />
38.6% (71)<br />
Other<br />
2.2% (4)<br />
6.1% (3)<br />
0% 5% 10% 15% 20% 25% 30% 35% 40%<br />
Fig. 14<br />
With their relatively high performance, single-engine<br />
retractable-gear (SER) aircraft are popular for personal <strong>and</strong><br />
business trips. This type of use exposes the pilot to a wider<br />
range of weather <strong>and</strong> operational conditions than pleasure<br />
flying.<br />
SER accidents decreased 5.6 percent in 2004 (from 195 to<br />
184), while fatal accidents decreased 25.8 percent (from 66 to<br />
49). Figure 14 charts the data for accidents in this class. The<br />
leading causes of SER fatal accidents in 2004 were:<br />
Weather: 36.7 percent (18)<br />
Descent/Approach: 14.3 percent (0 VMC, 7 IMC)<br />
Maneuvering: 12.3 percent (6)<br />
Fatal Accident Factors<br />
38.9%<br />
(7)<br />
Weather-Related Accident Causes<br />
Single-Engine Retractable-Gear (SER)<br />
5.6%<br />
(1)<br />
55.5%<br />
(10)<br />
Thunderstorms<br />
Icing<br />
VFR in IMC<br />
Fig. 15<br />
Weather-related accidents in SER aircraft increased 28.6 percent,<br />
to 18 (all fatal) from 14 (12 fatal) the previous year.<br />
Figure 15 shows the reasons for these accidents, including the<br />
fact that 55.5 percent resulted from continued VFR flight into<br />
7
Multiengine<br />
IMC. Another 38.9 percent resulted from encounters with thunderstorms,<br />
<strong>and</strong> 5.6 percent were due to in-flight icing.<br />
Descent/approach accident rates in SER aircraft improved<br />
dramatically from 2003, dropping from 24.2 percent to 14.3<br />
percent of the total. This high-workload phase of flight can lead<br />
to pilot distractions, inducing loss of control or collisions with<br />
the ground.<br />
Maneuvering Accidents<br />
Single-Engine Retractable-Gear (SER)<br />
Lost Control<br />
Hit Terrain/<br />
Wires/Trees<br />
50.0%<br />
(3)<br />
50.0%<br />
(3)<br />
Fig. 16<br />
There were 10 fewer fatal SER maneuvering crashes (six versus<br />
16) (Figure 16) in 2004 than the previous year. The 2004<br />
maneuvering accidents were split evenly between collisions with<br />
terrain/obstructions <strong>and</strong> loss of control.<br />
SER aircraft had higher lethality indexes in most categories than<br />
SEF aircraft (Figure 17). The probability of fatal injury was highest<br />
for accidents attributable to weather (100 percent), other<br />
cruise (100 percent), maneuvering (85.7 percent), <strong>and</strong><br />
descent/approach (58.3 percent). Accidents with “other”<br />
causes were 75 percent lethal.<br />
Preflight/Taxi 0.0%<br />
Takeoff/Climb<br />
Fuel Management<br />
Weather<br />
Other Cruise<br />
Descent/Approach<br />
Go-Around<br />
Maneuvering<br />
L<strong>and</strong>ing<br />
Other<br />
Lethality Index<br />
Single-Engine Retractable-Gear (SER)<br />
8.8%<br />
5.6%<br />
12.5%<br />
17.4%<br />
58.3%<br />
75.0%<br />
100%<br />
100%<br />
85.7%<br />
0% 20% 40% 60% 80% 100%<br />
Multiengine <strong>Aircraft</strong><br />
95 total/ 42 fatal<br />
Overview<br />
Accident Causes<br />
Multiengine (ME)<br />
1.0% (1)<br />
Total<br />
Preflight/Taxi<br />
0.0% (0)<br />
Fatal<br />
19.0% (18)<br />
Takeoff/Climb<br />
26.2% (11)<br />
Fuel Management<br />
11.6% (11)<br />
9.5% (4)<br />
Weather<br />
7.4% (7)<br />
14.3% (6)<br />
Other Cruise<br />
1.0% (1)<br />
0.0% (0)<br />
Descent/Approach<br />
12.6% (12)<br />
23.8% (10)<br />
Go-Around<br />
Maneuvering<br />
4.2% (4)<br />
4.8% (2)<br />
7.4% (7)<br />
14.3% (6)<br />
L<strong>and</strong>ing<br />
Other<br />
2.4% (1)<br />
3.2% (3)<br />
4.8% (2)<br />
32.6% (31)<br />
0% 5% 10% 15% 20% 25% 30% 35%<br />
NOTE: Accident counts for each category<br />
are displayed in parentheses.<br />
Fig. 18<br />
In normal operations, multiengine (ME) aircraft share the high<br />
performance of their retractable-gear single-engine cousins. ME<br />
aircraft have a potential safety advantage in the second engine,<br />
but higher levels of pilot skill are required if one of the engines<br />
does fail, particularly during takeoff or initial climb.<br />
Fig. 17<br />
8
<strong>2005</strong> <strong>NALL</strong> <strong>REPORT</strong> ACCIDENT TRENDS AND FACTORS FOR 2004<br />
Multiengine<br />
The number of accidents in ME aircraft remained the same in<br />
2004 (95) as 2003, while the number of fatal accidents<br />
increased 13.5 percent (from 37 to 42). Figure 18 (previous<br />
page) depicts the data on all pilot-related accidents <strong>and</strong> fatal<br />
accidents in this aircraft class. The leading categories of fatal<br />
ME aircraft accidents were:<br />
Takeoff/Climb: 26.2 percent (11)<br />
Descent/Approach: 23.8 percent (5 VMC, 5 IMC)<br />
Weather: 14.3 percent (6)<br />
Maneuvering: 14.3 percent (6)<br />
Fatal Accident Factors<br />
Takeoff/climb accidents accounted for nearly one in five ME<br />
accidents overall, <strong>and</strong> over one fourth of those that resulted in<br />
death. A likely contributor to this is the higher takeoff <strong>and</strong> stall<br />
speeds of ME aircraft. Also, in a conventional ME aircraft, loss<br />
of power in one engine creates an asymmetrical thrust situation<br />
that can challenge an unprepared pilot.<br />
16.7%<br />
(1)<br />
Maneuvering Accidents<br />
Multiengine (ME)<br />
66.6%<br />
(4)<br />
16.7%<br />
(1)<br />
Aerobatics<br />
Lost Control<br />
Hit Terrain/<br />
Wires/Trees<br />
Fig. 20<br />
Accidents that occurred during descent/approach accounted for<br />
12.6 percent of the total ME accidents, <strong>and</strong> nearly one in four<br />
(23.8 percent) of fatal ME accidents.<br />
Weather-Related Accident Causes<br />
Multiengine (ME)<br />
Figure 21 (below) depicts the lethality index for all accident categories<br />
in ME aircraft in 2004. With 61.1 percent fatal, ME<br />
accidents during takeoff <strong>and</strong> climb were much more deadly<br />
than those in single-engine aircraft. Other highly lethal accident<br />
categories included weather (85.7 percent), maneuvering<br />
(85.7 percent), <strong>and</strong> descent/approach (83.3 percent).<br />
Thunderstoms<br />
49.9%<br />
(3)<br />
16.7%<br />
(1)<br />
Icing<br />
Lost Control<br />
IFR in IMC<br />
VFR in IMC<br />
Preflight/Taxi 0.0%<br />
Lethality Index<br />
Multiengine (ME)<br />
Takeoff/Climb<br />
61.1%<br />
16.7%<br />
(1)<br />
Fuel Management<br />
Weather<br />
36.4%<br />
85.7%<br />
Other Cruise<br />
0.0%<br />
Descent/Approach<br />
83.3%<br />
16.7%<br />
(1)<br />
Fig. 19<br />
Go-Around<br />
50.0%<br />
NOTE: Accident counts for each category<br />
are displayed in parentheses.<br />
Maneuvering<br />
L<strong>and</strong>ing<br />
3.2%<br />
85.7%<br />
As with the other aircraft classes, weather was a significant<br />
factor in ME aircraft accidents. There were seven weather accidents,<br />
six of which were fatal. Figure 19 shows half (three) of<br />
these fatal accidents were related to thunderstorms, <strong>and</strong> one<br />
each due to VFR flight into IMC, loss of control while operating<br />
IFR in IMC, <strong>and</strong> icing.<br />
Figure 20 (above, right) illustrates the primary reasons for fatal<br />
ME maneuvering accidents. Note that the maneuvering accident<br />
profile differs from that of single-engine aircraft, with most<br />
such ME accidents resulting from loss of control. There was only<br />
one maneuvering accident in each of the other groups.<br />
Other<br />
66.7%<br />
0% 20% 40% 60% 80% 100%<br />
Fig. 21<br />
Pilot-Related Accident Factors<br />
Levels of pilot experience <strong>and</strong> certification are always of interest.<br />
Figure 22 (opposite, above) shows the correlation between<br />
accidents <strong>and</strong> pilot flight hours in 2004. As in previous years,<br />
the more experienced the pilot, the less likely he or she is to be<br />
involved in an accident. The first 500 hours of a pilot’s flying<br />
career are the most critical, with 34.4 percent of the total <strong>and</strong><br />
28.7 percent of fatal accidents occurring then.<br />
9
Pilot-Related Accident Factors<br />
Accident Rates by Hours of Experience<br />
40%<br />
35%<br />
34.4%<br />
% of Total<br />
% of Fatal<br />
30%<br />
28.7%<br />
25%<br />
21.1%<br />
22.2%<br />
20%<br />
17.3%<br />
15.8%<br />
15%<br />
13.5%<br />
10%<br />
10.1%<br />
7.6%<br />
6.6%<br />
5%<br />
4.4%<br />
4.3%<br />
4.3%<br />
2.9%<br />
2.9%<br />
1.6%<br />
1.8%<br />
0.5%<br />
0%<br />
0-500<br />
501-1000<br />
1001-1500<br />
1501-2000<br />
2001-2500<br />
2501-3000<br />
3001-3500<br />
3501-4000<br />
> 4000<br />
Fig. 22<br />
Time-in-Type<br />
The number of flight hours in a particular type of aircraft (Figure<br />
23) also has an impact on safety. The more time-in-type a pilot<br />
has, the less likely he or she is to have an accident in it. More<br />
than 44 percent of total 2004 accidents involved pilots with<br />
fewer than 100 hours experience in type. Nearly half (48.3 percent)<br />
of the fatal accidents were at that level of experience.<br />
Total accident rates fall sharply after the first 100 hours of timein-type.<br />
Because the first 100 hours in type is so critical, pilots<br />
should fly more conservatively – use longer runways, fly with<br />
higher IFR minimums, etc. – until more experience is gained.<br />
Certificate Level<br />
Accident rates can also be analyzed based on the level of pilot<br />
certificate held (Figure 24). Student pilots <strong>and</strong> airline transport<br />
pilots (ATP) have the lowest accident statistics relative to their<br />
representation in the overall pilot population, while private<br />
<strong>and</strong> commercial pilots both have disproportionately high<br />
percentages. Since most personal flying is done by private <strong>and</strong><br />
commercial pilots, their accident proportion closely mirrors the<br />
proportion for personal flying shown in Figure 5 (page 4).<br />
Accident Rates by Time in Type<br />
Accident Rates by Certificate Level<br />
60%<br />
50%<br />
44.5%<br />
48.3%<br />
% of Total<br />
% of Fatal<br />
60%<br />
50%<br />
52.8%<br />
48.6%<br />
% of Total<br />
% of Fatal<br />
% of Pop.<br />
40%<br />
40%<br />
38.1%<br />
30%<br />
30%<br />
20%<br />
10%<br />
0%<br />
33.5%<br />
31.6%<br />
0-100<br />
15.7%<br />
12.1%<br />
8.8%<br />
7.4%<br />
5.2%<br />
4.4%<br />
101-200<br />
201-300<br />
301-400<br />
4.2%<br />
2.2%<br />
2.7%<br />
1.1%<br />
401-500<br />
501-600<br />
4.4%<br />
2.0%<br />
2.0%<br />
3.3%<br />
2.1%<br />
1.1%<br />
2.5%<br />
0.0%<br />
11.7%<br />
14.3%<br />
601-700<br />
701-800<br />
801-900<br />
901-1000<br />
> 1000<br />
Fig. 23<br />
20%<br />
10%<br />
0%<br />
1.3%<br />
2.8%<br />
0.0%<br />
None<br />
7.0%<br />
1.9%<br />
14.2%<br />
Student<br />
0.3%<br />
0.5%<br />
0.0%<br />
Recreational<br />
Private<br />
19.8%<br />
Commercial<br />
9.3%<br />
10.4%<br />
ATP<br />
23.0%<br />
Fig. 24<br />
10
<strong>2005</strong> <strong>NALL</strong> <strong>REPORT</strong> ACCIDENT TRENDS AND FACTORS FOR 2004<br />
Mechanical/Maintenance Accidents<br />
Business Flying<br />
38 total/ 12 fatal<br />
Proportion of Accidents - Business Flying<br />
Personal Flying<br />
748 total/ 168 fatal<br />
Proportion of Accidents - Personal Flying<br />
Preflight/Taxi<br />
Takeoff/Climb<br />
Fuel Management<br />
Weather<br />
Other Cruise<br />
Descent/Approach<br />
Go-Around<br />
Maneuvering<br />
L<strong>and</strong>ing<br />
0.0% (0)<br />
68.4% (26)<br />
Total<br />
63.5% (106)<br />
61.1% (22) Fatal<br />
74.3% (101)<br />
87.5% (14)<br />
72.9% (35)<br />
75.6% (34)<br />
84.2% (16)<br />
77.8% (7)<br />
72.1% (44)<br />
77.1% (27)<br />
61.0% (25)<br />
83.3% (5)<br />
57.3% (59)<br />
61.5% (32)<br />
72.9% (310)<br />
88.9% (8)<br />
Other<br />
89.7% (26)<br />
95.0% (19)<br />
0% 20% 40% 60% 80% 100%<br />
NOTE: Accident counts for each category<br />
are displayed in parentheses.<br />
50.1% proportion<br />
of flying<br />
Fig. 25<br />
Personal flying (for example: visiting friends or family, traveling<br />
to a vacation home or for recreation) represents about half<br />
(50.1 percent) of all GA flying, but accounts for 73.8 percent of<br />
fatal <strong>and</strong> 70.6 percent of nonfatal accidents (Figure 25).<br />
This type of flying accounted for nearly three-quarters (72.9<br />
percent) of all weather-related accidents, <strong>and</strong> 75.6 percent of<br />
weather-related fatal crashes. Fuel management is another<br />
challenge for pilots on personal flights; three out of four of the<br />
total, <strong>and</strong> 87.5 percent of the fatal fuel management accidents<br />
occurred during this type of flying. Personal flights also accounted<br />
for 72.1 percent of all descent/approach accidents (77.1<br />
percent of the fatals), <strong>and</strong> 72.9 percent of l<strong>and</strong>ing accidents<br />
(88.9 percent of the fatals).<br />
0.0% (0)<br />
Total<br />
Preflight/Taxi<br />
0.0% (0)<br />
Fatal<br />
6.0% (10)<br />
Takeoff/Climb<br />
13.9% (5)<br />
Fuel Management<br />
7.4% (10)<br />
6.3% (1)<br />
Weather<br />
4.4% (2)<br />
8.3% (4)<br />
Other Cruise<br />
5.3% (1)<br />
11.1% (1)<br />
Descent/Approach<br />
4.9% (3)<br />
15.7% (2)<br />
Go-Around<br />
0.0% (0)<br />
2.4% (1)<br />
Maneuvering<br />
L<strong>and</strong>ing<br />
Other<br />
1.9% (2)<br />
1.9% (1)<br />
1.6% (7)<br />
0.0% (0)<br />
0.0% (0)<br />
0.0% (0)<br />
0% 3% 6% 9% 12% 15%<br />
GA is a key tool in the conduct of business <strong>and</strong> extends the<br />
national transportation system to locations without adequate<br />
airline service. While scheduled airlines serve 550 cities nationwide,<br />
GA can go directly to about 19,000 l<strong>and</strong>ing facilities.<br />
Many pilots rely on their aircraft for business transportation,<br />
accounting for 14.4 percent of all GA operations in 2004.<br />
Figure 26 shows that business operations are proportionally<br />
safer than other types of flying.<br />
Business flying accounted for 8.3 percent of GA weather accidents,<br />
up from 4.8 percent in 2003. The next highest rates<br />
were for fuel management <strong>and</strong> takeoff/climb accidents, tallying<br />
7.4 percent <strong>and</strong> 6.0 percent of the GA total <strong>and</strong> 6.3 <strong>and</strong> 13.9<br />
percent of GA fatal accidents, respectively. Business “other<br />
cruise” accounted for 5.3 percent of the GA total <strong>and</strong> 11.1 percent<br />
of the GA fatal accidents.<br />
Mechanical/Maintenance<br />
Accidents<br />
221 total/ 29 fatal<br />
14.4% proportion<br />
of flying<br />
Fig. 26<br />
Properly maintained GA aircraft are very reliable. As a result,<br />
failures of the aircraft or its systems are relatively rare.<br />
Mechanical/maintenance accidents are caused by a mechanical<br />
failure that adversely affects the function or performance of<br />
the aircraft. Though pilots are responsible for assuring airworthiness,<br />
when an equipment failure leads to an accident, it is<br />
considered a mechanical/maintenance accident.<br />
Engine <strong>and</strong> propeller malfunctions accounted for 47.1 percent<br />
of all, <strong>and</strong> 72.4 percent of fatal, mechanical/maintenance accidents<br />
in 2004 (Figure 27 next page). As might be expected,<br />
loss of power can create a very dangerous situation.<br />
11
Night <strong>and</strong> Weather<br />
Accident Causes - Mechanical/Maintenance<br />
Engine/Prop<br />
47.1% (104)<br />
72.4% (21)<br />
L<strong>and</strong>ing Gear/<br />
Brakes<br />
0.0% (0)<br />
20.8% (46)<br />
Total<br />
Fatal<br />
Fuel System<br />
Controls/Airframe<br />
Electrical/Ignition<br />
Oil System<br />
10.4% (23)<br />
3.5% (1)<br />
9.0% (20)<br />
10.3% (3)<br />
4.5% (10)<br />
0.0% (0)<br />
6.8% (15)<br />
6.9% (2)<br />
Vacuum System/<br />
Instruments<br />
1.4% (3)<br />
6.9% (2)<br />
0% 10% 20% 30% 40% 50% 60% 70% 80%<br />
Fig. 27<br />
Similarly, malfunctions involving aircraft controls or the airframe<br />
can be hazardous, although fortunately, they are rare. These<br />
caused nearly one in 10 (9.0 percent) of all, <strong>and</strong> 10.3 percent<br />
of fatal, mechanical/maintenance accidents. Accidents involving<br />
failures of vacuum systems or flight instruments are also<br />
rare, but can lead to loss of aircraft control when the failure<br />
occurs in IMC. In 2004 there were three such accidents, two of<br />
which were fatal.<br />
Over the past six years, the average rate of mechanical/maintenance<br />
accidents has continued to decline (Figure 28). 2004’s<br />
figure of 15.6 percent is consistent with this trend.<br />
Accident Trend - Mechanical/Maintenance<br />
Night <strong>and</strong> Weather<br />
Flights conducted at night <strong>and</strong> in adverse weather are riskier<br />
than flights during the day <strong>and</strong> in VMC. Although there are substantially<br />
more accidents in both daytime <strong>and</strong> VMC conditions,<br />
those that occur at night or in IMC are more likely to be fatal.<br />
Flights during night IMC are four times more likely to end in<br />
fatality than flights during day VMC (3.0 versus 0.7 accidents<br />
per 100,000 hours). Figure 29 presents 2004 accidents<br />
sorted by basic weather <strong>and</strong> lighting conditions.<br />
20%<br />
15%<br />
10%<br />
5%<br />
16.0%<br />
17.1%<br />
14.2%<br />
18.1%<br />
14.9%<br />
% of Total<br />
15.6%<br />
CONDITION<br />
Day<br />
Night<br />
VMC<br />
IMC<br />
Day VMC<br />
Night VMC<br />
Day IMC<br />
Night IMC<br />
Accident Causes - Weather <strong>and</strong> Light<br />
Accident<br />
Total<br />
(Fatal)<br />
1118 (152)<br />
133 (46)<br />
1307 (212)<br />
97 (71)<br />
1075 (124)<br />
99 (21)<br />
43 (28)<br />
24 (10)<br />
Percent<br />
Fatal<br />
13.6%<br />
34.6%<br />
16.2%<br />
73.2%<br />
11.5%<br />
21.2%<br />
65.1%<br />
41.7%<br />
Accident<br />
Rate<br />
/100,000 hrs.<br />
6.0<br />
5.3<br />
6.7<br />
5.7<br />
6.2<br />
4.6<br />
4.1<br />
7.2<br />
Fatal<br />
Accident Rate<br />
/100,000 hrs.<br />
0.8<br />
1.8<br />
1.1<br />
4.1<br />
0.7<br />
1.0<br />
2.7<br />
3.0<br />
Fig. 29<br />
0%<br />
'99<br />
'00<br />
'01<br />
'02<br />
'03<br />
'04<br />
Fig. 28<br />
Though the total numbers are lower, accidents at night <strong>and</strong> in<br />
IMC are more likely to be fatal. Only 13.6 percent of daytime<br />
accidents resulted in fatalities, but more than one-third (34.6<br />
percent) of all night accidents were fatal. Though only 16.2 percent<br />
of accidents in VMC were fatal, in IMC almost three fourths<br />
(73.2 percent) claimed a life.<br />
12
<strong>2005</strong> <strong>NALL</strong> <strong>REPORT</strong> ACCIDENT TRENDS AND FACTORS FOR 2004<br />
Special Emphasis Topic<br />
Looking at the combined factors, day VMC accidents had the<br />
lowest fatal accident rate of any light/weather condition, with a<br />
little more than one in 10 (11.5 percent) resulting in death. Day<br />
IMC accidents had the highest fatality rate, at 65.1 percent. At<br />
night, one in five accidents in VMC conditions were fatal (21.2<br />
percent), compared to slightly less than half of night IMC accidents<br />
(41.7 percent).<br />
Accident Trend - Weather<br />
20%<br />
19.7%<br />
17.1%<br />
15%<br />
14.2%<br />
15.2%<br />
10%<br />
12.1%<br />
13.6%<br />
12.7%<br />
Total<br />
Fatal<br />
5%<br />
4.3%<br />
3.0% 3.1%<br />
4.3%<br />
3.6%<br />
3.7%<br />
4.5%<br />
0%<br />
'98<br />
'99<br />
'00<br />
'01<br />
'02<br />
'03<br />
'04<br />
Fig. 30<br />
In general, accidents caused by weather are on the increase,<br />
with 2004 weather-related accidents at their highest level in the<br />
last six years. Figure 30 charts the trend of weather-related<br />
accidents. In 2004, weather was the primary factor in 4.5 percent<br />
of all pilot-related accidents, accounting for 19.7 percent<br />
of all fatal pilot-related crashes.<br />
Special Emphasis Topic:<br />
Thunderstorms <strong>and</strong> ATC<br />
In 2004, nearly 25 percent of fatal weather-related accidents<br />
were due to encounters with thunderstorms. All involved pilots<br />
were in contact with ATC, but still flew into severe conditions.<br />
These accidents highlight the importance of pilots <strong>and</strong> controllers<br />
sharing an underst<strong>and</strong>ing of which thunderstorm avoidance<br />
services are, or are not, being provided. The following<br />
accident summary illustrates this issue.<br />
In late spring of 2004, a high-performance single-engine aircraft<br />
was westbound over Michigan, en route IFR with the pilot<br />
<strong>and</strong> two passengers on board. The airplane had been given a<br />
heading to avoid adverse weather by Lansing approach control.<br />
Following a h<strong>and</strong>off <strong>and</strong> frequency change, the new controller<br />
advised the pilot to proceed direct to Milwaukee “when able.”<br />
The pilot likely assumed he was clear of the thunderstorm<br />
activity, but that was not the case.<br />
About seven minutes after this h<strong>and</strong>off, the pilot transmitted,<br />
"Center…what do you show us in up here?" The airplane had<br />
entered a thunderstorm <strong>and</strong> subsequently entered a flat spin,<br />
impacting the terrain below. Everyone aboard died. <strong>Aircraft</strong> <strong>and</strong><br />
weather radar data showed that the airplane had flown into an<br />
area of Level 6 (extreme) thunderstorms.<br />
Of GA’s 45 fatal weather accidents in 2004, 10 involved thunderstorms.<br />
To some degree, each was relying on ATC’s ability to<br />
guide them around the violent weather. IFR pilots have long<br />
depended on ATC to help them avoid hazardous weather.<br />
However, ATC was created for one primary purpose – to keep<br />
airplanes from colliding with one another. All other ATC services<br />
are on a workload-permitting basis <strong>and</strong> are NOT automatically<br />
provided. This means that pilots are not guaranteed weather<br />
avoidance services. <strong>Pilots</strong> need to confirm what services they<br />
are receiving, <strong>and</strong> renew their request with each controller as<br />
they change frequencies. There is currently some discussion on<br />
exp<strong>and</strong>ing ATC’s role in order to increase safety in the system.<br />
The current generation of ATC radar displays is much better<br />
than older equipment at showing weather. ATC’s new weather<br />
detection equipment, called Weather <strong>and</strong> Radar Processing, or<br />
WARP, is now installed in all Air Route Traffic Control Centers.<br />
This new equipment puts a weather-patterned background<br />
derived from the NEXRAD weather radar network behind the<br />
radar traffic display, showing the controller severe weather<br />
much more clearly than in the past.<br />
13
Homebuilt <strong>Aircraft</strong><br />
In spite of its advances, WARP has limitations. A WARP weather<br />
display is six to 11 minutes old by the time it is overlaid on<br />
the controller’s screen, because of the time required to compile<br />
information from more than one NEXRAD radar site.<br />
There are limitations to WARP too detailed to be relayed here,<br />
but WARP is a great improvement from a time when controllers<br />
would frequently respond with “My radar isn’t designed to show<br />
weather….”<br />
Terminal Radar Control Facilities (TRACONS) almost universally<br />
use ASR-9 or ASR-11, which have special weather depiction<br />
circuitry that can be used for weather avoidance. The key to<br />
effective use of this equipment is good communication with ATC<br />
– ask for deviations <strong>and</strong> assistance early. We retain the coveted<br />
title of Pilot-in-Comm<strong>and</strong> so the final decision regarding<br />
safety of the aircraft resides with us.<br />
Onboard weather radar, lightning strike detectors, <strong>and</strong> data link<br />
weather displays are valuable resources that pilots can use to<br />
remain well clear of thunderstorms. <strong>Pilots</strong> who do not have this<br />
equipment should consider staying visual as much as possible.<br />
Getting on top allows a good view of potentially dangerous<br />
buildups. If ceiling <strong>and</strong> visibility allow, staying underneath can<br />
give a good view of shafts of heavy rain.<br />
In spring of 2006, ASF will release a new training course related<br />
to thunderstorms <strong>and</strong> how to avoid them. Look for it on the<br />
ASF Web site, www.asf.org.<br />
Homebuilt <strong>Aircraft</strong><br />
125 total/ 36 fatal<br />
Homebuilt pilots represent the full range of experience <strong>and</strong><br />
certification.<br />
Pilot-related accidents in homebuilt aircraft decreased 5.3 percent<br />
in 2004 (to 125 from 132), with fatal accidents remaining<br />
virtually unchanged (to 36 from 35). Figure 31 depicts the<br />
leading categories of pilot-related homebuilt accidents. Four<br />
categories accounted for 72.3 percent of fatal homebuilt accidents.<br />
They were:<br />
Maneuvering: 39.0 percent (14)<br />
Fuel Management: 11.1 percent (4)<br />
Takeoff/Climb: 11.1 percent (4)<br />
Weather: 11.1 percent (4)<br />
Proportion of Accidents - Homebuilt<br />
Pilot-Related Accident Rates - Homebuilt<br />
Preflight/Taxi<br />
Takeoff/Climb<br />
Fuel Management<br />
Weather<br />
2.4% (3)<br />
0.0% (0)<br />
3.2% (4)<br />
14.4% (18)<br />
11.1% (4)<br />
16.0% (20)<br />
11.1% (4)<br />
11.1% (4)<br />
Total<br />
Fatal<br />
1.6% (2)<br />
Other Cruise<br />
0.0% (0)<br />
Descent/Approach<br />
4.8% (6)<br />
8.3% (3)<br />
Go-Around<br />
2.4% (3)<br />
0.0% (0)<br />
Maneuvering<br />
16.8% (21)<br />
39.0% (14)<br />
L<strong>and</strong>ing<br />
8.3% (3)<br />
34.4% (43)<br />
Other<br />
4.0% (5)<br />
11.1% (4)<br />
0% 5% 10% 15% 20% 25% 30% 35% 40%<br />
20%<br />
18%<br />
16%<br />
14%<br />
12%<br />
10%<br />
11.6% 11.8% 19.2%<br />
18.7%<br />
17.6%<br />
16.6%<br />
17.0%<br />
14.3%<br />
13.3% 13.4%<br />
12.9%<br />
12.7%<br />
'98 '99 '00 '01 '02 '03<br />
Total<br />
Fatal<br />
15.9%<br />
13.0%<br />
'04<br />
Fig. 32<br />
NOTE: Accident counts for each category<br />
are displayed in parentheses.<br />
Fig. 31<br />
Homebuilt aircraft are a rapidly growing segment of the GA fleet.<br />
They include a wide variety of designs <strong>and</strong> technologies, <strong>and</strong><br />
cover the full range from simple, low performance pleasure craft<br />
to high-tech, high performance models. Most are single engine.<br />
Figure 32 tracks the proportion of pilot-related accidents in<br />
homebuilt aircraft to overall GA accidents over the last seven<br />
years. Although the total number of homebuilt accidents is<br />
trending upwards, perhaps because the percentage of homebuilt<br />
aircraft in the fleet is increasing, the percentage of fatal<br />
homebuilt accidents is holding steady.<br />
14
<strong>2005</strong> <strong>NALL</strong> <strong>REPORT</strong> ACCIDENT TRENDS AND FACTORS FOR 2004<br />
Other Factors/Summary<br />
approved by the FAA is available to AOPA members on the AOPA<br />
Web site (www.aopa.org). Also, the AOPA Medical Certification<br />
Department offers free counseling to AOPA members on a wide<br />
variety of medical issues related to flying.<br />
Pilot Incapacitation<br />
5 total/ 4 fatal<br />
Pilot incapacitation happens very rarely. Five such accidents<br />
occurred in 2004, with one resulting from a heart attack, one<br />
from carbon monoxide poisoning, <strong>and</strong> three (one nonfatal) from<br />
unknown causes. Only one of these accidents occurred with a<br />
passenger aboard.<br />
Ground Injuries: Off-Airport<br />
4 total/ 0 fatal<br />
Other Accident Factors<br />
Fuel Management<br />
136 total/ 16 fatal<br />
Fuel management accidents include fuel exhaustion (the airplane<br />
runs out of gas), fuel starvation (fuel remains on board<br />
but is prevented from reaching the engine, e.g., failing to switch<br />
tanks at the right time), <strong>and</strong> fuel contamination. In 2004, 79<br />
(four fatal) accidents were a result of fuel exhaustion. Although<br />
easily preventable, there were 39 (seven fatal) fuel starvation<br />
accidents in 2004. Fuel contamination resulted in 18 (five<br />
fatal) accidents.<br />
Midair Collisions<br />
10 total/ 6 fatal<br />
Collisions between aircraft in flight are relatively rare. Most happen<br />
in day VFR conditions, frequently in or near an airport traffic<br />
pattern. Most in 2004 were at airports that did not have a<br />
control tower, although this does not necessarily mean that<br />
towered airports are safer, since about 97 percent of U.S. airports<br />
do not have a control tower. Total <strong>and</strong> fatal midair collisions<br />
for the year decreased by one each (11 to 10 <strong>and</strong> seven<br />
to six respectively) compared to 2003, <strong>and</strong> there were 10 fatalities.<br />
Alcohol <strong>and</strong> Drugs<br />
6 total/ 4 fatal<br />
Alcohol <strong>and</strong> drug misuse continues to rank low as an accident<br />
factor. Historically, these have been cited as a cause or factor<br />
in about 1.1 percent of all accidents. As a class, these accidents<br />
have a high probability of ending in a fatality. In 2004 six<br />
accidents were attributed to drug or alcohol use, with four being<br />
fatal. Five of the six pilots involved were impaired by alcohol; the<br />
sixth by a prescription medicine.<br />
Many pilots believe that it is safe to fly if they have recently<br />
taken an OTC or prescription medication. Depending on the<br />
drug, this may not be the case. A list of drugs commonly<br />
The fear of airplanes falling out of the sky, causing death or<br />
injury on the ground, is a common concern for nonpilots. This<br />
concern is often cited as a reason to restrict or close GA airports,<br />
even though statistics show it is far more fiction than<br />
fact. In 2004 there were no deaths <strong>and</strong> only four accidents with<br />
injuries on the ground outside of the airport environment (off<br />
airport) as a result of GA accidents. This is a significant reduction<br />
from 2003, when eight byst<strong>and</strong>ers were injured <strong>and</strong> one<br />
died. Put into perspective, these numbers pale in comparison<br />
to automotive injuries to byst<strong>and</strong>ers.<br />
Propeller Strike Injuries<br />
1 total/ 0 fatal<br />
Propeller strike injuries usually result from either an attempt to<br />
h<strong>and</strong> prop an airplane, or an individual in the ramp area inadvertently<br />
coming into contact with a moving propeller. The number<br />
of fatalities from propeller strikes is very low, averaging two<br />
per year. Only one propeller strike accident occurred in 2004,<br />
when an alcohol-impaired passenger walked into a turning propeller.<br />
He survived.<br />
Summary<br />
Between 2000 <strong>and</strong> 2004, the number of GA accidents has<br />
declined nearly 12 percent. Annual GA flight hours have<br />
increased by 200,000 for each of the last three years. Thus,<br />
the overall GA accident rate per 100,000 flight hours continues<br />
its decade-long decline. The AOPA Air Safety Foundation is continuing<br />
to work for additional improvements in GA safety.<br />
Here are more highlights of GA accident trends for 2004:<br />
• The accident rates per 100,000 hours for GA aircraft were<br />
6.22 total <strong>and</strong> 1.20 fatal.<br />
• Pilot-related causes were responsible for three-quarters of all<br />
accidents (75.5 percent) <strong>and</strong> nearly the same percentage of<br />
fatal accidents (78.6 percent). Total pilot-related accidents in<br />
2004 declined 7.0 percent (to 1,067 from 1,147); fatal<br />
pilot-related accidents dropped 3.4 percent (to 228 from<br />
236) compared to 2003.<br />
• Weather accounted for 4.5 percent of all pilot-related<br />
15
Appendix<br />
accidents, but 19.7 percent of fatal accidents. The majority<br />
of fatal weather accidents in single-engine aircraft resulted<br />
from continuing VFR flight into IMC. Single-engine retractable<br />
<strong>and</strong> multiengine aircraft accidents were more likely to have<br />
thunderstorm encounters <strong>and</strong> icing as factors.<br />
• Accidents during personal flying accounted for about seven<br />
out of 10 of all accidents (70.6 percent), <strong>and</strong> nearly threequarters<br />
(73.8 percent) of all fatal accidents. Personal flying<br />
accounted for about half of 2003 GA activity (50.1 percent).<br />
• Maneuvering flight was the category with the largest number<br />
of pilot-related fatal accidents (52). This category accounted<br />
for almost one out of four fatal crashes (22.8 percent) in<br />
2004. Maneuvering flight was also the number one fatal<br />
accident category for single-engine fixed-gear aircraft,<br />
responsible for almost one-third (29.2 percent) of all SEF<br />
fatal accidents.<br />
• Only 13.6 percent of daytime accidents resulted in fatalities,<br />
but at night, more than one in three (34.6 percent) were<br />
fatal.<br />
Appendix<br />
GA Safety vs. Airlines<br />
GA accident rates have always been higher than airline accident<br />
rates. People often ask about the reasons for this disparity.<br />
There are several:<br />
• Variety of missions – GA pilots conduct a wider range of<br />
operations. Some operations, for example, aerial application<br />
(crop-dusting in common parlance) <strong>and</strong> banner towing, have<br />
inherent mission-related risks.<br />
• Variability of pilot certificate <strong>and</strong> experience levels – All<br />
airline flights are crewed by at least one ATP (Airline<br />
Transport Pilot), the most dem<strong>and</strong>ing rating. GA is the<br />
training ground for most pilots, <strong>and</strong> while the GA community<br />
has its share of ATPs, the community also includes many<br />
new <strong>and</strong> low time pilots, <strong>and</strong> a great variety of experience in<br />
between.<br />
• More limited cockpit resources <strong>and</strong> flight support – GA<br />
operations are predominantly conducted by a single pilot,<br />
<strong>and</strong> the pilot typically h<strong>and</strong>les all aspects of the flight, from<br />
flight planning to piloting. Air carrier operations require at<br />
least two pilots. Likewise, airlines have dispatchers,<br />
mechanics, loadmasters, <strong>and</strong> others to assist with<br />
operations.<br />
• Greater variety of facilities – GA operations are conducted<br />
at about 5,000 public-use <strong>and</strong> 8,000 private-use airports,<br />
while airlines are confined to only about 700 of the larger,<br />
public- use airports. Many GA-only airports lack the precision<br />
approaches, long runways, approach lighting systems, <strong>and</strong><br />
the advanced services of airline-served airports. (There are<br />
also another 6,000 GA-only l<strong>and</strong>ing areas that are not<br />
technically airports, such as heliports <strong>and</strong> seaplane bases.)<br />
• More takeoffs <strong>and</strong> l<strong>and</strong>ings – During takeoffs <strong>and</strong> l<strong>and</strong>ings<br />
aircraft are close to the ground <strong>and</strong> in a more vulnerable<br />
configuration than in other phases of flight. On a per hour<br />
basis, GA conducts many more takeoffs <strong>and</strong> l<strong>and</strong>ings than<br />
either air carriers or the military.<br />
• Less weather-tolerant aircraft – Most GA aircraft cannot fly<br />
over or around weather the way an airliner can, <strong>and</strong> they<br />
often do not have the systems to avoid or cope with<br />
hazardous weather conditions, such as ice.<br />
What Is General Aviation?<br />
Although GA is typically characterized by recreational flying, it<br />
encompasses much more. Besides providing personal, business,<br />
<strong>and</strong> freight transportation, GA supports diverse activities<br />
such as law enforcement, forest fire fighting, air ambulance,<br />
logging, fish <strong>and</strong> wildlife spotting, <strong>and</strong> other vital services.<br />
What Does General Aviation Fly?<br />
General aviation aircraft are as varied as their pilots <strong>and</strong> the<br />
types of operations flown. The following aircraft categories <strong>and</strong><br />
classes are included in each year’s Nall Report:<br />
• Piston single-engine<br />
• Piston multiengine<br />
• Turboprop single-engine<br />
• Turboprop multiengine<br />
• Experimental<br />
• Homebuilt<br />
The following aircraft categories <strong>and</strong> classes are not included in<br />
each year’s Nall Report:<br />
• Turbojets<br />
• FAR Part 121 airline operations<br />
• FAR Part 135 charter operations<br />
• Military operations<br />
• <strong>Aircraft</strong> weighing more than 12,500 pounds<br />
• Helicopters<br />
• Gliders<br />
• Balloons<br />
16
<strong>2005</strong> <strong>NALL</strong> <strong>REPORT</strong> ACCIDENT TRENDS AND FACTORS FOR 2004<br />
NTSB Definitions<br />
The number of GA aircraft, sorted by category <strong>and</strong> class, registered<br />
in 2004 (the most recent year statistics are available from<br />
the FAA) to air taxi operators <strong>and</strong> GA is shown below:<br />
What Does General Aviation Fly?<br />
Air Taxi General Aviation<br />
Piston single-engine 2,585 146,613<br />
Piston multiengine 1,355 18,576<br />
Turboprop single-engine 453 2,468<br />
Turboprop multiengine 786 5,912<br />
Turbojet 1,558 9,298<br />
Helicopter 716 7,821<br />
Experimental 56 22,800<br />
Total 7,509 263,488<br />
Figure 33 displays the composition of the powered GA fleet,<br />
divided by aircraft class <strong>and</strong> by the type of operation. The aircraft<br />
covered in this report comprise 90.6 percent of the GA<br />
fleet, if one totals homebuilt aircraft, all singles, <strong>and</strong> all piston<br />
aircraft.<br />
Interpreting Aviation Accident Statistics:<br />
What is the accident rate?<br />
Meaningful comparisons are based on equal exposure to risk.<br />
However, this alone does not determine total risk. Experience,<br />
proficiency, equipment, <strong>and</strong> flight conditions all have a safety<br />
impact. To compare different airplanes, pilots, types of operations,<br />
etc., we must first “level the playing field” in terms of<br />
exposure to risk. The most common way to do this is to compare<br />
accidents per 100,000 flight hours. GA flight hours are<br />
estimated using data from an annual aircraft activity survey<br />
conducted by the FAA. Whether this survey accurately reports<br />
the total hours has been debated for years, but even with likely<br />
inaccuracies, the relationships between accident categories<br />
will remain constant. For instance, l<strong>and</strong>ing accidents will still<br />
account for the lion’s share of minor injury mishaps, while<br />
weather <strong>and</strong> maneuvering flight will still claim the most lives.<br />
Accident investigators <strong>and</strong> safety researchers determine the<br />
probability that a given accident was the result of a particular<br />
cause or sequence of events. This report shows the percentage<br />
of accidents attributed to a particular accident category <strong>and</strong> the<br />
percentage of accident sequences that began in a particular<br />
phase of flight. Thus we can identify <strong>and</strong> concentrate on accidents<br />
that carry the greatest risk.<br />
NTSB Definitions<br />
Fig. 33<br />
Accident/Incident (NTSB Part 830)<br />
The following definitions of terms used in this report have<br />
been extracted from NTSB Part 830 of the Federal Aviation<br />
Regulations. It is included in most commercially available<br />
FAR/AIM publications <strong>and</strong> should be referenced for detailed<br />
information.<br />
<strong>Aircraft</strong> Accident<br />
An occurrence incidental to flight in which, “as a result of the<br />
operation of an aircraft, any person (occupant or nonoccupant)<br />
receives fatal or serious injury or any aircraft receives substantial<br />
damage.”<br />
• A fatal injury is one that results in death within 30 days of<br />
the accident.<br />
• A serious injury is one that:<br />
(1) Requires hospitalization for more than 48 hours, commencing<br />
within seven days from the date the injury was received.<br />
(2) Results in a fracture of any bone (except simple fractures of<br />
fingers, toes, or nose).<br />
(3) Involves lacerations that cause severe hemorrhages, nerve,<br />
muscle, or tendon damage.<br />
(4) Involves injury to any internal organ. Or<br />
(5) Involves second- or third-degree burns, or any burns affecting<br />
more than five percent of body surface.<br />
• A minor injury is one that does not qualify as fatal or<br />
serious.<br />
• Destroyed means that an aircraft was demolished beyond<br />
economical repair, i.e., substantially damaged to the extent<br />
that it would be impracticable to rebuild it <strong>and</strong> return it to an<br />
airworthy condition. (This may not coincide with the definition<br />
of “total loss” for insurance purposes. Because of the<br />
variability of insurance limits carried <strong>and</strong> such additional<br />
factors as time on engines <strong>and</strong> propellers, <strong>and</strong> aircraft<br />
condition before an accident, an aircraft may be “totaled”<br />
even though it is not considered “destroyed” for NTSB<br />
accident-reporting purposes.)<br />
• Substantial damage for accident reporting purposes does<br />
not necessarily correlate with “substantial” in terms of<br />
financial loss. Contrary to popular misconception, there is no<br />
dollar value that defines “substantial” damage. Because of<br />
the high cost of many repairs, large sums may be spent to<br />
repair damage resulting from incidents that do not meet the<br />
NTSB definition of substantial damage.<br />
(1) Except as provided below, substantial damage means damage<br />
or structural failure that adversely affects the structural<br />
strength, performance, or flight characteristics of the aircraft,<br />
<strong>and</strong> which would normally require major repair or replacement<br />
of the affected part.<br />
(2) Engine failure, damage limited to an engine, bent fairings or<br />
cowling, dented skin, small puncture holes in the skin or fabric,<br />
ground damage to rotor or propeller blades, damage to l<strong>and</strong>ing<br />
gear, wheels, tires, flaps, engine accessories, brakes, or wing<br />
tips are not considered “substantial damage.”<br />
• Minor damage is any damage that does not qualify as<br />
substantial, such as that in item (2) under substantial<br />
damage.<br />
17
NTSB Definitions<br />
Type of Flying<br />
The purpose for which an aircraft is being operated at the time<br />
of an accident:<br />
On-Dem<strong>and</strong> Air Taxi — Revenue flights, conducted by commercial<br />
air carriers operating under FAR Part 135, that are not<br />
operated in regular scheduled service, such as charter flights,<br />
<strong>and</strong> all non-revenue flights incident to such flights.<br />
Personal — Flying by individuals in their own or rented aircraft<br />
for pleasure or personal transportation not in furtherance of<br />
their occupation or company business. This category includes<br />
practice flying (for the purpose of increasing or maintaining proficiency)<br />
not performed under supervision of an accredited<br />
instructor <strong>and</strong> not part of an approved flight training program.<br />
Business — The use of aircraft by pilots (not receiving direct<br />
salary or compensation for piloting) in connection with their<br />
occupation or in the furtherance of a private business.<br />
Instruction — Flying accomplished in supervised training under<br />
the direction of an accredited instructor.<br />
Executive/Corporate — The use of aircraft owned or leased,<br />
<strong>and</strong> operated by a corporate or business firm for the transportation<br />
of personnel or cargo in furtherance of the corporation’s<br />
or firm’s business, <strong>and</strong> which are flown by professional<br />
pilots receiving a direct salary or compensation for piloting.<br />
Aerial Application — The operation of aircraft for the purpose<br />
of dispensing any substance for plant nourishment, soil treatment,<br />
propagation of plant life, pest control, or fire control,<br />
including flying to <strong>and</strong> from the application site.<br />
Aerial Observation — The operation of an aircraft for the purpose<br />
of pipeline/power line patrol, l<strong>and</strong> <strong>and</strong> animal surveys, etc.<br />
This does not include traffic observation (electronic newsgathering)<br />
or sightseeing.<br />
Other Work Use — The operation of an aircraft for the purpose<br />
of aerial photography, banner/glider towing, parachuting,<br />
demonstration or test flying, racing, aerobatics, etc.<br />
Public Use — Any operation of an aircraft by any federal, state,<br />
or local entity.<br />
Ferry — A non-revenue flight for the purpose of (1) returning<br />
an aircraft to base, (2) delivering an aircraft from one location<br />
to another, or (3) moving an aircraft to <strong>and</strong> from a maintenance<br />
base. Ferry flights, under certain terms, may be conducted<br />
under terms of a special flight permit.<br />
Positioning — Positioning of the aircraft without the purpose of<br />
revenue.<br />
Other — Any flight that does not meet the criteria of any of the<br />
above.<br />
Phase of Flight<br />
The phase of the flight or operation is the particular phase of<br />
flight in which the first occurrence or circumstance occurred:<br />
St<strong>and</strong>ing — From the time the first person boards the aircraft<br />
for the purpose of flight until the aircraft taxies under its own<br />
power. Also, from the time the aircraft comes to its final deplaning<br />
location until all persons deplane. Includes preflight, starting<br />
engine, parked-engine operating, parked-engine not operating,<br />
<strong>and</strong> idling rotors.<br />
Taxi — From the time the aircraft first taxies under its own<br />
power until power is applied for takeoff. Also, when the aircraft<br />
completes its l<strong>and</strong>ing ground run until it parks at the spot of<br />
engine shutoff. Includes rotorcraft aerial taxi. Includes taxi to<br />
takeoff <strong>and</strong> taxi from l<strong>and</strong>ing.<br />
Takeoff — From the time the power is applied for takeoff up to<br />
<strong>and</strong> including the first airborne power reduction, or until reaching<br />
VFR traffic pattern altitude, whichever occurs first. Includes<br />
ground run, initial climb, <strong>and</strong> rejected takeoff.<br />
Climb — From the time of initial power reduction (or reaching<br />
VFR traffic pattern altitude) until the aircraft levels off at its<br />
cruise altitude. Also includes en route climbs.<br />
Cruise — From the time of level off at cruise altitude to the<br />
beginning of the descent.<br />
Descent — From the beginning of the descent from cruise altitude<br />
to the IAF, FAF, outer marker, or VFR pattern entry,<br />
whichever occurs first. Also includes en route descents, emergency<br />
descent, auto-rotation descent, <strong>and</strong> uncontrolled<br />
descent.<br />
Approach — From the time the descent ends (IAF, FAF, outer<br />
marker, or VFR pattern entry) until the aircraft reaches the MAP<br />
(IMC) or the runway threshold (VMC). Includes missed<br />
approach (IMC) <strong>and</strong> go-around (VMC).<br />
L<strong>and</strong>ing — From either the MAP (IMC) or the runway threshold<br />
(VMC) through touchdown or after touchdown off an airport,<br />
until the aircraft completes its ground run. Includes rotorcraft<br />
run-on, power-on, <strong>and</strong> auto-rotation l<strong>and</strong>ings. Also includes<br />
aborted l<strong>and</strong>ing where touchdown has occurred <strong>and</strong> l<strong>and</strong>ing is<br />
rejected.<br />
Maneuvering — Includes the following: aerobatics, low pass,<br />
buzzing, pull-up, aerial application maneuver, turn to reverse<br />
direction (box-canyon-type maneuver), or engine failure after<br />
takeoff <strong>and</strong> pilot tries to return to runway.<br />
Other — Any phase that does not meet the criteria of any of<br />
the above. Examples are practice single-engine air work, basic<br />
air work, external load operations, etc.<br />
Unknown — The phase of flight could not be determined.<br />
Unknown — A flight whose purpose is not known.<br />
18
<strong>2005</strong> <strong>NALL</strong> <strong>REPORT</strong> ACCIDENT TRENDS AND FACTORS FOR 2004<br />
Additional Resources<br />
Additional Resources<br />
If you would like additional information<br />
about the topics covered in this report, as<br />
well as many other topics not covered, visit<br />
ASF’s Web site: www.asf.org.<br />
Free Online Courses<br />
www.asf.org/courses<br />
www.asf.org<br />
Learn more in less time with ASF's free, interactive online courses.<br />
Most courses provide a personalized completion certificate<br />
<strong>and</strong> qualify for the safety seminar portion of the FAA WINGS<br />
program.<br />
• Engine <strong>and</strong> Propeller<br />
• WeatherWise<br />
• Mountain Flying<br />
• Single-Pilot IFR<br />
• Mission: Possible – Navigating Today’s Special Use Airspace<br />
CFI Renewal<br />
www.asf.org/firc<br />
ASF recertifies more flight instructors than any other course<br />
provider. Renew in person or online. Renew anytime in your<br />
four-month renewal period <strong>and</strong> keep your original expiration<br />
date!<br />
Sporty’s Safety Quiz<br />
www.asf.org/quiz<br />
Each Sporty's Safety Quiz offers a quick, easy <strong>and</strong> interactive<br />
way to assess <strong>and</strong> exp<strong>and</strong> your knowledge. Check back often:<br />
There's a new quiz added every other week.<br />
Accident Database/Analysis<br />
www.asf.org/analysis<br />
Search the AOPA Air Safety Foundation Accident Database <strong>and</strong><br />
find graphs representing the latest statistical data from the FAA<br />
<strong>and</strong> NTSB. Learn more about General Aviation safety issues<br />
with ASF's in-depth analysis, including archived versions of the<br />
annual Nall Report <strong>and</strong> Special Reports you won't find anywhere<br />
else.<br />
• Searchable Accident Database<br />
• Popular Database Searches<br />
• Special Reports<br />
• Monthly Accident Statistics<br />
• Accidents by Airport Identifier (provided to AOPA members<br />
through AOPA’s Airport Directory Online).<br />
Free Safety Seminars<br />
www.asf.org/seminars<br />
Free Safety Seminars<br />
www.asf.org/seminars<br />
Every year, the AOPA Air Safety Foundation offers more than<br />
200 free safety seminars throughout the United States.<br />
Attending a seminar is a great way to learn while enjoying the<br />
company of your fellow pilots — <strong>and</strong> if you're lucky, you might<br />
even win one of the many great door prizes!<br />
• Do the Right Thing: Decision Making for <strong>Pilots</strong><br />
• GPS: Beyond Direct-To<br />
• The Last Five Miles<br />
• Maneuvering Flight: Hazardous to Your Health?<br />
ASF Online Library<br />
www.asf.org/library<br />
Download free publications that cover a wide range of topics.<br />
Find out about regulations, weather, aircraft systems <strong>and</strong> more.<br />
• Safety Advisors & Safety Briefs<br />
• ASF Flight Planning Form<br />
• Sport Pilot Checkride Guide<br />
• Taxi Diagrams<br />
19
Take nothing for granted; do not jump to conclusions; follow every possible<br />
clue to the extent of usefulness . . . . Apply the principle that there is no<br />
limit to the amount of effort justified to prevent the recurrence of one<br />
aircraft accident or the loss of one life.<br />
— Accident Investigation Manual of the U.S. Air Force.<br />
XX
AOPA AIR SAFETY FOUNDATION<br />
421 AVIATION WAY • FREDERICK, MD 21701<br />
800-638-3101 • WWW.ASF.ORG


