2008 Nall Report - Aircraft Owners and Pilots Association
2008 Nall Report - Aircraft Owners and Pilots Association
2008 Nall Report - Aircraft Owners and Pilots Association

You also want an ePaper? Increase the reach of your titles
YUMPU automatically turns print PDFs into web optimized ePapers that Google loves.
<strong>2008</strong> NALL REPORT<br />
100<br />
50<br />
56 (16.3%) 57 (18.6%)<br />
43 (14.1%)<br />
Homebuilt - fatal<br />
60 (19.2%) 60 (20.5%)<br />
55 (17.6%)<br />
55 (21.5%)<br />
52 (17.2%)<br />
55 (20.3%)<br />
46 (15.8%)<br />
Accident Analysis<br />
0<br />
1998<br />
1999<br />
2000<br />
2001<br />
2002<br />
2003<br />
2004<br />
2005<br />
2006<br />
2007<br />
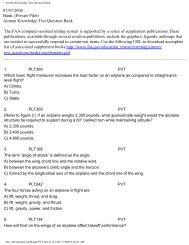
The general aviation (GA) fixed-wing safety record<br />
showed mixed long-term improvement in 2007<br />
(Figure 1), with a total of 1,385 accidents, an increase<br />
of 82 compared with 2006. However, an historic<br />
low of 252 fatal accidents (down 5.6 percent<br />
from the previous year) was also recorded. The 449<br />
total fatalities also represent a new low, decreasing<br />
by 9.7 percent.<br />
The reductions in fatal accidents were realized<br />
with only a slight drop in the FAA estimated<br />
flight hours for 2007, which decreased by only<br />
100,000 hours, less than 0.5 percent compared<br />
to 2006.<br />
Accident Trends<br />
Matching accident statistics with flight hours<br />
provides a meaningful way to analyze aviation<br />
safety. Accident rate statistics take fleet utilization<br />
into account, <strong>and</strong> are expressed as accidents per<br />
100,000 flight hours. This allows accurate year-toyear<br />
comparisons. (Figure 2)<br />
With 6.47 accidents per 100,000 flight hours for<br />
2007, the overall accident rate was the thirdhighest<br />
of the last decade. The fatal accident rate<br />
of 1.18 per 100,000 flight hours shows marked<br />
improvement over the previous six years, but still<br />
misses the low mark of 1.11 set in 1999.<br />
8<br />
7<br />
6<br />
5<br />
4<br />
3<br />
2<br />
1<br />
6.81<br />
6.78<br />
6.13 6.03<br />
6.47<br />
6.30 6.29 6.32<br />
6.11<br />
6.06<br />
Accident rate<br />
Fatal accident rate<br />
1.38<br />
1.11 1.14<br />
1.27 1.32 1.29 1.25<br />
1.38<br />
1.24 1.18<br />
1998 1999 2000 2001 2002 2003 2004 2005 2006 2007<br />
Accident 300 Causes 283 (18.0%)<br />
276 (16.7%)<br />
For analytical purposes, it’s helpful to divide the<br />
causes of GA accidents into 251 three (17.1%) groups:<br />
250<br />
254 (15.4%)<br />
Accident Trends<br />
226 (15.1%)<br />
Figure 2<br />
• Mechanical/maintenance 223 (15.0%) – accidents arising<br />
204 (14.3%)<br />
from 200 mechanical failure of a component 203 (14.5%) or an error<br />
in maintenance.<br />
202 (15.5%)<br />
219 (15.8%)<br />
Fixed-Wing GA Accidents, 1998 – 2007<br />
150<br />
100<br />
Mechanical accidents<br />
Fatal mechanical accidents<br />
1998 1999 2000 2001 2002 2003 2004 2005 2006 2007<br />
50<br />
Number of Accidents 1654 1655 1574 1486 1465 29 (8.7%) 321498 (10.6%) 31 (10.4%) 35 (11.4%)<br />
1399 1423 241303 (8.4%) 1385 22 (8.2%) 19 (7.5%)<br />
26 (8.8%)<br />
Number of <strong>Aircraft</strong> 1675 1673 1597 1503 1475 1513 1414 1438 22 (7.2%) 1311 16 (5.5%) 1397<br />
0<br />
Flight Hours (millions) 24.3 27.0 26.1 23.6 1998 23.3199923.7 2000 2001 22.9 200221.0 2003 2004 21.5 2005 2006 21.42007<br />
Accident Rate 6.81 6.13 6.03 6.30 6.29 6.32 6.11 6.78 6.06 6.47<br />
Number of Fatal Accidents 335 301 297 299 307 306 286 290 267 252<br />
Fatal Accident Rate 1.38 1.11 1.14 1.27 1.32 1.29 1.25 1.38 1.24 1.18<br />
Fatalities 626 560 527 573 527 576 528 506 497 449<br />
Notes: Collisions are counted as one accident involving<br />
multiple aircraft.<br />
Estimates of total GA activity for 1998 – 2006 have<br />
Figure 1<br />
been revised to exclude commercial operations conducted<br />
under FAR Part 135. Accidents occurring in<br />
Part 135 flights have traditionally been excluded<br />
from the <strong>Nall</strong> <strong>Report</strong>.<br />
45