2008 Nall Report - Aircraft Owners and Pilots Association
2008 Nall Report - Aircraft Owners and Pilots Association
2008 Nall Report - Aircraft Owners and Pilots Association

Create successful ePaper yourself
Turn your PDF publications into a flip-book with our unique Google optimized e-Paper software.
<strong>2008</strong> NALL REPORT<br />
80<br />
70<br />
60<br />
50<br />
40<br />
30<br />
20<br />
10<br />
0<br />
50%<br />
40%<br />
30%<br />
20%<br />
10%<br />
0<br />
100 or less<br />
69.0<br />
Distribution of Time in Type: All Accident <strong>Pilots</strong><br />
51.5<br />
101 - 200<br />
201 - 300<br />
301 - 400<br />
401 - 500<br />
501 - 600<br />
ATPs<br />
Commercial pilots<br />
Private pilots<br />
601 - 700<br />
701 - 800<br />
801 - 900<br />
901 - 1,000<br />
More than 1,000<br />
Figure 16<br />
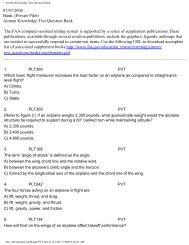
Accidents <strong>and</strong> Fatalities by <strong>Aircraft</strong> Class<br />
73.8<br />
56.9<br />
53.0<br />
Single-engine<br />
fixed-gear<br />
19.1<br />
17.5 18.1<br />
28.2<br />
29.2<br />
Single-engine<br />
retractable-gear<br />
Percent of fleet<br />
Percent of flight time<br />
Percent of all accidents<br />
Percent of fatal accidents<br />
Percent of fatalities<br />
13.5<br />
29.4<br />
8.1<br />
17.8<br />
14.9<br />
Multiengine<br />
Figure 17<br />
Accidents by class of airplane, along with the<br />
percentage of the GA fleet represented by each<br />
class, are shown in Figure 17. In 2007, 14 percent<br />
of SEF accidents were fatal, SER accidents were<br />
double that at 28 percent, <strong>and</strong> ME was 33 percent.<br />
This indicates that as complexity <strong>and</strong> performance<br />
increase, so does lethality, presumably the result<br />
of higher speeds <strong>and</strong> the need for more advanced<br />
piloting skills in the larger aircraft. ME aircraft are<br />
typically operated in a wider range of weather conditions<br />
than the other two classes, accounting for<br />
their relatively high fatality rate. Also, with their<br />
higher performance <strong>and</strong> stall speeds, they are less<br />
forgiving of pilot mistakes.<br />
Type of Operation<br />
General aviation’s versatility is reflected in the wide<br />
variety of operations in which GA aircraft are used,<br />
from recreational <strong>and</strong> personal flying to commercial<br />
operations. Most 2007 GA flying (Figure 18)<br />
was for personal (39.4 percent), instructional (15.2<br />
percent), other working (19.3 percent), <strong>and</strong> business<br />
(14.1 percent) purposes. Detailed definitions for<br />
each type of operation are found in the Appendix.<br />
Accidents in each of the four primary categories of<br />
aircraft use are examined in detail below.<br />
Personal Flying<br />
965 total/186 fatal<br />
In 2007, personal flights accounted for 39.4 percent<br />
of general aviation flying, but a disproportionate<br />
69.1 percent of total accidents <strong>and</strong> a whopping 72.9<br />
percent of fatal accidents. In 2007, 965 accidents,<br />
186 of them fatal, occurred on personal flights.<br />
Consistent with the overall trends in GA accidents,<br />
these figures represented a slight increase over the<br />
938 accidents—but a slight decrease from the 194<br />
fatal accidents—on personal flights in 2006.<br />
Within these totals, there were 710 pilot-related<br />
accidents in personal flying, up from 682 in 2006.<br />
Fatal pilot-related accidents dropped from 151 to<br />
142 during the same period.<br />
Instructional Flying<br />
189 total/15 fatal<br />
Instructional flying provides the training <strong>and</strong> practice<br />
that allows pilots to develop <strong>and</strong> maintain skills,<br />
knowledge, <strong>and</strong> attitudes that directly contribute to<br />
safety. Instructional accidents are proportionately<br />
lower than personal operations due to the closer<br />
supervision provided during flight training. Training,<br />
10 11