2008 Nall Report - Aircraft Owners and Pilots Association
2008 Nall Report - Aircraft Owners and Pilots Association
2008 Nall Report - Aircraft Owners and Pilots Association

Create successful ePaper yourself
Turn your PDF publications into a flip-book with our unique Google optimized e-Paper software.
5% 5%<br />
ACCIDENT ANALYSIS<br />
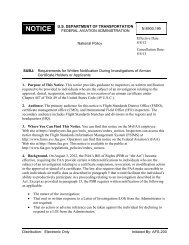
At the other end, commercial pilots with more<br />
than 2,000 hours made up twice as large a share of<br />
the accident group (63 percent) as of the pilot population<br />
(31 percent), <strong>and</strong> they had more than half<br />
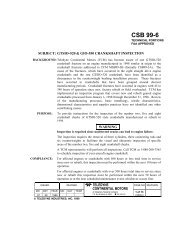
of the fatal accidents. Only 15 percent of all private<br />
pilots reported more than 1,000 hours, but 32 percent<br />
of all accidents <strong>and</strong> 35 percent of fatal accidents<br />
among private pilots occurred in this group.<br />
At the extreme, ATPs with more than 20,000 hours<br />
of flight time made up three <strong>and</strong> a half times as<br />
large a share of accident ATPs as of ATPs in general,<br />
though this may also reflect factors such as age<br />
or lack of recent light-aircraft experience.<br />
Time in Type<br />
Experience in the same make <strong>and</strong> model of aircraft<br />
is widely assumed to reduce risk. However, two<br />
factors complicate this analysis: There is no source<br />
of comparable data for the entire pilot population,<br />
<strong>and</strong> time in type is missing for most of the pilots<br />
involved in fatal accidents. The information that is<br />
available can be used to compare accidents within<br />
certificate level; however, it is not representative<br />
of pilots in general. Time in type for accident pilots<br />
in 2007 appears in Figure 16. Little difference<br />
is apparent between certificate levels, though the<br />
proportion of commercial pilots with less than 200<br />
hours time in type is somewhat smaller than that<br />
of private pilots or ATPs. The high proportion of<br />
accidents that occur in the first 100 hours is partly<br />
due to greater exposure – it’s the only category<br />
that includes time logged by every pilot in every<br />
aircraft – but is so much higher than for the next<br />
100 that it seems likely to reflect genuinely greater<br />
risk as well.<br />
<strong>Aircraft</strong> Class<br />
Another way to study GA accidents is to analyze<br />
the classes of aircraft involved. This report studies<br />
three classes of fixed-wing GA airplanes: singleengine<br />
fixed-gear (SEF), single-engine retractablegear<br />
(SER), <strong>and</strong> multiengine (ME). These classes<br />
are useful because they allow pilots to study safety<br />
issues for the type of aircraft they operate.<br />
0% 0%<br />
2,500 2,500 or or less less<br />
Distribution of Total Flight Time: Commercial <strong>Pilots</strong><br />
40%<br />
35%<br />
30%<br />
25%<br />
20%<br />
15%<br />
10%<br />
5% 5%<br />
0% 0%<br />
80%<br />
70%<br />
60%<br />
50%<br />
40%<br />
30%<br />
20%<br />
10%<br />
2,501 2,501 - - 5,000 5,000<br />
5,001 5,001 - - 7,500 7,500<br />
7,501 7,501 - - 10,000 10,000<br />
15,001 15,001 - - 17,500 17,500<br />
10,001 10,001 - - 12,500 12,500<br />
12,501 12,501 - - 15,000 15,000<br />
All All pilots<br />
All All accident pilots<br />
Fatal accident pilots<br />
500<br />
500<br />
or<br />
or<br />
less<br />
less<br />
501<br />
501<br />
-<br />
-<br />
1,000<br />
1,000<br />
1,001<br />
1,001<br />
-<br />
-<br />
1,500<br />
1,500<br />
1,501<br />
1,501<br />
-<br />
-<br />
2,000<br />
2,000<br />
2,001<br />
2,001<br />
-<br />
-<br />
2,500<br />
2,500<br />
2,501<br />
2,501<br />
-<br />
-<br />
3,000<br />
3,000<br />
3,001<br />
3,001<br />
-<br />
-<br />
4,000<br />
4,000<br />
4,001<br />
4,001<br />
-<br />
-<br />
5,000<br />
5,000<br />
5,001<br />
5,001<br />
-<br />
-<br />
10,000<br />
10,000<br />
More<br />
More<br />
than<br />
than<br />
10,000<br />
10,000<br />
17,501 17,501 - - 20,000 20,000<br />
More More than than 20,000 20,000<br />
Figure 14<br />
Distribution of Total Flight Time: Private <strong>Pilots</strong><br />
All All pilots<br />
All All accident pilots<br />
Fatal accident pilots<br />
0% 0%<br />
500 500 or or less less<br />
501 501 - - 1,000 1,000<br />
1,001 1,001 - - 1,500 1,500<br />
1,501 1,501 - - 2,000 2,000<br />
2,001 2,001 - - 2,500 2,500<br />
2,501 2,501 - - 3,000 3,000<br />
3,001 3,001 - - 4,000 4,000<br />
4,001 4,001 - - 5,000 5,000<br />
More More than than 5,000 5,000<br />
Figure 15<br />
9