2008 Nall Report - Aircraft Owners and Pilots Association
2008 Nall Report - Aircraft Owners and Pilots Association
2008 Nall Report - Aircraft Owners and Pilots Association

You also want an ePaper? Increase the reach of your titles
YUMPU automatically turns print PDFs into web optimized ePapers that Google loves.
Business<br />
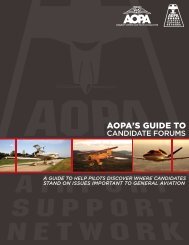
<strong>2008</strong> NALL REPORT<br />
Other*<br />
14.1%<br />
3.1% (44)<br />
4.3% (11)<br />
5.0%<br />
3.9% (54)<br />
4.3% (11)<br />
19.3%<br />
20.4%<br />
25.0%<br />
0 10 20 30 40 50 60 70 80<br />
Commercial<br />
Private<br />
Sport<br />
Student<br />
None<br />
Other/unknown<br />
CFI on board*<br />
IFR pilot on board*<br />
Second pilot on board<br />
25.9%<br />
ATP<br />
11.7% (163)<br />
13.7% (35)<br />
20.7%<br />
29.2% (408)<br />
29.8% (76)<br />
37.9%<br />
0.4%<br />
1.1% (16)<br />
1.6% (4)<br />
15.1%<br />
8.2% (115)<br />
2.0% (5)<br />
1.4% (19)<br />
1.6% (4)<br />
0.6% (8)<br />
1.2(3)<br />
Levels of Pilot Certificates<br />
19.4% (271)<br />
15.7% (40)<br />
10.5% (147)<br />
13.7% (35)<br />
Percent of pilots<br />
47.8% (668)<br />
50.2% (128)<br />
Percent of all accidents<br />
Percent of fatal accidents<br />
47.2% (660)<br />
45.5% (116)<br />
0 10 20 30 40 50 60<br />
* Includes single-pilot accidents.<br />
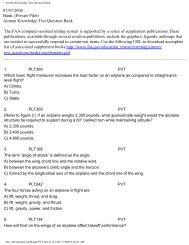
Figure 12<br />
Pilot Experience <strong>and</strong> Qualifications<br />
Total flight experience varies widely by the type of<br />
pilot’s certificate held. Fewer than 10 percent of<br />
private pilots meet the 1,500 hour requirement to<br />
become an ATP. Since accident involvement also<br />
differs between certificate levels, each certificate is<br />
analyzed separately.<br />
Certificate Level<br />
Student <strong>and</strong> airline transport pilot (ATP) certificate<br />
holders were involved in disproportionately<br />
few accidents in 2007 (Figure 12). Possible explanations<br />
include the high level of supervision<br />
of student pilots <strong>and</strong> the greater proficiency <strong>and</strong><br />
experience of ATP pilots, who also typically fly<br />
more capable equipment. The great majority of<br />
accidents occurred in single-pilot flights, but without<br />
exposure data it is not clear whether this is<br />
disproportionate. The generally accepted wisdom<br />
is that two pilots lower accident involvement. The<br />
pilot-in-comm<strong>and</strong>, a second pilot, or both were<br />
instrument-rated on almost half the accident<br />
flights, which generally corresponds to the number<br />
of instrument-rated pilots in the population.<br />
25%<br />
Mechanical<br />
failures<br />
Other<br />
Fuel<br />
management<br />
20%<br />
Weather<br />
Preflight<br />
<strong>and</strong> taxi<br />
Takeoff<br />
15% <strong>and</strong> climb<br />
Cruise<br />
10% Maneuvering<br />
Descent/<br />
approach<br />
5% Go-around<br />
L<strong>and</strong>ing<br />
0% Collisions<br />
Pilot<br />
incapacitation<br />
2,500 or less<br />
40%<br />
15.8% (219)<br />
7.5% 8.7%<br />
(19)<br />
Distribution of Total Flight Time: ATPs<br />
2,501 - 5,000<br />
6.5% (90)<br />
3.6% (9)<br />
10.0%<br />
12.3% (170)<br />
16.7% (42)<br />
24.7%<br />
3.6% (50)<br />
16.3% (41)<br />
2.8% (39)<br />
1.2% (3)<br />
7.7%<br />
11.7% (162)<br />
11.9% (30)<br />
18.5%<br />
1.0% (14)<br />
2.8% (7)<br />
Percent of all accidents<br />
Percent of fatal accidents<br />
All pilots<br />
Lethality percent<br />
All accident pilots<br />
50.0%<br />
6.6% (91)<br />
20.2% (51)<br />
56.0%<br />
4.4% (61)<br />
8.7% (22)<br />
2.9% (40)<br />
3.6% (9)<br />
3.2% (8)<br />
1.9%<br />
1.0% (14)<br />
1.6% (4)<br />
0.9% (12)<br />
2.8% (7)<br />
36.1%<br />
22.5%<br />
30.5% (423)<br />
28.6%<br />
Fatal accident pilots<br />
58.3%<br />
82.0%<br />
0 20 40 60 80 100<br />
5,001 - 7,500<br />
7,501 - 10,000<br />
10,001 - 12,500<br />
12,501 - 15,000<br />
15,001 - 17,500<br />
17,501 - 20,000<br />
More than 20,000<br />
Figure 13<br />
Flight Hours<br />
Figure 13 presents the total flight time reported by<br />
all active U.S. pilots holding ATP certificates, all<br />
ATPs involved in GA accidents in 2007, <strong>and</strong> those<br />
involved in fatal accidents. Figures 14 <strong>and</strong> 15 display<br />
similar information for commercial pilots <strong>and</strong><br />
private pilots, respectively. The sources of these<br />
data <strong>and</strong> limitations on their interpretation are described<br />
in the Appendix.<br />
The high proportion of accidents involving relatively<br />
inexperienced pilots is largely explained by<br />
the high numbers of pilots at those experience<br />
levels. Most private pilots have less than 500 hours<br />
total time (71 percent claimed 500 hours or less on<br />
their last medical application) but this group had<br />
only 49 percent of all accidents <strong>and</strong> only 38 percent<br />
of fatal accidents. Thirty-five percent of all commercial<br />
pilots reported 500 hours or less, yet these<br />
had only 8 percent of total accidents <strong>and</strong> 14 percent<br />
of fatal accidents. However, it must be noted<br />
that data comparing total flight time to recent GA<br />
experience aren’t consistently available, so it’s not<br />
clear whether lower-time pilots were less exposed<br />
to the risk of accidents because they did less flying.<br />
35%<br />
30%<br />
25%<br />
All pilots<br />
All accident pilots<br />
Fatal accident pilots<br />
89