Joseph T. Nall Report - Aircraft Owners and Pilots Association
Joseph T. Nall Report - Aircraft Owners and Pilots Association
Joseph T. Nall Report - Aircraft Owners and Pilots Association

Create successful ePaper yourself
Turn your PDF publications into a flip-book with our unique Google optimized e-Paper software.
Overview<br />
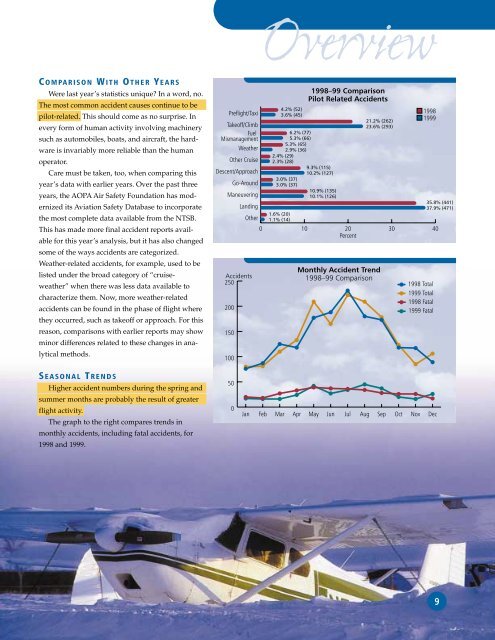
C OMPARISON W ITH O THER Y EARS<br />
Were last year’s statistics unique? In a word, no.<br />
The most common accident causes continue to be<br />
pilot-related. This should come as no surprise. In<br />
every form of human activity involving machinery<br />
such as automobiles, boats, <strong>and</strong> aircraft, the hardware<br />
is invariably more reliable than the human<br />
operator.<br />
Care must be taken, too, when comparing this<br />
year’s data with earlier years. Over the past three<br />
years, the AOPA Air Safety Foundation has modernized<br />
its Aviation Safety Database to incorporate<br />
the most complete data available from the NTSB.<br />
This has made more final accident reports available<br />
for this year’s analysis, but it has also changed<br />
some of the ways accidents are categorized.<br />
Weather-related accidents, for example, used to be<br />
listed under the broad category of “cruiseweather”<br />
when there was less data available to<br />
characterize them. Now, more weather-related<br />
accidents can be found in the phase of flight where<br />
they occurred, such as takeoff or approach. For this<br />
reason, comparisons with earlier reports may show<br />
minor differences related to these changes in analytical<br />
methods.<br />
Preflight/Taxi<br />
Takeoff/Climb<br />
Fuel<br />
Mismanagement<br />
Weather<br />
Other Cruise<br />
Descent/Approach<br />
Go-Around<br />
Maneuvering<br />
L<strong>and</strong>ing<br />
Other<br />
Accidents<br />
250<br />
200<br />
150<br />
100<br />
4.2% (52)<br />
3.6% (45)<br />
6.2% (77)<br />
5.3% (66)<br />
5.3% (65)<br />
2.9% (36)<br />
2.4% (29)<br />
2.3% (28)<br />
9.3% (115)<br />
10.2% (127)<br />
3.0% (37)<br />
3.0% (37)<br />
10.9% (135)<br />
10.1% (126)<br />
1.6% (20)<br />
1.1% (14)<br />
1998–99 Comparison<br />
Pilot Related Accidents<br />
21.2% (262)<br />
23.6% (293)<br />
1998<br />
1999<br />
35.8% (441)<br />
37.9% (471)<br />
0 10 20 30 40<br />
Percent<br />
Monthly Accident Trend<br />
1998–99 Comparison<br />
1998 Total<br />
1999 Total<br />
1998 Fatal<br />
1999 Fatal<br />
S EASONAL T RENDS<br />
Higher accident numbers during the spring <strong>and</strong><br />
summer months are probably the result of greater<br />
flight activity.<br />
The graph to the right compares trends in<br />
monthly accidents, including fatal accidents, for<br />
1998 <strong>and</strong> 1999.<br />
50<br />
0<br />
Jan<br />
Feb<br />
Mar<br />
Apr<br />
May<br />
Jun<br />
Jul<br />
Aug<br />
Sep<br />
Oct<br />
Nov<br />
Dec<br />
9