Joseph T. Nall Report - Aircraft Owners and Pilots Association
Joseph T. Nall Report - Aircraft Owners and Pilots Association
Joseph T. Nall Report - Aircraft Owners and Pilots Association

Create successful ePaper yourself
Turn your PDF publications into a flip-book with our unique Google optimized e-Paper software.
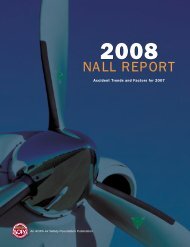
Overview<br />
Overview of Accident Trends<br />
<strong>and</strong> Factors for 1999<br />
1999 STATISTICS<br />
The FAA’s estimate of flight hours increased<br />
from 26.8 million in 1998 to 27.1 million in 1999.<br />
The GA accident rate per 100,000 flying hours<br />
declined slightly in 1999 compared to previous<br />
years because the number of accidents remained<br />
10<br />
8<br />
US General Aviation Accidents<br />
Per 100,000 Hours<br />
Total<br />
Fatal<br />
7.05<br />
fairly steady despite a higher number of hours<br />
flown that year.<br />
6<br />
The GA accident statistics below are derived<br />
from NTSB accident reports. To make this report<br />
4<br />
more timely, a small number of preliminary reports<br />
(19.3 percent) were analyzed <strong>and</strong> these may cause<br />
2<br />
1.26<br />
minor fluctuations in the data once final reports<br />
are completed.<br />
0<br />
1989<br />
1990<br />
1991<br />
1992<br />
1993<br />
1994<br />
1995<br />
1996<br />
1997<br />
1998<br />
1999<br />
A CCIDENT S TATISTICS<br />
Past Nine Years<br />
1991 1992 1993 1994 1995 1996 1997 1998 1999<br />
Total fixed-wing GA accidents 1,897 1,837 1,808 1,741 1,853 1,781 1,642 1,679 1,701<br />
Fatal fixed-wing GA accidents 394 407 360 354 383 355 331 341 320<br />
Total fixed-wing GA fatalities 724 798 652 641 679 653 667 619 632<br />
Estimated GA flight hours 27.2M 24.8M 22.8M 22.2M 24.9M 24.9M 25.5M 26.8M 27.1M<br />
7