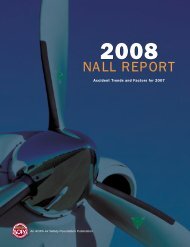
Joseph T. Nall Report - Aircraft Owners and Pilots Association
Joseph T. Nall Report - Aircraft Owners and Pilots Association
Joseph T. Nall Report - Aircraft Owners and Pilots Association

You also want an ePaper? Increase the reach of your titles
YUMPU automatically turns print PDFs into web optimized ePapers that Google loves.
Analysis<br />
Analysis<br />
I NTERPRETING AVIATION A CCIDENT<br />
S TATISTICS<br />
Everyone has heard about “the accident rate,”<br />
but what does that really mean? How do we compare<br />
statistics <strong>and</strong> arrive at conclusions?<br />
To be meaningful, comparisons must be based<br />
upon equal exposure to risk. However, this alone<br />
does not determine total risk. Reduction factors<br />
such as experience, proficiency, equipment, <strong>and</strong><br />
flight conditions can have significant positive<br />
safety impact.<br />
To compare different airplanes, pilots, types of<br />
operations, etc., in terms of their accident involvement,<br />
we must first level the playing field in terms<br />
of exposure to risk. Statisticians call this normalizing.<br />
The most common way to normalize factors<br />
for aviation safety is to compare accidents per<br />
100,000 flight hours.<br />
This report uses percentages to show which<br />
portions of accidents were attributed to particular<br />
causes, as well as which portions of accident<br />
sequences began in a particular phase of flight.<br />
These figures may be used to estimate conditional<br />
probabilities. In other words, given an accident<br />
that has occurred, what is the probability that it<br />
was the result of weather, stall/spin, etc.? This<br />
type of analysis makes it easier to identify <strong>and</strong> concentrate<br />
on the accident factors that carry the greatest<br />
risk. Caution must be used in interpreting<br />
percentages based on small numbers of events.<br />
When this is the case a small number warning will<br />
be associated with the data.<br />
In some areas, the relative magnitude of data is<br />
more important than the absolute number.<br />
S EQUENCE OF E VENTS AND<br />
A CCIDENT C AUSALITY<br />
In its studies of accidents involving large transport-category<br />
aircraft, the Boeing Commercial<br />
Airplane Company found that most accidents<br />
result from a sequence of events rather than a single<br />
catastrophic event. Boeing’s research identified<br />
as many as 20 events in the course of a single flight<br />
that had a direct impact upon the outcome. The<br />
National Transportation Safety Board (NTSB) uses<br />
a similar method to break down each accident into<br />
“occurrences.”<br />
In this report, the emphasis is on identifying the<br />
phase of flight in which the sequence of events<br />
began, often referred to as the “first occurrence,”<br />
<strong>and</strong> on the types of problems encountered by the<br />
pilots. The objective is to find lessons that can be<br />
used to prevent future accidents.<br />
This report uses a simple, single-cause/factor<br />
classification scheme. These analyses are based on<br />
a combination of fully investigated final <strong>and</strong> factual<br />
reports from the NTSB. If these reports were<br />
not available, preliminary reports, describing the<br />
accident <strong>and</strong> providing basic descriptive data,<br />
were used.<br />
6