Joseph T. Nall Report - Aircraft Owners and Pilots Association
Joseph T. Nall Report - Aircraft Owners and Pilots Association
Joseph T. Nall Report - Aircraft Owners and Pilots Association

You also want an ePaper? Increase the reach of your titles
YUMPU automatically turns print PDFs into web optimized ePapers that Google loves.
Pilot Involvement<br />
Preflight/Taxi<br />
Takeoff/Climb<br />
Fuel Mismanagement<br />
Weather<br />
Other Cruise<br />
Descent<br />
Approach<br />
Go-Around<br />
Maneuvering<br />
L<strong>and</strong>ing<br />
Other<br />
3.6% (45)<br />
0.5% (1)<br />
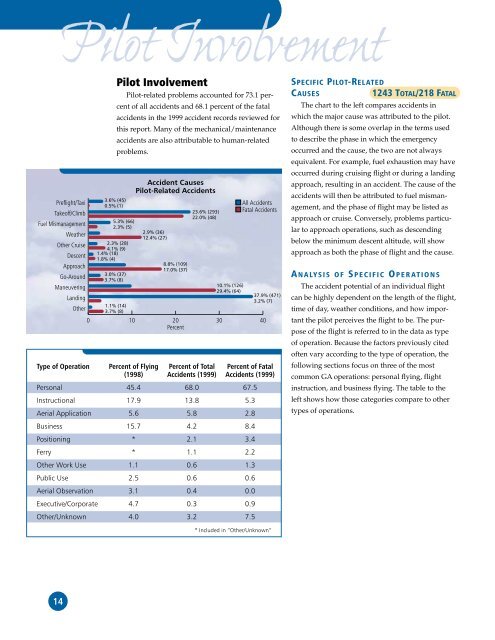
Pilot Involvement<br />
Pilot-related problems accounted for 73.1 percent<br />
of all accidents <strong>and</strong> 68.1 percent of the fatal<br />
accidents in the 1999 accident records reviewed for<br />
this report. Many of the mechanical/maintenance<br />
accidents are also attributable to human-related<br />
problems.<br />
5.3% (66)<br />
2.3% (5)<br />
2.3% (28)<br />
4.1% (9)<br />
1.4% (18)<br />
1.8% (4)<br />
3.0% (37)<br />
3.7% (8)<br />
1.1% (14)<br />
3.7% (8)<br />
Accident Causes<br />
Pilot-Related Accidents<br />
2.9% (36)<br />
12.4% (27)<br />
8.8% (109)<br />
17.0% (37)<br />
23.6% (293)<br />
22.0% (48)<br />
10.1% (126)<br />
29.4% (64)<br />
0 10 20 30 40<br />
Percent<br />
Type of Operation Percent of Flying Percent of Total Percent of Fatal<br />
(1998) Accidents (1999) Accidents (1999)<br />
Personal 45.4 68.0 67.5<br />
Instructional 17.9 13.8 5.3<br />
Aerial Application 5.6 5.8 2.8<br />
Business 15.7 4.2 8.4<br />
Positioning * 2.1 3.4<br />
Ferry * 1.1 2.2<br />
Other Work Use 1.1 0.6 1.3<br />
Public Use 2.5 0.6 0.6<br />
Aerial Observation 3.1 0.4 0.0<br />
Executive/Corporate 4.7 0.3 0.9<br />
Other/Unknown 4.0 3.2 7.5<br />
All Accidents<br />
Fatal Accidents<br />
37.9% (471)<br />
3.2% (7)<br />
SPECIFIC PILOT-RELATED<br />
CAUSES<br />
1243 TOTAL/218 FATAL<br />
The chart to the left compares accidents in<br />
which the major cause was attributed to the pilot.<br />
Although there is some overlap in the terms used<br />
to describe the phase in which the emergency<br />
occurred <strong>and</strong> the cause, the two are not always<br />
equivalent. For example, fuel exhaustion may have<br />
occurred during cruising flight or during a l<strong>and</strong>ing<br />
approach, resulting in an accident. The cause of the<br />
accidents will then be attributed to fuel mismanagement,<br />
<strong>and</strong> the phase of flight may be listed as<br />
approach or cruise. Conversely, problems particular<br />
to approach operations, such as descending<br />
below the minimum descent altitude, will show<br />
approach as both the phase of flight <strong>and</strong> the cause.<br />
A NALYSIS OF S PECIFIC O PERATIONS<br />
The accident potential of an individual flight<br />
can be highly dependent on the length of the flight,<br />
time of day, weather conditions, <strong>and</strong> how important<br />
the pilot perceives the flight to be. The purpose<br />
of the flight is referred to in the data as type<br />
of operation. Because the factors previously cited<br />
often vary according to the type of operation, the<br />
following sections focus on three of the most<br />
common GA operations: personal flying, flight<br />
instruction, <strong>and</strong> business flying. The table to the<br />
left shows how those categories compare to other<br />
types of operations.<br />
* Included in “Other/Unknown”<br />
14