annual report and accounts 2012 - RSPB
annual report and accounts 2012 - RSPB
annual report and accounts 2012 - RSPB

You also want an ePaper? Increase the reach of your titles
YUMPU automatically turns print PDFs into web optimized ePapers that Google loves.
<strong>RSPB</strong> trustees’ <strong>report</strong> <strong>and</strong> <strong>accounts</strong> 2011-12<br />
Notes to the <strong>accounts</strong><br />
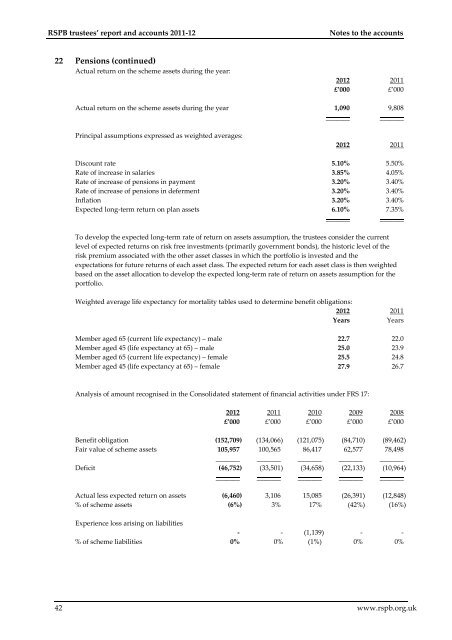
22 Pensions (continued)<br />
Actual return on the scheme assets during the year:<br />
<strong>2012</strong>)<br />
£’000(<br />
2011)<br />
£’000(<br />
Actual return on the scheme assets during the year 1,090) 9,808)<br />
_______( _______(<br />
Principal assumptions expressed as weighted averages:<br />
<strong>2012</strong>) 2011)<br />
Discount rate 5.10%) 5.50%)<br />
Rate of increase in salaries 3.85%) 4.05%)<br />
Rate of increase of pensions in payment 3.20%) 3.40%)<br />
Rate of increase of pensions in deferment 3.20%) 3.40%)<br />
Inflation 3.20%) 3.40%)<br />
Expected long-term return on plan assets 6.10%) 7.35%)<br />
_______( _______(<br />
To develop the expected long-term rate of return on assets assumption, the trustees consider the current<br />
level of expected returns on risk free investments (primarily government bonds), the historic level of the<br />
risk premium associated with the other asset classes in which the portfolio is invested <strong>and</strong> the<br />
expectations for future returns of each asset class. The expected return for each asset class is then weighted<br />
based on the asset allocation to develop the expected long-term rate of return on assets assumption for the<br />
portfolio.<br />
Weighted average life expectancy for mortality tables used to determine benefit obligations:<br />
<strong>2012</strong>) 2011)<br />
Years)<br />
Years)<br />
Member aged 65 (current life expectancy) – male 22.7) 22.0)<br />
Member aged 45 (life expectancy at 65) – male 25.0) 23.9)<br />
Member aged 65 (current life expectancy) – female 25.5) 24.8)<br />
Member aged 45 (life expectancy at 65) – female 27.9) 26.7)<br />
Analysis of amount recognised in the Consolidated statement of financial activities under FRS 17:<br />
<strong>2012</strong>) 2011) 2010) 2009) 2008)<br />
£’000) £’000( £’000( £’000( £’000)<br />
Benefit obligation (152,709) (134,066) (121,075) (84,710) (89,462)<br />
Fair value of scheme assets 105,957) 100,565) 86,417) 62,577) 78,498)<br />
_______) _______) _______) _______) _______)<br />
Deficit (46,752) (33,501) (34,658) (22,133) (10,964)<br />
_______( _______( _______( _______( _______(<br />
Actual less expected return on assets (6,460) 3,106) 15,085) (26,391) (12,848)<br />
% of scheme assets (6%) 3%) 17%) (42%) (16%)<br />
Experience loss arising on liabilities<br />
-) - (1,139) -) -)<br />
% of scheme liabilities 0%) 0% (1%)) 0%) 0%)<br />
42 www.rspb.org.uk