Development of the automotive supplier industry in ... - Roland Berger
Development of the automotive supplier industry in ... - Roland Berger
Development of the automotive supplier industry in ... - Roland Berger

You also want an ePaper? Increase the reach of your titles
YUMPU automatically turns print PDFs into web optimized ePapers that Google loves.
MOSCOW<br />
WARSAW<br />
PRAGUE<br />
VIENNA BRATISLAVA<br />
BUDAPEST<br />
LJUBLJANA ZAGREB<br />
KIEV<br />
BELGRADE<br />
BUCHAREST<br />
SKOPJE<br />
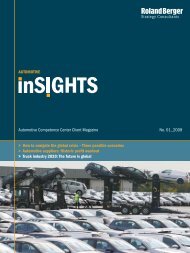
<strong>Development</strong> <strong>of</strong> <strong>the</strong> <strong>automotive</strong><br />
<strong>supplier</strong> <strong><strong>in</strong>dustry</strong> <strong>in</strong> Eastern Europe<br />
<strong>Roland</strong> <strong>Berger</strong> study – Summary<br />
Vienna, April 2007<br />
VIE-9800-97000-803-129 1
VIE-9800-97000-803-129<br />
2<br />
Contents<br />
Page<br />
A. Study objectives and methodology 3<br />
Over 380 <strong>supplier</strong>s <strong>in</strong> <strong>the</strong> EE region are benchmarked<br />
B. The EE <strong>supplier</strong> <strong><strong>in</strong>dustry</strong> <strong>in</strong> a global context 7<br />
Major growth region benefit<strong>in</strong>g from global trends<br />
C. Detailed <strong><strong>in</strong>dustry</strong> analysis for EE 11<br />
High growth and economic relevance but moderate<br />
domestic performance<br />
D. Summary and conclusions<br />
Need to act to streng<strong>the</strong>n <strong>the</strong> domestic supply base 22<br />
Authors and contact 25<br />
This document was created for <strong>the</strong> exclusive use <strong>of</strong> our clients. It is not complete unless supported by <strong>the</strong> underly<strong>in</strong>g detailed analyses and oral presentation. It must not<br />
be passed on to third parties except with <strong>the</strong> explicit prior consent <strong>of</strong> <strong>Roland</strong> <strong>Berger</strong> Strategy Consultants.
A. Study objectives and methodology<br />
Over 380 <strong>supplier</strong>s <strong>in</strong> <strong>the</strong> EE region are benchmarked<br />
VIE-9800-97000-803-129 3
Source: <strong>Roland</strong> <strong>Berger</strong><br />
VIE-9800-97000-803-129<br />
4<br />
The basis for <strong>the</strong> study are ten countries <strong>in</strong> CEE and SEE<br />
Study focus: Eastern Europe (EE)<br />
• (Austria – AT) 1)<br />
• Czech Republic – CZ<br />
• Hungary – HU<br />
• Poland – PL<br />
• Slovakia – SK<br />
• Slovenia – SI<br />
CEE<br />
CZ<br />
AT<br />
SI<br />
HR<br />
PL<br />
SK<br />
HU<br />
RO<br />
RS<br />
MK<br />
• Croatia –HR<br />
• Macedonia – MK<br />
• Romania – RO<br />
• Serbia – RS<br />
Comments<br />
SEE<br />
• Also comparison <strong>of</strong> macro-trends<br />
and OEM developments <strong>in</strong> CIS<br />
(Russia, Ukra<strong>in</strong>e) and Turkey<br />
• Analysis <strong>of</strong> study based on median<br />
1) As comparison; macro-economically strongly <strong>in</strong>tegrated with CEE
Source: <strong>Roland</strong> <strong>Berger</strong><br />
VIE-9800-97000-803-129<br />
5<br />
In total, more than 380 <strong>automotive</strong> <strong>supplier</strong>s have been analyzed <strong>in</strong><br />
<strong>the</strong> EE region<br />
Overview sample<br />
Split by country Split by sales volume [EUR m] Split by product segments 1)<br />
∑ = 383<br />
∑ = 383 ∑ = 383<br />
Slovenia<br />
Austria<br />
Slovakia<br />
Croatia<br />
5% 6%<br />
Serbia 8%<br />
5%<br />
9%<br />
7%<br />
28%<br />
Romania<br />
100-<br />
250<br />
250-500<br />
16%<br />
500-<br />
1,000<br />
9%<br />
3%<br />
> 1,000<br />
2%<br />
Powertra<strong>in</strong><br />
19%<br />
Tires<br />
4%<br />
Chassis<br />
19%<br />
3%<br />
Complete<br />
Vehicles<br />
Poland<br />
21%<br />
8%<br />
Hungary<br />
2%<br />
Macedonia<br />
Czech<br />
Republic<br />
72%<br />
< 100<br />
Interior<br />
27%<br />
17%<br />
11%<br />
Exterior<br />
Electrics<br />
1) Primary product segment def<strong>in</strong>ed as product with highest revenues
Source: <strong>Roland</strong> <strong>Berger</strong><br />
VIE-9800-97000-803-129<br />
6<br />
In mature markets <strong>the</strong> <strong>automotive</strong> <strong><strong>in</strong>dustry</strong> is dom<strong>in</strong>ated by foreign<br />
subsidiaries<br />
Share <strong>of</strong> foreign subsidiaries per country [% <strong>in</strong> sample]<br />
# companies<br />
<strong>in</strong> study<br />
31 81 35 23 109 20 7 31 20 26<br />
Share <strong>of</strong><br />
domestic<br />
companies<br />
6<br />
15<br />
26 30 33<br />
50<br />
57<br />
65<br />
85 88<br />
Share <strong>of</strong><br />
foreign<br />
subsidiaries<br />
94<br />
85<br />
74 70 67<br />
50<br />
43<br />
35<br />
15 12<br />
HU PL RO AT CZ SI MK SK HR RS
B. The EE <strong>supplier</strong> <strong><strong>in</strong>dustry</strong> <strong>in</strong> a global context<br />
Major growth region benefit<strong>in</strong>g from global trends<br />
VIE-9800-97000-803-129 7
Source: JD Power, <strong>Roland</strong> <strong>Berger</strong><br />
VIE-9800-97000-803-129<br />
8<br />
ROLE OF EE<br />
Grow<strong>in</strong>g relevance <strong>of</strong> Eastern Europe <strong>in</strong> global <strong>automotive</strong><br />
<strong><strong>in</strong>dustry</strong> – But no match with growth <strong>in</strong> Asia<br />
Global vehicle sales [%] Global vehicle production [%]<br />
2005 2013 2005 2013<br />
SA ROW<br />
7%<br />
EE 2) 4%<br />
6%<br />
NA<br />
31%<br />
ROW<br />
SA<br />
7% NA<br />
EE 2) 4%<br />
8%<br />
25%<br />
ROW<br />
ROW<br />
2% NA<br />
3%<br />
EE 2) 4%<br />
EE 2) 5%<br />
7%<br />
25%<br />
10%<br />
NA<br />
20%<br />
Asia 17%<br />
9%<br />
Japan<br />
26%<br />
WE 1)<br />
Asia<br />
26%<br />
7%<br />
Japan<br />
22%<br />
WE 1)<br />
Asia<br />
21%<br />
16%<br />
Japan<br />
25%<br />
WE 1)<br />
Asia<br />
29%<br />
13%<br />
Japan<br />
21%<br />
WE 1)<br />
• Economic growth drives vehicle demand <strong>in</strong><br />
emerg<strong>in</strong>g markets<br />
• But Asia by far outperforms all o<strong>the</strong>rs, also EE<br />
• Production has already strongly shifted towards<br />
emerg<strong>in</strong>g markets – significantly before demand<br />
• Future build-up also mostly <strong>in</strong> <strong>the</strong>se regions<br />
1) Western Europe 2) Eastern Europe
Source: JD Power, <strong>Roland</strong> <strong>Berger</strong><br />
VIE-9800-97000-803-129<br />
9<br />
TRENDS IN EE<br />
Significant long term growth and <strong><strong>in</strong>dustry</strong> trends favor <strong>in</strong>vestment<br />
<strong>in</strong> Eastern Europe<br />
Vehicle sales [m units]<br />
Industry trends <strong>in</strong> Eastern Europe<br />
CIS<br />
1.9<br />
7%<br />
3.4<br />
Kunden Customers<br />
• Grow<strong>in</strong>g local demand (esp. Poland, Czech<br />
Rep., Bulgaria and Russia – more than 8%)<br />
• Expectations towards quality and safety<br />
CEE<br />
8%<br />
1.5<br />
0.8<br />
05 13<br />
SEE<br />
7%<br />
0.3 0.4<br />
05 13<br />
TR<br />
05 13<br />
0.7<br />
6%<br />
1.1<br />
05 13<br />
OEMs OEMs<br />
Suppliers<br />
Raw<br />
material<br />
• Regional share <strong>of</strong> Asian OEMs grows to 24%<br />
• Production <strong>in</strong>creases <strong>of</strong> 9% p.a. <strong>in</strong> Eastern<br />
Europe<br />
• Additional capacities <strong>of</strong> 6% p.a. <strong>in</strong> CEE<br />
compared to 5% <strong>in</strong> <strong>the</strong> EE<br />
• Pressure due to local content<br />
• Shift from CEE to Russia and Turkey<br />
• Asian <strong>supplier</strong>s develop local footpr<strong>in</strong>t<br />
• Grow<strong>in</strong>g impact <strong>of</strong> Russia on entire region<br />
• Competition <strong>of</strong> resources with Ch<strong>in</strong>a
Source: JD Power, <strong>Roland</strong> <strong>Berger</strong><br />
VIE-9800-97000-803-129<br />
10<br />
TRENDS IN EE<br />
Dom<strong>in</strong>ance <strong>of</strong> EU countries <strong>in</strong> production relative to sales <strong>in</strong><br />
Eastern Europe<br />
Vehicle sales <strong>in</strong> Eastern Europe [%]<br />
Vehicle production <strong>in</strong> Eastern Europe [%]<br />
2005 2013 2005 2013<br />
SEE<br />
TR<br />
9%<br />
19%<br />
CEE 22%<br />
PL<br />
CZ<br />
8 SK<br />
4%<br />
6% HU<br />
2% SI SEE<br />
2%<br />
TR<br />
17%<br />
7%<br />
CEE 23% CEE 40% CEE 41%<br />
PL<br />
CZ<br />
11% SK<br />
5%<br />
2% 4% HU<br />
1% SI SEE<br />
PL<br />
TR<br />
TR<br />
20% 14%<br />
16%<br />
5%<br />
14% CZ SEE 4%<br />
PL<br />
12%<br />
13% CZ<br />
50%<br />
CIS<br />
53%<br />
CIS<br />
35%<br />
CIS<br />
4% 4% SK<br />
4% HU<br />
SI<br />
39%<br />
CIS<br />
10%<br />
2% SK<br />
4%<br />
HU<br />
SI<br />
• Half <strong>of</strong> vehicle sales accounted for by CIS region<br />
• Relevance <strong>of</strong> Russia and Poland <strong>in</strong>creases until<br />
2013 due to <strong>in</strong>creas<strong>in</strong>g purchas<strong>in</strong>g power<br />
• EU region will also be <strong>the</strong> biggest vehicle <strong>supplier</strong> for<br />
<strong>the</strong> region <strong>in</strong> 2013 followed by CIS region<br />
• Strong <strong><strong>in</strong>dustry</strong> build up <strong>in</strong> Slovakia and Russia
C. Detailed <strong><strong>in</strong>dustry</strong> analysis for EE<br />
High growth and economic relevance but moderate<br />
domestic performance<br />
VIE-9800-97000-803-129 11
Source: <strong>Roland</strong> <strong>Berger</strong><br />
VIE-9800-97000-803-129<br />
12<br />
<strong>Development</strong> <strong>of</strong> <strong>supplier</strong> <strong><strong>in</strong>dustry</strong> has important knock-on effects<br />
for countries <strong>in</strong> EE<br />
Importance <strong>of</strong> <strong>supplier</strong> <strong><strong>in</strong>dustry</strong> for countries<br />
Direct economic effects<br />
• Increase <strong>in</strong> employment<br />
• Growth <strong>of</strong> GDP<br />
• Receipts <strong>of</strong> foreign direct <strong>in</strong>vestment<br />
• Participation <strong>in</strong> value creation through tax receipts<br />
• Favorable trade balance<br />
Know how effects<br />
• Transfer <strong>of</strong> <strong><strong>in</strong>dustry</strong> specific know how<br />
• Installation <strong>of</strong> management best practice through<br />
foreign companies<br />
• Positive learn<strong>in</strong>g effects for o<strong>the</strong>r high value<br />
<strong>in</strong>dustries<br />
Indirect network effects<br />
• Positive developments <strong>of</strong> related <strong>in</strong>dustries<br />
(e.g. materials, logistics, construction)<br />
• Active shap<strong>in</strong>g and participation <strong>of</strong> future supply<br />
<strong><strong>in</strong>dustry</strong> <strong>in</strong> develop<strong>in</strong>g countries fur<strong>the</strong>r east<br />
Structural effects<br />
• Enhancement <strong>of</strong> <strong>in</strong>frastructure and facilities<br />
• Image effects<br />
• Reth<strong>in</strong>k<strong>in</strong>g <strong>of</strong> country value proposition to attract<br />
<strong>in</strong>vestments<br />
• Possibilities for privatization
Source: Eurostat, CE-Research 2006, WKÖ, JD Power, <strong>Roland</strong> <strong>Berger</strong><br />
VIE-9800-97000-803-129<br />
13<br />
The ma<strong>in</strong> drivers for <strong>the</strong> build up <strong>of</strong> <strong>the</strong> <strong>supplier</strong> <strong><strong>in</strong>dustry</strong> are low<br />
labor costs and <strong>in</strong>creas<strong>in</strong>g OEM production<br />
Trade balance <strong>of</strong> vehicle parts and accessories <strong>of</strong> 2000-2005 [EUR bn]<br />
2.5<br />
2<br />
1.5<br />
Exports > Imports<br />
Czech<br />
Republic<br />
Labor<br />
costs<br />
[EUR/h]<br />
OEM production<br />
[CAGR<br />
00-05]<br />
6.7 8%<br />
1<br />
0.5<br />
0<br />
-0.5<br />
-1<br />
-1.5<br />
Hungary<br />
Poland<br />
Slovenia<br />
Slovakia<br />
Imports > Exports<br />
Austria<br />
2000 2001 2002 2003 2004 2005<br />
6.8 2%<br />
5.7 0%<br />
12.1 8%<br />
4.7 0%<br />
21.1 15%
Source: <strong>Roland</strong> <strong>Berger</strong><br />
VIE-9800-97000-803-129<br />
14<br />
High sales growth across <strong>the</strong> region but <strong>in</strong>ternational subsidiaries<br />
outperform<strong>in</strong>g domestic <strong>supplier</strong>s<br />
Differences <strong>in</strong> <strong>automotive</strong> <strong>supplier</strong> growth [sales growth %]<br />
Regional<br />
differentiation<br />
Country<br />
differentiation<br />
• Regard<strong>in</strong>g sales growth <strong>supplier</strong>s <strong>in</strong> EE outperformed all <strong>the</strong> o<strong>the</strong>r global<br />
regions <strong>in</strong> 2000 and 2005<br />
• In l<strong>in</strong>e with global trends, sales growth decl<strong>in</strong>ed by 0.4 pts. <strong>in</strong> EE <strong>in</strong> <strong>the</strong><br />
same period – exceptions are <strong>supplier</strong>s from North America and Japan (low<br />
basis)<br />
• With<strong>in</strong> EE <strong>supplier</strong>s from Romania (66.2%) and Poland (17.2%) achieved<br />
<strong>the</strong> highest growth rates <strong>in</strong> 2005 – <strong>in</strong> l<strong>in</strong>e with average sales growth rate over<br />
<strong>the</strong> five year period (32.1%, 17.4%)<br />
• Contrary, Macedonian (3.7%) and Austrian (5.8%) <strong>supplier</strong>s grew at <strong>the</strong> lowest<br />
rate <strong>in</strong> 2005<br />
Ownership<br />
differentiation<br />
• In course <strong>of</strong> <strong>the</strong> last five years subsidiary companies atta<strong>in</strong>ed higher<br />
growth than domestic companies<br />
• Subsidiaries outperformed domestic companies by 50% <strong>in</strong> 2005
Source: <strong>Roland</strong> <strong>Berger</strong>/Rothschild Supplier Database 2006<br />
VIE-9800-97000-803-129<br />
15<br />
Accord<strong>in</strong>g to sales EE <strong>automotive</strong> <strong>supplier</strong>s outperformed <strong>the</strong>ir<br />
competitors from all o<strong>the</strong>r global regions<br />
Sales growth <strong>of</strong> <strong>automotive</strong> <strong>supplier</strong>s by region [%]<br />
+10.6<br />
5.3<br />
-5.3<br />
North America<br />
-0.4<br />
-4.6 14.9 14.5<br />
7.1 2.5<br />
Western Europe EE<br />
-4.2<br />
13.9<br />
9.7<br />
Ch<strong>in</strong>a<br />
+12.2<br />
12.3<br />
0.1<br />
Japan<br />
-1.3<br />
11.3<br />
-9.3<br />
5.5 4.2<br />
Asia o<strong>the</strong>r 1)<br />
2.0<br />
2000/1 2004/5<br />
1) Ma<strong>in</strong>ly South Korea <strong>supplier</strong>s<br />
Basis: Median<br />
RoW
Source: <strong>Roland</strong> <strong>Berger</strong><br />
VIE-9800-97000-803-129<br />
16<br />
With<strong>in</strong> <strong>the</strong> EE region Romanian and Polish <strong>supplier</strong>s are grow<strong>in</strong>g<br />
fastest <strong>in</strong> 2005<br />
Sales growth <strong>of</strong> <strong>automotive</strong> <strong>supplier</strong>, per country/region<br />
Sales growth year on year per region [%]<br />
20<br />
18<br />
16<br />
14<br />
12<br />
10<br />
8<br />
6<br />
4<br />
2<br />
0<br />
14.9<br />
7.1<br />
2.2<br />
10.7<br />
12.8<br />
5.9 6.2<br />
2.2 1.8<br />
17.5<br />
10.0<br />
7.1<br />
14.5<br />
6.6<br />
2.5<br />
2000/1 2001/2 2002/3 2003/4 2004/5<br />
EE<br />
Global<br />
Western<br />
Europe<br />
Sales growth per country 2004/05 [ %]<br />
66.2<br />
17.2<br />
14.4<br />
13.4<br />
13.9<br />
12.6<br />
11.2<br />
10.3<br />
5.8<br />
3.7<br />
AT HR CZ HU MK PL RO RS SI SK<br />
EE<br />
avg.
Source: <strong>Roland</strong> <strong>Berger</strong><br />
VIE-9800-97000-803-129<br />
17<br />
Subsidiary companies constantly achieved higher sales growth<br />
than domestic companies<br />
Sales growth <strong>of</strong> <strong>automotive</strong> <strong>supplier</strong>s 2000-2005 by ownership<br />
Sales growth year on year by ownership [%]<br />
Comments<br />
22<br />
20<br />
18<br />
16<br />
14<br />
12<br />
10<br />
8<br />
6<br />
4<br />
2<br />
0<br />
20.2<br />
14.9<br />
10.6<br />
16.1 16.2<br />
10.7<br />
5.5<br />
12.8<br />
3.8<br />
20.8<br />
17.5<br />
13.9<br />
16.2<br />
14.5<br />
10.8<br />
2000/1 2001/2 2002/3 2003/4 2004/5<br />
Subsidiary<br />
companies<br />
EE average<br />
Domestic<br />
companies<br />
• Over five year period foreign subsidiary<br />
companies constantly outperformed domestic<br />
companies with regard to sales growth<br />
• In terms <strong>of</strong> employment and GDP impact foreign<br />
<strong>in</strong>vestors equally important<br />
• However, lower growth <strong>of</strong> domestic companies is<br />
problematic<br />
– No build up <strong>of</strong> local know-how/ <strong>in</strong>novation base<br />
– Foreign ownership also means passive<br />
reaction to <strong>in</strong>vestment decisions<br />
– Pr<strong>of</strong>it is withdrawn to foreign HQs<br />
• Build-up <strong>of</strong> domestic supply base represents one<br />
<strong>of</strong> <strong>the</strong> ma<strong>in</strong> mid-term challenges <strong>of</strong> <strong>the</strong> region
Source: <strong>Roland</strong> <strong>Berger</strong><br />
VIE-9800-97000-803-129<br />
18<br />
There are significant structural differences <strong>in</strong> <strong>supplier</strong> pr<strong>of</strong>itability<br />
depend<strong>in</strong>g on country, size, product focus, and ownership<br />
Differences <strong>in</strong> <strong>automotive</strong> <strong>supplier</strong> pr<strong>of</strong>itability [EBIT marg<strong>in</strong> %]<br />
Company size<br />
differentiation<br />
Product focus<br />
differentiation<br />
Ownership<br />
differentiation<br />
• Large <strong>supplier</strong>s (EUR 500-1,000 m) show <strong>the</strong> highest pr<strong>of</strong>itability with an<br />
EBIT marg<strong>in</strong> <strong>of</strong> 5.4% but pr<strong>of</strong>itability does not generally <strong>in</strong>crease with size<br />
• Most significant improvements <strong>of</strong> 0.5% pts. <strong>of</strong> EBIT marg<strong>in</strong> s<strong>in</strong>ce 2000<br />
achieved by small <strong>supplier</strong>s (< EUR 100 m)<br />
• Suppliers with a focus on chassis and exterior have made <strong>the</strong> strongest<br />
pr<strong>of</strong>itability improvements from 2000-2005 (+2.7% pts., +1.2% pts.)<br />
• Most pr<strong>of</strong>itable product segments is by far chassis (7.9% EBIT marg<strong>in</strong>)<br />
• Least pr<strong>of</strong>itable <strong>supplier</strong>s focus on Complete vehicles (3.1%) and Electrics<br />
(3.7%) and have fur<strong>the</strong>r lost pr<strong>of</strong>itability (-2.5% pts., -0.4% pts.)<br />
• In course <strong>of</strong> <strong>the</strong> last five years subsidiary companies atta<strong>in</strong>ed higher<br />
pr<strong>of</strong>itability than domestic companies<br />
• Subsidiaries outperformed domestic companies by more than 55% <strong>in</strong> 2005
Source: <strong>Roland</strong> <strong>Berger</strong>/Rothschild Supplier Database 2006<br />
VIE-9800-97000-803-129<br />
19<br />
Aga<strong>in</strong>st <strong>the</strong> global trend, pr<strong>of</strong>itability <strong>of</strong> EE-<strong>supplier</strong>s <strong>in</strong>creased<br />
over <strong>the</strong> last five years but is still at a low level<br />
Pr<strong>of</strong>itability <strong>of</strong> <strong>automotive</strong> <strong>supplier</strong>s by region [EBIT marg<strong>in</strong> %]<br />
-3.0<br />
+1.3<br />
8.3<br />
-4.6<br />
3.7<br />
-0.6<br />
7.4 6.4<br />
+0.3<br />
5.0 5.3<br />
12.7<br />
9.7 4.7<br />
6.0<br />
Japan<br />
North America<br />
Western Europe<br />
EE<br />
Ch<strong>in</strong>a<br />
-1.5<br />
-1.3<br />
6.5<br />
5.0<br />
9.7<br />
8.4<br />
Asia o<strong>the</strong>r 1)<br />
2000<br />
2005<br />
1) Ma<strong>in</strong>ly <strong>supplier</strong>s from South Korea<br />
Basis: Median<br />
RoW
Source: <strong>Roland</strong> <strong>Berger</strong><br />
VIE-9800-97000-803-129<br />
20<br />
Suppliers from Slovakia are <strong>the</strong> most pr<strong>of</strong>itable <strong>of</strong> <strong>the</strong> region,<br />
followed by <strong>supplier</strong>s from Poland<br />
Pr<strong>of</strong>itability <strong>of</strong> <strong>automotive</strong> <strong>supplier</strong>, per country [EBIT marg<strong>in</strong> %]<br />
EBIT marg<strong>in</strong> year on year per region [%]<br />
EBIT marg<strong>in</strong> 2005 per country [%]<br />
7.5<br />
7.2<br />
6.5<br />
5.5<br />
4.5<br />
5.8<br />
5.0<br />
5.2<br />
5.4<br />
4.4<br />
5.7<br />
5.7<br />
5.2<br />
6.0<br />
5.7<br />
4.9<br />
6.0<br />
5.9<br />
5.5<br />
6.4<br />
5.9<br />
Global<br />
5.3<br />
Western<br />
Europe<br />
EE<br />
4.6<br />
4.1<br />
5.7<br />
5.3<br />
4.3<br />
6.0<br />
4.2<br />
2.7<br />
3.0<br />
7.8<br />
EE<br />
avg.<br />
3.5 0<br />
2000 2001 2002 2003 2004 2005<br />
AT<br />
HR<br />
CZ<br />
HU<br />
MK<br />
PL<br />
RO<br />
RS<br />
SI<br />
SK
Source: <strong>Roland</strong> <strong>Berger</strong><br />
VIE-9800-97000-803-129<br />
21<br />
OWNERSHIP<br />
Similar to sales growth, foreign subsidiaries cont<strong>in</strong>uously<br />
outperform domestic <strong>supplier</strong>s<br />
Pr<strong>of</strong>itability <strong>of</strong> <strong>automotive</strong> <strong>supplier</strong>s 2000-2005 by ownership<br />
Pr<strong>of</strong>itability by ownership [EBIT marg<strong>in</strong> %]<br />
Comments<br />
8<br />
6<br />
4<br />
2<br />
5.3<br />
5.0<br />
5.0<br />
4.4<br />
4.2 4.1<br />
7.4<br />
5.7 6.0<br />
5.2<br />
4.4 4.4<br />
5.9<br />
6.6<br />
5.4<br />
6.0<br />
5.3<br />
3.8<br />
Subsidiary<br />
companies<br />
EE average<br />
Domestic<br />
companies<br />
• Foreign subsidiary companies constantly<br />
outperformed domestic companies <strong>in</strong> pr<strong>of</strong>itability<br />
from 2000-2005<br />
• Spread <strong>of</strong> pr<strong>of</strong>itability between <strong>the</strong> two types <strong>of</strong><br />
companies was relatively small <strong>in</strong> 2001 but has<br />
been widen<strong>in</strong>g significantly <strong>in</strong> 2003 and 2005<br />
• As with <strong>the</strong> difference <strong>in</strong> growth, <strong>the</strong> pr<strong>of</strong>it gap is<br />
highly problematic and shows a need to act for<br />
<strong>the</strong> local supply base<br />
0<br />
2000 2001 2002 2003 2004 2005<br />
• (Note: pr<strong>of</strong>itability <strong>of</strong> foreign subsidiaries may be<br />
skewed due to transfer price tactics, partly based<br />
on lower taxes <strong>of</strong> CEE region)
D. Summary and conclusions<br />
Need to act to streng<strong>the</strong>n <strong>the</strong><br />
domestic supply base<br />
VIE-9800-97000-803-129 22
Source: <strong>Roland</strong> <strong>Berger</strong><br />
VIE-9800-97000-803-129<br />
23<br />
Although EE is overall a very attractive region pr<strong>of</strong>itability and<br />
growth differs significantly<br />
Summary <strong>of</strong> ma<strong>in</strong> f<strong>in</strong>d<strong>in</strong>gs<br />
• Large <strong>supplier</strong>s (EUR 500-1,000 m) are <strong>the</strong> most pr<strong>of</strong>itable <strong>in</strong> <strong>the</strong> EE region with an EBIT<br />
marg<strong>in</strong> <strong>of</strong> 5.4%, however contrary to <strong>the</strong> global trend, pr<strong>of</strong>itability does not <strong>in</strong>crease with size<br />
• Suppliers <strong>in</strong> <strong>the</strong> chassis segment are by far most pr<strong>of</strong>itable with EBIT marg<strong>in</strong>s <strong>of</strong> 7.9% with<br />
chassis and exterior show<strong>in</strong>g <strong>the</strong> most favorable marg<strong>in</strong>-developments from 2000-2005<br />
(+2.7 pts., +1.2 pts. EBIT marg<strong>in</strong>)<br />
• In <strong>the</strong> analyzed five years period foreign subsidiaries outperformed domestic companies by<br />
up to 55% <strong>in</strong> pr<strong>of</strong>itability and 50% <strong>in</strong> sales growth<br />
• The highest yearly average growth rate from 2000-2005 was accounted for by Romanian<br />
(32.1%) and Polish (17.4%) <strong>supplier</strong>s, with sales growth <strong>of</strong> 66.2% and 17.2% <strong>in</strong> 2004/05<br />
• Largest share <strong>of</strong> top performers <strong>in</strong> 2005 with above average pr<strong>of</strong>itability and growth was found<br />
<strong>in</strong> Romania and Poland<br />
• With regard to top performers by product segment, only <strong>supplier</strong>s group focus<strong>in</strong>g on tires were<br />
found <strong>in</strong> that quadrant
VIE-9800-97000-803-129<br />
24<br />
Different regional strategies required to manage long-term structural<br />
challenges <strong>in</strong> Eastern Europe<br />
CEE<br />
CIS<br />
• Manage capacity buildup<br />
until 09/10 (esp. SK,<br />
CZ)<br />
• Prepare for reduced<br />
growth after 2010<br />
(develop o<strong>the</strong>r<br />
<strong>in</strong>dustries)<br />
• Increase productivity to<br />
compensate reduced<br />
cost advantages<br />
SE-Europe<br />
• Attract supply base as<br />
2nd wave <strong>of</strong> low cost<br />
<strong>in</strong>vestments<br />
• Ensure high quality<br />
labor force<br />
• Compete with Russia!<br />
CEE<br />
SEE<br />
CIS<br />
Turkey<br />
• Manage <strong><strong>in</strong>dustry</strong> buildup<br />
(long term), esp. a<br />
strong local supply<br />
base<br />
• Ensure local content,<br />
quality, logistics<br />
Turkey<br />
• Develop supply-base,<br />
esp. domestic players<br />
• Streng<strong>the</strong>n role as<br />
bridge to Middle-East<br />
(esp. logistics,<br />
regulations)
Authors <strong>of</strong> <strong>the</strong> study<br />
Rupert Petry<br />
MANAGING PARTNER<br />
<strong>Roland</strong> <strong>Berger</strong> Vienna<br />
Phone: +43 (1) 53602-301<br />
Fax: +43 (1) 53602-600<br />
E-Mail: rupert_petry@at.rolandberger.com<br />
Christian Wies<strong>in</strong>ger<br />
CONSULTANT<br />
<strong>Roland</strong> <strong>Berger</strong> Vienna<br />
Phone: +43 (1) 53602-136<br />
Fax: +43 (1) 53602-600<br />
E-Mail: christian_wies<strong>in</strong>ger@at.rolandberger.com<br />
VIE-9800-97000-803-129<br />
25