Real full Media Release - Roche
Real full Media Release - Roche
Real full Media Release - Roche
Create successful ePaper yourself
Turn your PDF publications into a flip-book with our unique Google optimized e-Paper software.
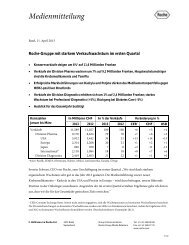
<strong>Media</strong> <strong>Release</strong><br />
Basel, 30 January 2014<br />
<strong>Roche</strong> delivers strong 2013 results<br />
<br />
<br />
<br />
<br />
<br />
<br />
<br />
Group sales rise 6% 1 to 46.8 billion Swiss francs<br />
Pharmaceuticals sales 7% higher, driven by HER2 breast cancer franchise, Avastin,<br />
MabThera/Rituxan, Actemra/RoActemra and Lucentis. Diagnostics sales up 4% on strong<br />
Professional Diagnostics performance<br />
Core EPS growth ahead of sales, up 10% to 14.27 Swiss francs<br />
Positive regulatory decisions for Kadcyla, Perjeta and Herceptin SC strengthen HER2<br />
franchise and US approval of Gazyva supports hematology franchise<br />
Significant progress of R&D pipeline: 15 new molecular entities in late-stage development<br />
Board proposes dividend increase of 6% to 7.80 Swiss francs, 27th consecutive year of<br />
dividend growth<br />
Outlook for 2014: Sales expected to grow low- to mid-single digit, at constant exchange<br />
rates. Core earnings per share targeted to grow (at CER) ahead of sales. <strong>Roche</strong> expects to<br />
further increase its dividend<br />
1<br />
Unless otherwise stated, all growth rates are at constant exchange rates (CER). The percentage changes at CER are calculated using<br />
simulations by reconsolidating both the 2013 and 2012 results at constant currencies (the average rates for the year ended 31<br />
December 2012).<br />
F. Hoffmann-La <strong>Roche</strong> Ltd 4070 Basel<br />
Switzerland<br />
Group Communications<br />
<strong>Roche</strong> Group <strong>Media</strong> Relations<br />
Tel. +41 61 688 88 88<br />
Fax +41 61 688 27 75<br />
www.roche.com<br />
1/32
Key figures 2013<br />
In millions of CHF As % of sales % change<br />
2013 2012 2013 2012 CER* CHF USD<br />
Group Sales<br />
Pharmaceuticals Division<br />
Diagnostics Division<br />
46,780<br />
36,304<br />
10,476<br />
45,499<br />
35,232<br />
10,267<br />
100<br />
78<br />
22<br />
100<br />
77<br />
23<br />
+6<br />
+7<br />
+4<br />
+3<br />
+3<br />
+2<br />
+4<br />
+4<br />
+3<br />
Core operating profit 17,904 17,160 38.3 37.7 +8 +4<br />
Operating free cash flow 16,381 16,135 35.0 35.5 +5 +2<br />
IFRS 2 Net income 11,373 9,660 24.3 21.2 +22 +18<br />
Core earnings per share 14.27 13.49 +10 +6<br />
* Constant exchange rates (average <strong>full</strong>-year 2012)<br />
<strong>Roche</strong>’s CEO Severin Schwan: “2013 was a very good year for <strong>Roche</strong>. We exceeded our financial targets with<br />
strong demand for our existing products and positive uptake of recently launched medicines and diagnostics.<br />
With the launch of Perjeta and Kadcyla we have added a new generation of treatments for women with a<br />
particularly aggressive type of breast cancer. Another highlight was the launch of Gazyva for chronic<br />
lymphocytic leukemia (CLL), in the United States. In Diagnostics we introduced a range of new instruments<br />
and tests that further strengthen our position as market leader, including the cobas 8100 and a new HPV test<br />
for cervical cancer. With our strong product pipeline we are well positioned for future success."<br />
Strong performance in 2013<br />
Group sales rose 6% to 46.8 billion Swiss francs in 2013 as a result of strong demand for <strong>Roche</strong>’s biologic<br />
medicines in the area of oncology, immunology and ophthalmology as well as for its clinical laboratory<br />
diagnostic products, especially immunoassays. This sales performance contributed significantly to an 8%<br />
increase in the Group’s core operating profit and, combined with lower financing costs, a 10% rise in core<br />
earnings per share. IFRS net income rose 22% to 11.4 billion Swiss francs as a result of lower restructuring<br />
costs and the reversal of previous impairment charges.<br />
Strong sales growth<br />
Sales of the Pharmaceuticals Division grew 7% to 36.3 billion Swiss francs due to the continued strength of<br />
established and new medicines for cancer (HER2 franchise, Avastin and MabThera/Rituxan) as well as good<br />
growth in medicines for rheumatoid arthritis (Actemra/RoActemra) and eye diseases (Lucentis). Sales<br />
growth was strongest in the United States (+10%) and emerging markets (+12%) 3 , which grew faster than<br />
Europe (+2%) and Japan (+2%).<br />
2<br />
International Financial Reporting Standards.<br />
3<br />
E7 emerging markets: Brazil, China, India, Mexico, Russia, South Korea and Turkey.<br />
2/32
The Diagnostics Division grew ahead of the in vitro market 4 , as all regions contributed to sales growth of 4%.<br />
Sales reached 10.5 billion Swiss francs with the most important contribution coming from continued strong<br />
demand for tests and instruments used in clinical laboratories, especially from Professional Diagnostics<br />
(+8%). As expected, the market environment for Diabetes Care (-3%) remained challenging in 2013 and<br />
<strong>Roche</strong> is continuing the restructuring measures that were initiated in 2012. Sales growth in Diagnostics was<br />
strongest in Asia-Pacific (+14%) and Latin America (+13%), and lower in mature markets: Europe (+2%),<br />
North America (+1%) and Japan (+2%).<br />
The Swiss franc rose against a number of currencies in 2013, mainly the Japanese yen and the US dollar,<br />
while falling against the euro. Overall, this led to a negative impact on the results reported in Swiss francs.<br />
Core operating profit further improved<br />
Driven by the strong sales performance, the Group’s core operating profit increased by 8% (+4% in Swiss<br />
francs) to 17.9 billion Swiss francs. Higher operating costs were recorded for research and development, as<br />
well as for marketing and distribution to support growth in key markets such as the United States and China.<br />
Core operating profit in the Pharmaceuticals Division grew 7% to 16.1 billion Swiss francs and Diagnostics<br />
core operating profit increased by 4% to 2.2 billion Swiss francs.<br />
<strong>Roche</strong>’s core earnings per share, which excludes non-core items such as global restructuring charges and<br />
amortisation and impairment of goodwill and intangible assets, rose 10% to 14.27 Swiss francs per share.<br />
This was driven by the strong operating performance and lower financing costs, due to lower interest<br />
payments following progressive repayment of the debt incurred for the Genentech transaction. IFRS net<br />
income rose 22% to 11.4 billion Swiss francs (+18% in Swiss francs) as a result of lower restructuring costs<br />
and the reversal of previous impairment charges. 5<br />
Strong operating free cash flow and improved net debt position<br />
The Group’s operating free cash flow grew by 5% (+2% in Swiss francs) to 16.4 billion Swiss francs, enabling<br />
<strong>Roche</strong> to further reduce the Group’s debt position: by the end of the year, 67% of the debt incurred to finance<br />
the Genentech transaction in 2009 had been repaid. The net debt position of the Group at year-end 2013 was<br />
6.7 billion Swiss francs, a decrease of 3.9 billion Swiss francs from year-end 2012. At 31 December 2013, the<br />
net debt to asset ratio was 11%.<br />
Significant progress in pharmaceutical R&D pipeline<br />
During 2013 <strong>Roche</strong>’s pharmaceutical R&D pipeline made significant progress both in oncology and in the<br />
4<br />
Market estimates from an independent IVD consultancy; data as of end Q3 2013.<br />
5<br />
As part of a broader initiative to expand production capacity of biologic medicines, <strong>Roche</strong> put back into service a discontinued<br />
production unit in Vacaville (USA). This resulted in a reversal of previously incurred impairment charges of 0.5 bn Swiss francs.<br />
3/32
areas of ophthalmology and immunology. The pipeline currently has 66 new molecular entities in clinical<br />
development of which 15 are in late-stage development. Based on promising mid-stage data <strong>Roche</strong> selected<br />
eight new compounds to progress to late-stage development during 2013: six compounds in oncology (anti-<br />
CD79b ADC, pan-PI3Ki, beta-sparing PI3Ki, alectinib (ALKi), Bcl-2i, anti-PDL1), etrolizumab for<br />
inflammatory bowel disease, lampalizumab for the eye disease geographic atrophy (an advanced form of dry<br />
AMD). In addition, <strong>Roche</strong> licensed-in oral octreotide, a treatment for the growth disorder, acromegaly. 6<br />
Proposals for the Annual General Meeting 2014<br />
In light of the company’s strong performance in 2013, the Board of Directors is proposing an 6% dividend<br />
increase to 7.80 Swiss francs per share and non-voting equity security (2012: 7.35 Swiss francs), making this<br />
the 27th consecutive year of dividend growth.<br />
The Board of Directors proposes that Christoph Franz, who has served as a non-executive Director on the<br />
<strong>Roche</strong> Board since 2011, be elected as Chairman of the Board.<br />
In March 2013 a majority of Swiss citizens voted in a referendum in favour of a set of changes to the Swiss<br />
constitution regarding governance regulations of publicly quoted companies. <strong>Roche</strong> has decided to<br />
implement the new regulations earlier than required and will propose changes to the company’s Articles of<br />
Incorporation at the AGM on 4 March 2014: as of this year, the Chairman of the Board, all members of the<br />
Board of Directors and the members of the Remuneration Committee will be elected annually by the<br />
shareholders and binding votes on remuneration will be proposed to be implemented in 2014, ahead of the<br />
mandatory date of 2015.<br />
Outlook for 2014<br />
In 2014, <strong>Roche</strong> expects low- to mid-single digit growth in Group sales at constant exchange rates. Core EPS is<br />
targeted to grow (at CER) ahead of sales. <strong>Roche</strong> expects to further increase its dividend.<br />
6<br />
In February 2013, <strong>Roche</strong> signed an agreement with Chiasma, a privately held biopharma company, to develop and commercialise<br />
Octreolin.<br />
4/32
Pharmaceuticals Division<br />
Pharmaceuticals Division:<br />
Key figures - 2013<br />
In millions of<br />
CHF<br />
% change at<br />
CER*<br />
% change in<br />
CHF<br />
Sales - Pharmaceuticals Division 36,304 +7 +3 100<br />
United States 15,097 +10 +9 42<br />
Europe 9,254 +2 +3 25<br />
Japan 3,405 +2 -17 9<br />
International 8,548 +8 +3 24<br />
Core operating profit 16,108 +7 +4 44.4<br />
Operating free cash flow 14,976 +5 +2 41.3<br />
Research and development 7,683 +5 +2 21.2<br />
* Constant exchange rates (average <strong>full</strong>-year 2012)<br />
As % of sales<br />
Strong sales growth in the United States and emerging markets<br />
Pharmaceuticals sales were driven by growth for oncology products in the United States (+10%) and the E7<br />
emerging markets (+12%), especially China (+21%) and Brazil (+9%). Sales in Europe grew 2%, despite<br />
ongoing pricing pressure in key markets. In Japan sales increased 2%, despite the loss of sales following the<br />
termination of a co-marketing agreement for Evista, an osteoporosis treatment; excluding this impact, sales<br />
in Japan grew 7%.<br />
Oncology: dynamic growth and important product approvals<br />
Sales of the HER2 breast cancer franchise, which consists of Herceptin, Perjeta and Kadcyla, rose 14% to 6.6<br />
billion Swiss francs. In 2013 <strong>Roche</strong> received several important product approvals for the HER2 franchise in<br />
key markets: Kadcyla was approved in the United States and the EU and Perjeta was approved in the EU for<br />
late-stage cancer. In October Perjeta was also approved for use in treatment of HER2-positive breast cancer<br />
prior to surgery (neoadjuvant setting) in the United States. The HER2 franchise was further strengthened by<br />
EU approval of the subcutaneous formulation of Herceptin.<br />
Sales of Avastin, which is used to treat a number of different types of cancer, increased 13% to 6.3 billion<br />
Swiss francs due to strong demand for the treatment of advanced ovarian cancer in Europe, and colorectal<br />
cancer in the United States and Europe. During 2013 Avastin was approved in Japan to treat ovarian cancer,<br />
as well as glioblastoma, a type of brain tumour.<br />
Sales of <strong>Roche</strong>’s blood cancer and rheumatoid arthritis medicine MabThera/Rituxan increased 6% to 7.0<br />
billion Swiss francs. The outlook for the Group’s hematology franchise was enhanced by US approval of<br />
Gazyva to treat chronic lymphocytic leukemia (CLL), one of the most common forms of blood cancer. Latestage<br />
trials investigating Gazyva in non-Hodgkin’s lymphoma (NHL), the most common cancer of the<br />
5/32
lymphatic system, are ongoing. <strong>Roche</strong> also reported encouraging phase I data on its Bcl-2 inhibitor. 7<br />
In 2013, based on promising mid-stage data, we selected six new oncology compounds to progress to late<br />
stage development: anti-CD79b ADC (blood cancers), pan-PI3Ki (breast cancer and other solid tumours),<br />
beta-sparing PI3Ki (breast cancer and other solid tumours), alectinib ALKi (lung cancer and other solid<br />
tumours), Bcl-2i (blood cancers) and anti-PDL1 (lung cancer and other solid tumours).<br />
Immunology and ophthalmology: product growth and promising pipeline<br />
The rheumatoid arthritis drug Actemra/RoActemra recorded a 30% increase in sales and achieved sales of<br />
more than 1 billion Swiss francs for the first time in 2013. The subcutaneous formulation of<br />
Actemra/RoActemra was approved in the United States in October and has also received a positive<br />
recommendation from Europe’s regulatory agency. <strong>Roche</strong>’s immunology pipeline includes etrolizumab for<br />
inflammatory bowel disease and lebrikizumab for severe asthma.<br />
Sales of Lucentis, which is used in the treatment of a number of eye diseases, rose 15% to 1.7 billion Swiss<br />
francs. <strong>Roche</strong> has made further progress in strengthening its ophthalmology pipeline with lampalizumab<br />
which showed promising phase II clinical trial results in the treatment of geographic atrophy, an advanced<br />
form of dry age-related macular degeneration.<br />
Neuroscience pipeline<br />
In January 2014 <strong>Roche</strong> announced that two bitopertin trials for schizophrenia did not meet their primary<br />
endpoints. Another four studies with bitopertin are ongoing, for which results are expected during 2014.<br />
Diseases of the nervous system have a very high unmet need and pose some of the greatest challenges for<br />
society. Neuroscience remains a focus area of research and development at <strong>Roche</strong>, with a total of 12 new<br />
compounds in clinical development, including late-stage compounds for Alzheimer’s (gantenerumab) and<br />
multiple sclerosis (ocrelizumab).<br />
Cardiovascular/metabolism pipeline<br />
In July 2013 <strong>Roche</strong> announced the discontinuation of aleglitazar trials in diabetes. As a result, the company<br />
no longer has any cardiovascular/metabolism compounds in its late-stage pipeline and has decided to pursue<br />
partnering opportunities for the remaining compounds in its early development pipeline.<br />
7<br />
GDC 199/ABT-199 in collaboration with AbbVie.<br />
6/32
Pharmaceuticals<br />
Division:<br />
Product Sales 2013<br />
Top selling products<br />
Total United States Europe Japan International<br />
**<br />
CHF m %* CHF m %* CHF m %* CHF m %* CHF m %*<br />
MabThera/<br />
6,951 6% 3,329 8% 1,918 3% 249 6% 1,455 6%<br />
Rituxan<br />
Avastin 6,254 13% 2,575 5% 1,919 14% 717 15% 1,043 30%<br />
Herceptin 6,079 6% 1,787 9% 2,191 -1% 294 8% 1,807 11%<br />
Lucentis 1,689 15% 1,689 15% - - - - - -<br />
Xeloda 1,509 2% 616 0% 315 -4% 107 4% 471 8%<br />
Tarceva 1,339 4% 604 7% 343 -5% 99 10% 293 8%<br />
Pegasys 1,312 -19% 307 -43% 356 -11% 52 -21% 597 -3%<br />
Actemra/<br />
1,037 30% 314 32% 360 27% 197 21% 166 49%<br />
RoActemra<br />
CellCept 874 -2% 204 21% 238 -12% 68 10% 364 -7%<br />
Xolair 790 13% 790 13% - - - - - -<br />
Recent launches<br />
Zelboraf 354 52% 123 11% 194 65% - - 37 ***<br />
Perjeta 326 498% 219 311% 68 *** 23 - 16 ***<br />
Kadcyla 234 - 222 - 9 - - - 3 -<br />
Erivedge 75 161% 66 132% 8 - - - 1 -<br />
Gazyva 3 - 3 - - - - - - -<br />
* Constant exchange rates.<br />
**Asia–Pacific, EEMEA (Eastern Europe, Middle East and Africa), Latin America, Canada, Others.<br />
*** Over +500%.<br />
Key products<br />
<br />
<br />
MabThera/Rituxan (+6%), for blood cancers, specifically non-Hodgkin’s lymphoma (NHL), chronic<br />
lymphocytic leukemia (CLL), and for rheumatoid arthritis, as well as granulomatosis with polyangiitis<br />
(GPA) and microscopic polyangiitis (MPA), which are two types of ANCA (anti-neutrophil cytoplasmic<br />
antibody) associated vasculitis. Global sales rose 6% largely due to higher sales in the United States (+8%)<br />
driven by increased use across all oncology and rheumatoid arthritis indications. In January 2014 the<br />
subcutaneous formulation of MabThera for NHL secured a positive recommendation from Europe’s<br />
regulatory agency (CHMP).<br />
Avastin (+13%), for advanced colorectal, breast, lung, kidney and ovarian cancer, and relapsed<br />
glioblastoma (a type of brain tumour). Global sales rose 13% due to increased use in established<br />
indications (colorectal and lung cancer) as well as the recently approved indication, ovarian cancer. Sales<br />
rose 14% in Europe as a result of growing use in ovarian and colorectal cancer. In the United States sales<br />
7/32
increased 5% due to expanded use in colorectal cancer. Demand was strong in several International<br />
markets (overall +30%), especially China (+62%, in particular for colorectal cancer). In 2013 <strong>Roche</strong> filed<br />
for approval of Avastin for advanced non-small cell lung cancer (NSCLC) in China based on<br />
encouraging phase III data in Chinese patients. Lung cancer is the most common type of cancer and the<br />
biggest cause of cancer-related death in China.<br />
<br />
<br />
<br />
<br />
Herceptin (+6%), for HER2-positive breast cancer and HER2-positive metastatic (advanced) gastric<br />
cancer. Herceptin sales rose 6% largely due to good sales growth in the United States (+9%) and strong<br />
sales in the International region (+11%). Growth was especially strong in China (+40%), due to patient<br />
access programmes and ongoing testing initiatives and in Brazil (+10%), where Herceptin is now<br />
available on the national public healthcare system. The subcutaneous (SC) formulation of Herceptin has<br />
performed well since its approval in Europe in June 2013 and is now available in many markets in<br />
Europe, including Germany and the UK.<br />
Lucentis (+15%, US market only), for eye conditions specifically wet age-related macular degeneration<br />
(wAMD), macular edema following retinal vein occlusion (RVO) and diabetic macular edema (DME).<br />
Sales of Lucentis rose 15% as a result of growth in the RVO and DME indications and steady growth for<br />
the treatment of wAMD. Since receiving FDA approval in August 2012, Lucentis is the only anti-vascular<br />
endothelial growth factor medicine approved for DME in the United States. In February <strong>Roche</strong> received<br />
FDA approval to update the Lucentis label to include a less frequent dosing regimen in wAMD.<br />
Pegasys (-19%), for hepatitis B and C. Global sales of Pegasys fell in 2013, especially in the United States<br />
(-43%) and several markets within Europe (-11%) as doctors in these regions awaited the launch of<br />
interferon-free combination therapies. There is continued demand for Pegasys in several emerging<br />
markets, where first-generation triple combination therapies are being introduced.<br />
Actemra/RoActemra (+30%), for rheumatoid arthritis (RA), systemic juvenile idiopathic arthritis and<br />
polyarticular juvenile idiopathic arthritis. Sales continued to grow in all regions and reached 1 billion<br />
Swiss francs for the first time in 2013. The subcutaneous formulation for adults with moderately to<br />
severely active rheumatoid arthritis was approved in March in Japan, and in October in the United<br />
States. In December this formulation secured a positive recommendation from Europe’s regulatory<br />
agency (CHMP).<br />
Recently launched products<br />
Zelboraf (354 million Swiss francs), for BRAF V600 mutation-positive metastatic melanoma. Zelboraf is<br />
now the standard of care for BRAF mutation-positive metastatic melanoma in the United States and<br />
Europe. Zelboraf is now approved in 81 countries. Data from the coBRIM phase III combination study of<br />
Zelboraf and the MEK inhibitor cobimetinib in BRAF V600 mutation-positive metastatic melanoma is<br />
expected in 2014.<br />
<br />
Perjeta (326 million Swiss francs), for neoadjuvant HER2-positive breast cancer and first line HER2-<br />
8/32
positive metastatic breast cancer. Perjeta is combined with Herceptin and chemotherapy to provide a<br />
more comprehensive blockade of HER2 signaling pathways. The Perjeta regimen has been shown to<br />
significantly extend overall survival and progression-free survival in patients with previously untreated<br />
HER2-positive mBC. Perjeta is now approved for this use in the United States, the EU (approval received<br />
in March 2013), Switzerland, Japan and 37 other countries. In October Perjeta received accelerated<br />
approval in the United States for neoadjuvant treatment (therapy before surgery) in patients with highrisk<br />
HER2-positive early stage breast cancer. Perjeta is performing well in the United States and has also<br />
been strong in several European countries, especially Germany and the UK.<br />
<br />
<br />
Kadcyla (234 million Swiss francs), for HER2-positive metastatic breast cancer in patients who have<br />
already been treated with Herceptin and taxane-based chemotherapy. Kadcyla is the first antibody drug<br />
conjugate (ADC) approved to treat HER2-positive breast cancer. An ADC is a targeted cancer medicine<br />
that can attach to certain types of cancer cells and deliver chemotherapy directly to them, resulting in a<br />
highly potent treatment that also has fewer adverse side effects. Kadcyla received regulatory approval in<br />
the United States in February, in Japan in September and in Europe in November. US demand has been<br />
strong and reimbursement discussions are currently underway in Europe and Japan.<br />
Gazyva (3 million Swiss francs), for chronic lymphocytic leukemia (CLL). Gazyva was given<br />
Breakthrough Therapy Designation by the FDA due to the significance of the positive progression-free<br />
survival (PFS) results from the Phase III CLL11 trial. The trial also showed that Gazyva, when combined<br />
with chlorambucil, significantly reduced the risk of disease worsening or death compared to the current<br />
standard of care, MabThera/Rituxan. <strong>Roche</strong> received regulatory approval in the United States in<br />
November and Gazyva was subsequently included in the CLL treatment guidelines of the National<br />
Comprehensive Cancer Network. <strong>Roche</strong> has also submitted marketing applications to other regulatory<br />
authorities, including the European Medicines Agency (EMA).<br />
Major clinical and regulatory news flow up to the end January 2014<br />
Compound Indication Milestone<br />
Actemra subcutaneous rheumatoid arthritis Japanese approval Q1 <br />
Actemra subcutaneous rheumatoid arthritis US approval Q4 <br />
RoActemra<br />
rheumatoid arthritis CHMP positive opinion Q4 <br />
subcutaneous<br />
Actemra polyarticular juvenile idiopathic arthritis US approval Q1 <br />
RoActemra polyarticular juvenile idiopathic arthritis EU approval Q2 <br />
aleglitazar Diabetes aleglitazar trials<br />
Q3 <br />
discontinued<br />
Avastin metastatic colorectal cancer TML US approval Q1 <br />
9/32
Avastin<br />
newly diagnosed and relapsed<br />
Japanese approval<br />
Q2 <br />
glioblastoma<br />
Avastin newly diagnosed glioblastoma EU filing (AVAglio) Q2 <br />
Avastin advanced cervical cancer phase III study results Q2 <br />
(GOG240)<br />
Avastin ovarian cancer Japanese approval Q4 <br />
Avastin adjuvant HER2-positive breast cancer phase III study Q4 <br />
Erivedge advanced basal cell carcinoma conditional EU approval Q3 <br />
Gazyva chronic lymphocytic leukemia phase III study results Q1 <br />
(CLL11)<br />
Gazyva chronic lymphocytic leukemia US approval Q4 <br />
Herceptin subcutaneous HER2-positive breast cancer EU approval Q3 <br />
Kadcyla HER2-positive metastatic breast cancer US approval Q1 <br />
Kadcyla HER2-positive metastatic breast cancer phase III study results Q2 <br />
(TH3RESA)<br />
Kadcyla HER2-positive metastatic breast cancer Japanese approval Q3 <br />
Kadcyla HER2-positive metastatic breast cancer EU approval Q4 <br />
Lucentis less frequent dosing regimen for wAMD US approval Q1 <br />
MabThera active GPA and MPA EU approval Q2 <br />
MabThera<br />
subcutaneous<br />
NHL (follicular lymphoma and diffuse<br />
large B-cell lymphoma)<br />
CHMP positive opinion 2014<br />
Q1 <br />
Pegasys chronic hepatitis C in children EU approval Q1 <br />
Perjeta HER2-positive metastatic breast cancer EU approval Q1 <br />
Perjeta HER2-positive metastatic breast cancer Japanese approval Q2 <br />
Perjeta<br />
HER2-positive neoadjuvant breast US approval<br />
Q3 <br />
cancer<br />
Tarceva<br />
EGFR mutation-positive non-small cell<br />
lung cancer (first line)<br />
US approval<br />
Q1 <br />
Tarceva non-small cell lung cancer adjuvant phase III study results<br />
(RADIANT)<br />
Xolair chronic idiopathic urticaria phase III study results<br />
(ASTERIA II)<br />
Q4 <br />
Q1 <br />
10/32
Upcoming clinical news flow and pending regulatory decisions<br />
Compound Indication Milestone<br />
bitopertin schizophrenia phase III study results<br />
(SunLyte, TwiLyte, MoonLyte,<br />
NightLyte)<br />
Gazyva chronic lymphocytic leukemia EU approval<br />
Kadcyla and Perjeta metastatic HER2-positive breast cancer<br />
(first line)<br />
phase III study results<br />
(MARIANNE)<br />
MabThera<br />
subcutaneous<br />
RoActemra<br />
subcutaneous<br />
Tarceva and<br />
onartuzumab<br />
Zelboraf and<br />
cobimetinib<br />
NHL (follicular lymphoma and diffuse<br />
large B-cell lymphoma)<br />
rheumatoid arthritis<br />
non-small cell lung cancer<br />
BRAF V600 mutation-positive<br />
metastatic melanoma<br />
EU approval<br />
EU approval<br />
phase III study results<br />
(MetLung)<br />
phase III study results<br />
(co-BRIM)<br />
11/32
Diagnostics Division<br />
Diagnostics Division:<br />
Key figures - 2013<br />
In millions of<br />
CHF<br />
% change at<br />
CER*<br />
% change in<br />
CHF<br />
Sales - Diagnostics Division 10,476 +4 +2 100<br />
Business<br />
Areas<br />
Professional Diagnostics 5,740 +8 +5 56<br />
Diabetes Care 2,459 -3 -4 23<br />
Molecular Diagnostics 1,612 +2 -1 15<br />
Tissue Diagnostics 665 +7 +5 6<br />
Regions Europe, Middle East, Africa 4,825 +2 +2 46<br />
North America 2,611 +1 -1 25<br />
Asia–Pacific 1,746 +14 +12 16<br />
Latin America 802 +13 +4 8<br />
Japan 492 +2 -17 5<br />
As %<br />
of sales<br />
Core operating profit 2,177 +4 0 20.8<br />
Operating free cash flow 1,962 +9 +4 18.7<br />
* Constant exchange rates<br />
The Diagnostics Division again grew ahead of the global in vitro diagnostics market 8 with a 4% increase in<br />
sales to 10.5 billion Swiss francs in 2013. This was mainly due to strong demand from customers at clinical<br />
laboratories for products, especially from the Professional Diagnostics business area, which posted an 8%<br />
increase in sales. Diabetes Care sales decreased 3% as a result of the challenging market environment and<br />
reimbursement changes in blood glucose monitoring in some key markets, notably the United States.<br />
Molecular Diagnostics grew 2% and Tissue Diagnostics sales increased 7%.<br />
All regions contributed to growth: the main growth drivers were Asia–Pacific (+14%), EMEA (+2%,<br />
accounting for almost half of total Division sales) and Latin America (+13%).<br />
Professional Diagnostics (+8%). The business area further extended its position as market leader based on<br />
strong growth from the immunoassay (+14%) and clinical chemistry (+6%) businesses, while coagulation<br />
patient self-monitoring (+7%) and hematology (+9%) also supported this good performance. Asia–Pacific<br />
(+17%) and Latin America (+17%) were the main regional contributors to growth. The immunoassay<br />
business, which accounts for almost a quarter of total Division sales, includes tests for tumours, thyroid<br />
function, cardiac and women’s health and infectious disease markers. Sales of the vitamin D test, launched in<br />
the third quarter of 2012, grew over 50% in 2013. A key milestone for Professional Diagnostics was the<br />
launch of the new cobas 8100 pre- and post-analytics instrument. The system is available in all markets<br />
8<br />
Market estimates from an independent IVD consultancy; data as of end Q3 2013<br />
12/32
except the United States, and uptake has been positive since its launch in September.<br />
In July 2013 <strong>Roche</strong> acquired US-based Constitution Medical Investors, Inc. (CMI). CMI is the developer of a<br />
highly innovative hematology testing system, which is designed to provide faster and more accurate diagnosis<br />
of blood-related diseases. This acquisition demonstrates <strong>Roche</strong>’s commitment to hematology testing. The<br />
business is reported as part of Professional Diagnostics.<br />
Diabetes Care (-3%). Sales decreased as a result of reimbursement cuts for blood glucose monitoring<br />
supplies, especially in North America (-15%), and ongoing price pressure in other key markets. Sales were<br />
stable in EMEA and declined in Japan (-3%) but increased in Asia–Pacific (+4%) and in Latin America<br />
(+2%).<br />
Demand for newer and more sophisticated products, such as Accu-Chek Mobile (+41%), remained strong,<br />
while sales of Accu-Chek Nano SmartView in the United States almost doubled. Sales of insulin delivery<br />
systems grew 1%. The next-generation Accu-Chek Active Meter and the next-generation no-code Accu-Chek<br />
Aviva/Performa Meter were launched in 2013 in all markets except the United States, where the no-code<br />
Accu-Chek Nano SmartView meter and test strips have been available since 2012. The Accu-Chek Aviva<br />
Expert system received FDA clearance in the United States in 2013.<br />
Molecular Diagnostics (+2%). The underlying sales growth of the Molecular Diagnostics business was 6%<br />
(excluding sequencing sales). The main growth contributors were tests for the human papilloma virus (HPV)<br />
(+90%), nucleic acid purification (NAP)/real-time PCR (qPCR) reagents and systems in the life sciences<br />
market (+6%), as well as products for blood screening (+2%). Demand for oncology companion diagnostic<br />
tests also showed significant growth (+70%). Sales growth was reported by all regions.<br />
Tests for sexually transmitted diseases (Chlamydia trachomatis/Neisseria gonorrhoeae) received a label<br />
expansion for the US market, while marketing clearance (CE Mark) in Europe was obtained for the<br />
microbiology portfolio (MRSA, MSSA and herpes simplex virus 1 and 2).<br />
Tissue Diagnostics (+7%). Sales growth was largely driven by advanced staining reagents, which grew 4%.<br />
All regions recorded strong sales growth except North America, where sales increased 1% due to US national<br />
reimbursement changes and new laboratory guidelines. The Ventana HER2 test label has been expanded to<br />
include <strong>Roche</strong>’s recently launched breast cancer medicines, Perjeta and Kadcyla, in markets outside the<br />
United States. Revenues from external personalised healthcare partners and sales of companion tests<br />
continued to grow. Tissue Diagnostics contributed to <strong>Roche</strong>’s existing cervical cancer testing portfolio with<br />
the CINtec Histology test (+31%) which is used to identify precancerous cervical lesions. In addition, the<br />
CINtec PLUS Cytology test, a <strong>full</strong>y automated cell based assay used in cervical cancer screening, obtained the<br />
13/32
CE Mark in December 2013.<br />
With the cobas HPV test for screening, the CINtec p16 Histology test, and the CINtec PLUS Cytology test,<br />
<strong>Roche</strong> has the most complete cervical cancer screening and diagnosis portfolio to help women and healthcare<br />
professionals identify and manage cervical cancer early and avoid cases that could be missed by Pap smear<br />
screening alone.<br />
Diagnostics Division: Key product launches in 2013<br />
Area Product name Description Market<br />
Instruments/devices<br />
Laboratories cobas 8100 next-generation modular pre- and post- analytics EU<br />
Life sciences<br />
Tests/assays<br />
Accu-Chek Active<br />
GS FLX+ long<br />
amplicons<br />
next-generation blood glucose meter with maltose<br />
independent test strips<br />
software for long-read targeted sequencing for DNA<br />
variant detection<br />
Oncology Calcitonin medullary thyroid cancer diagnosis and monitoring<br />
(immunoassay)<br />
proGRP diagnosis of small cell lung cancer (immunoassay) EU<br />
EGFR therapy selection for non-small cell lung cancer (PCR) US<br />
ER breast cancer diagnosis (IHC tissue test) US<br />
CINtec PLUS<br />
Cytology<br />
diagnosis of cervical precancer (immunocytochemistry<br />
test)<br />
EU<br />
WW*<br />
EU<br />
EU<br />
Infectious<br />
Diseases<br />
Transplantation<br />
Sequencing<br />
*Worldwide<br />
HCV 2.0 next-generation HCV viral load test (PCR) US<br />
Cyclosporin,<br />
Tacrolimus<br />
SeqCap EZ Reagent<br />
Kits<br />
monitoring of immunosuppressive drug therapy<br />
(immunoassay)<br />
sample preparation (targeted next-generation<br />
sequencing)<br />
EU<br />
WW<br />
14/32
Diagnostics Division: Key product launches planned for 2014<br />
Area Product name Description Market<br />
Instruments/devices<br />
Laboratories cobas 6800/8800 next generation molecular (PCR) system WW*<br />
cobas m511<br />
<strong>full</strong>y integrated/automated hematology system EU<br />
cobas 6500 automated urinalysis work area EU<br />
Connect-V<br />
middleware providing connectivity to hospital WW*<br />
information systems<br />
Diabetes care Accu-Chek Insight next generation insulin pump & blood glucose<br />
monitoring system<br />
Tests/ assays<br />
Blood screening /<br />
infectious diseases<br />
Accu-Chek Connect<br />
MPX 2.0<br />
MPX (HIV, HCV, HBV),<br />
HEV, DPX1, WNV2<br />
bG meter with connectivity to smartphones,<br />
mobile applications and cloud<br />
EU<br />
EU<br />
next generation blood screening multiplex test US<br />
<strong>full</strong> NAT blood screening menu for cobas<br />
6800/8800<br />
WW*<br />
HIV, HCV, HBV virology tests for cobas 6800/8800 WW*<br />
HSV herpes simplex virus detection on cobas 4800 EU<br />
Syphilis<br />
Treponema pallidum detection (immunoassay) EU<br />
Microbiology MRSA/SA next generation assay on cobas 4800 EU<br />
C-difficile<br />
diagnosis of infections and associated diarrhea EU<br />
Women’s health AMH assessment of ovarian reserve for fertility EU<br />
* excluding the United States<br />
1<br />
parvovirus B19 and hepatitis A virus<br />
2<br />
west Nile virus<br />
PE Prognosis<br />
short-term prediction of pre-eclampsia in<br />
pregnancy (claim extension)<br />
EU<br />
15/32
About <strong>Roche</strong><br />
Headquartered in Basel, Switzerland, <strong>Roche</strong> is a leader in research-focused healthcare with combined strengths in<br />
pharmaceuticals and diagnostics. <strong>Roche</strong> is the world’s largest biotech company, with truly differentiated medicines<br />
in oncology, immunology, infectious diseases, ophthalmology and neuroscience. <strong>Roche</strong> is also the world leader in<br />
in vitro diagnostics and tissue-based cancer diagnostics, and a frontrunner in diabetes management. <strong>Roche</strong>’s<br />
personalised healthcare strategy aims at providing medicines and diagnostics that enable tangible improvements in<br />
the health, quality of life and survival of patients. Founded in 1896, <strong>Roche</strong> has been making important contributions<br />
to global health for more than a century. Twenty-four medicines developed by <strong>Roche</strong> are included in the WHO<br />
Model Lists of Essential Medicines, among them life-saving antibiotics, antimalarials and chemotherapy.<br />
In 2013 the <strong>Roche</strong> Group employed over 85,000 people worldwide, invested 8.7 billion Swiss francs in R&D and<br />
posted sales of 46.8 billion Swiss francs. Genentech, in the United States, is a wholly owned member of the <strong>Roche</strong><br />
Group. <strong>Roche</strong> is the majority shareholder in Chugai Pharmaceutical, Japan. For more information, please visit<br />
www.roche.com.<br />
All trademarks used or mentioned in this release are protected by law.<br />
Additional information<br />
<strong>Media</strong> <strong>Release</strong> including <strong>full</strong> set of tables: http://www.roche.com/med-cor-2014-01-30.htm<br />
Sustainable Development at <strong>Roche</strong>: www.roche.com/corporate_responsibility<br />
<strong>Roche</strong> Annual Report 2013 (includes Corporate Responsibility Report): www.roche.com/annual_reports<br />
Dow Jones Sustainability Indexes: www.sustainability-indexes.com<br />
SAM: www.sam-group.com<br />
<strong>Roche</strong> Group <strong>Media</strong> Relations<br />
Phone: +41 -61 688 8888 / e-mail: roche.mediarelations@roche.com<br />
Alexander Klauser (Head)<br />
Silvia Dobry<br />
Daniel Grotzky<br />
Štěpán Kráčala<br />
Claudia Schmitt<br />
16/32
Disclaimer: Cautionary statement regarding forward-looking statements<br />
This document contains certain forward-looking statements. These forward-looking statements may be identified by<br />
words such as ‘believes’, ‘expects’, ‘anticipates’, ‘projects’, ‘intends’, ‘should’, ‘seeks’, ‘estimates’, ‘future’ or similar<br />
expressions or by discussion of, among other things, strategy, goals, plans or intentions. Various factors may cause<br />
actual results to differ materially in the future from those reflected in forward-looking statements contained in this<br />
document, among others: (1) pricing and product initiatives of competitors; (2) legislative and regulatory developments<br />
and economic conditions; (3) delay or inability in obtaining regulatory approvals or bringing products to market; (4)<br />
fluctuations in currency exchange rates and general financial market conditions; (5) uncertainties in the discovery,<br />
development or marketing of new products or new uses of existing products, including without limitation negative<br />
results of clinical trials or research projects, unexpected side effects of pipeline or marketed products; (6) increased<br />
government pricing pressures; (7) interruptions in production; (8) loss of or inability to obtain adequate protection for<br />
intellectual property rights; (9) litigation; (10) loss of key executives or other employees; and (11) adverse publicity and<br />
news coverage. The statement regarding earnings per share growth is not a profit forecast and should not be interpreted<br />
to mean that <strong>Roche</strong>’s earnings or earnings per share for any current or future period will necessarily match or exceed the<br />
historical published earnings or earnings per share of <strong>Roche</strong><br />
17/32
Appendix: Tables<br />
1. Sales January to December 2013 and 2012 19<br />
2. Quarterly sales and constant exchange rate sales growth by Division in 2013 and 2012 ........................................................................ 20<br />
3. Pharmaceuticals Division ........................................................................................................................................................................... 21<br />
4. Top 20 Pharmaceuticals Division product sales and constant exchange rate growth YTD Dec 2013 vs. YTD Dec 2012: US, Europe,<br />
Japan and International* ........................................................................................................................................................................................ 22<br />
5. Top 20 Pharmaceuticals Division quarterly product sales and quarterly constant exchange rate sales growth ................................... 23<br />
6. Top 20 Pharmaceuticals Division quarterly product sales and quarterly constant exchange rate sales growth United States ............ 24<br />
7. Top 20 Pharmaceuticals Division quarterly product sales and quarterly constant exchange rate sales growth Europe ...................... 25<br />
8. Top 20 Pharmaceuticals Division quarterly product sales and quarterly constant exchange rate sales growth Japan ......................... 26<br />
9. Top 20 Pharmaceuticals Division quarterly product sales and quarterly constant exchange rate sales growth International* .......... 27<br />
10. <strong>Roche</strong> Group consolidated income statement for the year ended 31 December 2013 | in millions of CHF 28<br />
11. Core results reconciliation - 2013 | in millions of CHF 29<br />
12. Divisional core results reconciliation - 2013 | in millions of CHF 30<br />
13. <strong>Roche</strong> Group consolidated balance sheet | in millions of CHF 31<br />
14. <strong>Roche</strong> Group consolidated statement of cash flows | in millions of CHF 32<br />
18/32
1. Sales January to December 2013 and 2012<br />
CHF millions<br />
Twelve months ended<br />
31 December<br />
% change<br />
2013 2012 At CER* In CHF In USD<br />
Pharmaceuticals Division 36,304 35,232 7 3 4<br />
United States 15,097 13,856 10 9 10<br />
Europe 9,254 8,952 2 3 5<br />
Japan 3,405 4,108 2 -17 -16<br />
International** 8,548 8,316 8 3 4<br />
Diagnostics Division 10,476 10,267 4 2 3<br />
<strong>Roche</strong> Group 46,780 45,499 6 3 4<br />
* Constant exchange rates versus YTD December 2012;<br />
**Asia–Pacific, EEMEA (Eastern Europe, Middle East and Africa), Latin America, Canada, Others<br />
19/32
2. Quarterly sales and constant exchange rate sales growth by Division in 2013 and 2012<br />
CHF millions Q4 2012<br />
Q4 2012<br />
vs.<br />
Q4 2011<br />
Q1 2013<br />
Q1 2013<br />
vs.<br />
Q1 2012<br />
Q2 2013<br />
Q2 2013<br />
vs.<br />
Q2 2012<br />
Q3 2013<br />
Q3 2013<br />
vs.<br />
Q3 2012<br />
Q4 2013<br />
Q4 2013<br />
vs.<br />
Q4 2012<br />
Pharmaceuticals Division 9,034 7 9,170 7 8,992 4 9,028 9 9,114 7<br />
United States 3,586 13 3,912 13 3,641 7 3,876 16 3,668 5<br />
Europe 2,237 0 2,314 1 2,338 2 2,300 3 2,302 2<br />
Japan 1,142 5 826 2 846 2 820 4 913 2<br />
International* 2,069 6 2,118 8 2,167 2 2,032 5 2,231 18<br />
Diagnostics Division 2,771 4 2,419 1 2,714 4 2,544 7 2,799 5<br />
<strong>Roche</strong> Group 11,805 6 11,589 6 11,706 4 11,572 8 11,913 7<br />
*Asia–Pacific, EEMEA (Eastern Europe, Middle East and Africa), Latin America, Canada, Others<br />
20/32
3. Pharmaceuticals Division<br />
Top-selling pharmaceuticals<br />
and recent new launches<br />
Jan.-Dec. 2013<br />
Total United States Europe Japan International**<br />
CHF m %* CHF m %* CHF m %* CHF m %* CHF m %*<br />
MabThera/Rituxan 6,951 6% 3,329 8% 1,918 3% 249 6% 1,455 6%<br />
Avastin 6,254 13% 2,575 5% 1,919 14% 717 15% 1,043 30%<br />
Herceptin 6,079 6% 1,787 9% 2,191 -1% 294 8% 1,807 11%<br />
Lucentis 1,689 15% 1,689 15% - - - - - -<br />
Xeloda 1,509 2% 616 0% 315 -4% 107 4% 471 8%<br />
Tarceva 1,339 4% 604 7% 343 -5% 99 10% 293 8%<br />
Pegasys 1,312 -19% 307 -43% 356 -11% 52 -21% 597 -3%<br />
Actemra/RoActemra 1,037 30% 314 32% 360 27% 197 21% 166 49%<br />
CellCept 874 -2% 204 21% 238 -12% 68 10% 364 -7%<br />
Xolair 790 13% 790 13% - - - - - -<br />
Zelboraf 354 52% 123 11% 194 65% - - 37 ***<br />
Perjeta 326 498% 219 311% 68 *** 23 - 16 ***<br />
Kadcyla 234 - 222 - 9 - - - 3 -<br />
Erivedge 75 161% 66 132% 8 - - - 1 -<br />
Gazyva 3 - 3 - - - - - - -<br />
* At constant exchange rates versus YTD December 2012;<br />
**Asia–Pacific, EEMEA (Eastern Europe, Middle East and Africa), Latin America, Canada, Others<br />
*** Over +500%<br />
21/32
4. Top 20 Pharmaceuticals Division product sales and constant exchange rate growth YTD Dec 2013 vs. YTD Dec 2012: US, Europe, Japan and<br />
International*<br />
CHF millions<br />
Total United States Europe Japan International<br />
CHF m % CHF m % CHF m % CHF m % CHF m %<br />
MabThera/Rituxan 6,951 6% 3,329 8% 1,918 3% 249 6% 1,455 6%<br />
Avastin 6,254 13% 2,575 5% 1,919 14% 717 15% 1,043 30%<br />
Herceptin 6,079 6% 1,787 9% 2,191 -1% 294 8% 1,807 11%<br />
Lucentis 1,689 15% 1,689 15% - - - - - -<br />
Xeloda 1,509 2% 616 0% 315 -4% 107 4% 471 8%<br />
Tarceva 1,339 4% 604 7% 343 -5% 99 10% 293 8%<br />
Pegasys 1,312 -19% 307 -43% 356 -11% 52 -21% 597 -3%<br />
Actemra/RoActemra 1,037 30% 314 32% 360 27% 197 21% 166 49%<br />
CellCept 874 -2% 204 21% 238 -12% 68 10% 364 -7%<br />
Xolair 790 13% 790 13% - - - - - -<br />
Valcyte/Cymevene 693 10% 358 12% 174 -1% - - 161 19%<br />
Activase/TNKase 683 19% 635 20% - - - - 48 0%<br />
Tamiflu 635 19% 428 24% 18 110% 105 -8% 84 41%<br />
Pulmozyme 572 8% 355 12% 124 2% 0 73% 93 5%<br />
NeoRecormon/Epogin 520 -18% - - 218 -26% 100 -28% 202 0%<br />
Mircera 425 24% - - 104 25% 214 27% 107 19%<br />
Zelboraf 354 52% 123 11% 194 65% - - 37 **<br />
Perjeta 326 498% 219 311% 68 ** 23 - 16 **<br />
Madopar 313 4% - - 112 -1% 19 5% 182 7%<br />
Nutropin 274 -9% 268 -8% - - - - 6 -14%<br />
*Asia–Pacific, EEMEA (Eastern Europe, Middle East and Africa), Latin America, Canada, Others<br />
** Over +500%<br />
22/32
5. Top 20 Pharmaceuticals Division quarterly product sales and quarterly constant exchange rate sales growth<br />
CHF millions Q4 2012<br />
Q4 2012<br />
vs.<br />
Q4 2011<br />
Q1 2013<br />
Q1 2013<br />
vs.<br />
Q1 2012<br />
Q2 2013<br />
Q2 2013<br />
vs.<br />
Q2 2012<br />
Q3 2013<br />
Q3 2013<br />
vs.<br />
Q3 2012<br />
Q4 2013<br />
Q4 2013<br />
vs.<br />
Q4 2012<br />
MabThera/Rituxan 1,709 7% 1,696 6% 1,705 0% 1,805 12% 1,745 7%<br />
Avastin 1,455 8% 1,527 11% 1,566 13% 1,617 14% 1,544 13%<br />
Herceptin 1,457 8% 1,572 11% 1,510 0% 1,512 7% 1,485 7%<br />
Lucentis 368 -9% 393 1% 427 18% 431 21% 438 22%<br />
Xeloda 374 5% 383 1% 388 3% 393 6% 345 -3%<br />
Tarceva 325 -3% 336 0% 355 9% 327 5% 321 4%<br />
Pegasys 372 -5% 375 -15% 349 -24% 303 -16% 285 -20%<br />
Actemra/RoActemra 241 30% 238 32% 258 33% 267 33% 274 23%<br />
CellCept 225 1% 229 4% 236 1% 216 -2% 193 -10%<br />
Xolair 175 10% 185 12% 201 10% 204 14% 200 17%<br />
Valcyte/Cymevene 160 9% 166 8% 167 8% 166 0% 194 26%<br />
Activase/TNKase 147 17% 190 35% 151 3% 173 18% 169 19%<br />
Tamiflu 319 449% 335 84% 45 44% 34 115% 221 -27%<br />
Pulmozyme 141 4% 140 9% 138 7% 134 0% 160 18%<br />
NeoRecormon/Epogin 153 -25% 131 -22% 138 -20% 131 -16% 120 -14%<br />
Mircera 111 2% 94 12% 106 35% 107 29% 118 23%<br />
Zelboraf 77 271% 84 154% 87 46% 89 38% 94 26%<br />
Perjeta 30 - 50 - 58 * 78 262% 140 394%<br />
Madopar 75 5% 80 9% 78 -4% 77 3% 78 9%<br />
Nutropin 73 -5% 73 -6% 71 -8% 69 -8% 61 -12%<br />
* Over +500%<br />
23/32
6. Top 20 Pharmaceuticals Division quarterly product sales and quarterly constant exchange rate sales growth United States<br />
CHF millions Q4 2012<br />
Q4 2012<br />
vs.<br />
Q4 2011<br />
Q1 2013<br />
Q1 2013<br />
vs.<br />
Q1 2012<br />
Q2 2013<br />
Q2 2013<br />
vs.<br />
Q2 2012<br />
Q3 2013<br />
Q3 2013<br />
vs.<br />
Q3 2012<br />
Q4 2013<br />
Q4 2013<br />
vs.<br />
Q4 2012<br />
MabThera/Rituxan 764 7% 850 12% 807 -1% 917 20% 755 2%<br />
Avastin 586 1% 661 3% 629 3% 694 10% 591 4%<br />
Herceptin 415 11% 476 17% 420 1% 479 14% 412 3%<br />
Lucentis 368 -9% 393 1% 427 18% 431 21% 438 22%<br />
Xeloda 153 6% 160 0% 155 -3% 165 8% 136 -8%<br />
Tarceva 147 5% 156 14% 169 18% 148 5% 131 -8%<br />
Pegasys 103 -17% 109 -30% 92 -40% 62 -51% 44 -55%<br />
Actemra/RoActemra 70 58% 73 45% 77 33% 83 33% 81 20%<br />
CellCept 46 0% 54 60% 53 17% 51 13% 46 5%<br />
Xolair 175 10% 185 12% 201 10% 204 14% 200 17%<br />
Valcyte/Cymevene 83 18% 78 4% 92 14% 91 10% 97 19%<br />
Activase/TNKase 133 17% 178 36% 137 3% 162 19% 158 22%<br />
Tamiflu 256 - 203 171% 10 -41% 26 * 189 -24%<br />
Pulmozyme 81 8% 93 17% 86 8% 85 6% 91 16%<br />
NeoRecormon/Epogin - - - - - - - - - -<br />
Mircera - - - - - - - - - -<br />
Zelboraf 29 44% 32 19% 35 15% 28 12% 28 -1%<br />
Perjeta 28 - 44 - 44 * 48 129% 83 201%<br />
Madopar - - - - - - - - - -<br />
Nutropin 72 -5% 72 -6% 69 -8% 67 -7% 60 -13%<br />
* Over +500%<br />
24/32
7. Top 20 Pharmaceuticals Division quarterly product sales and quarterly constant exchange rate sales growth Europe<br />
CHF millions Q4 2012<br />
Q4 2012<br />
vs.<br />
Q4 2011<br />
Q1 2013<br />
Q1 2013<br />
vs.<br />
Q1 2012<br />
Q2 2013<br />
Q2 2013<br />
vs.<br />
Q2 2012<br />
Q3 2013<br />
Q3 2013<br />
vs.<br />
Q3 2012<br />
Q4 2013<br />
Q4 2013<br />
vs.<br />
Q4 2012<br />
MabThera/Rituxan 468 8% 477 2% 482 3% 487 6% 472 0%<br />
Avastin 436 13% 466 15% 481 17% 489 17% 483 9%<br />
Herceptin 541 4% 558 1% 552 -2% 544 -1% 537 -2%<br />
Lucentis - - - - - - - - - -<br />
Xeloda 78 -1% 81 -4% 82 -2% 80 1% 72 -9%<br />
Tarceva 85 -11% 87 -12% 88 -4% 84 0% 84 -3%<br />
Pegasys 92 -2% 96 -10% 100 -8% 80 -14% 80 -14%<br />
Actemra/RoActemra 78 35% 83 29% 91 31% 91 26% 95 21%<br />
CellCept 62 -13% 61 -13% 58 -18% 60 -11% 59 -5%<br />
Xolair - - - - - - - - - -<br />
Valcyte/Cymevene 41 -8% 44 -1% 42 -5% 36 -22% 52 28%<br />
Activase/TNKase - - - - - - - - - -<br />
Tamiflu - - 8 54% 1 -58% 0 -76% 9 -<br />
Pulmozyme 31 6% 31 -3% 31 4% 31 6% 31 1%<br />
NeoRecormon/Epogin 61 -23% 57 -25% 56 -31% 55 -26% 50 -19%<br />
Mircera 21 -57% 24 -32% 26 142% 26 74% 28 29%<br />
Zelboraf 44 * 46 * 45 51% 51 36% 52 17%<br />
Perjeta 2 - 5 - 13 - 19 * 31 *<br />
Madopar 28 -5% 28 -3% 28 -2% 28 2% 28 -1%<br />
Nutropin - - - - - - - - - -<br />
* Over +500%<br />
25/32
8. Top 20 Pharmaceuticals Division quarterly product sales and quarterly constant exchange rate sales growth Japan<br />
CHF millions Q4 2012<br />
Q4 2012<br />
vs.<br />
Q4 2011<br />
Q1 2013<br />
Q1 2013<br />
vs.<br />
Q1 2012<br />
Q2 2013<br />
Q2 2013<br />
vs.<br />
Q2 2012<br />
Q3 2013<br />
Q3 2013<br />
vs.<br />
Q3 2012<br />
Q4 2013<br />
Q4 2013<br />
vs.<br />
Q4 2012<br />
MabThera/Rituxan 81 5% 54 0% 64 6% 62 8% 69 8%<br />
Avastin 224 20% 159 18% 183 18% 177 15% 198 12%<br />
Herceptin 93 12% 66 6% 75 7% 71 7% 82 11%<br />
Lucentis - - - - - - - - - -<br />
Xeloda 35 12% 26 8% 28 5% 26 3% 27 0%<br />
Tarceva 30 6% 21 8% 24 -2% 25 8% 29 25%<br />
Pegasys 21 -6% 13 -16% 14 -18% 13 -22% 12 -28%<br />
Actemra/RoActemra 57 -7% 41 8% 49 23% 50 26% 57 24%<br />
CellCept 22 14% 15 8% 18 13% 17 13% 18 8%<br />
Xolair - - - - - - - - - -<br />
Valcyte/Cymevene - - - - - - - - - -<br />
Activase/TNKase - - - - - - - - - -<br />
Tamiflu 43 57% 84 6% 4 121% -1 -73% 18 -47%<br />
Pulmozyme - - - - 0 308% 0 29% 0 12%<br />
NeoRecormon/Epogin 40 -46% 25 -37% 26 -29% 25 -22% 24 -22%<br />
Mircera 65 83% 44 46% 53 21% 55 26% 62 21%<br />
Zelboraf - - - - - - - - - -<br />
Perjeta - - - - - - 5 - 18 -<br />
Madopar 6 11% 4 8% 5 3% 5 5% 5 3%<br />
Nutropin - - - - - - - - - -<br />
26/32
9. Top 20 Pharmaceuticals Division quarterly product sales and quarterly constant exchange rate sales growth International*<br />
CHF millions Q4 2012<br />
Q4 2012<br />
vs.<br />
Q4 2011<br />
Q1 2013<br />
Q1 2013<br />
vs.<br />
Q1 2012<br />
Q2 2013<br />
Q2 2013<br />
vs.<br />
Q2 2012<br />
Q3 2013<br />
Q3 2013<br />
vs.<br />
Q3 2012<br />
Q4 2013<br />
Q4 2013<br />
vs.<br />
Q4 2012<br />
MabThera/Rituxan 396 4% 315 -2% 352 -3% 339 3% 449 26%<br />
Avastin 209 3% 241 26% 273 29% 257 19% 272 49%<br />
Herceptin 408 10% 472 19% 463 -1% 418 8% 454 21%<br />
Lucentis - - - - - - - - - -<br />
Xeloda 108 4% 116 3% 123 13% 122 10% 110 9%<br />
Tarceva 63 -11% 72 -12% 74 12% 70 13% 77 27%<br />
Pegasys 156 2% 157 -4% 143 -21% 148 18% 149 1%<br />
Actemra/RoActemra 36 63% 41 53% 41 57% 43 59% 41 31%<br />
CellCept 95 10% 99 -4% 107 6% 88 -5% 70 -24%<br />
Xolair - - - - - - - - - -<br />
Valcyte/Cymevene 36 13% 44 27% 33 9% 39 3% 45 38%<br />
Activase/TNKase 14 20% 12 27% 14 -5% 11 -1% 11 -13%<br />
Tamiflu 20 164% 40 132% 30 161% 9 -17% 5 -72%<br />
Pulmozyme 29 -5% 16 -6% 21 5% 18 -25% 38 41%<br />
NeoRecormon/Epogin 52 0% 49 -3% 56 2% 51 3% 46 -2%<br />
Mircera 25 6% 26 28% 27 19% 26 11% 28 20%<br />
Zelboraf 4 - 6 ** 7 ** 10 489% 14 425%<br />
Perjeta - - 1 - 1 - 6 - 8 **<br />
Madopar 41 13% 48 17% 45 -6% 44 3% 45 18%<br />
Nutropin 1 -17% 1 -13% 2 -12% 2 -25% 1 -7%<br />
*Asia–Pacific, EEMEA (Eastern Europe, Middle East and Africa), Latin America, Canada, Others<br />
** Over +500%<br />
27/32
10. <strong>Roche</strong> Group consolidated income statement for the year ended 31 December 2013 | in millions<br />
of CHF<br />
Pharmaceuticals<br />
Diagnostics Corporate Group<br />
Sales 36,304 10,476 - 46,780<br />
Royalties and other operating income 1,702 130 - 1,832<br />
Cost of sales (7,014) (4,934) - (11,948)<br />
Marketing and distribution (5,844) (2,529) - (8,373)<br />
Research and development (8,189) (1,081) - (9,270)<br />
General and administration (1,326) (821) (498) (2,645)<br />
Operating profit 15,633 1,241 (498) 16,376<br />
Financing costs (1,580)<br />
Other financial income (expense) (119)<br />
Profit before taxes 14,677<br />
Income taxes (3,304)<br />
Net income 11,373<br />
Attributable to<br />
- <strong>Roche</strong> shareholders 11,164<br />
- Non-controlling interests 209<br />
Earnings per share and non-voting equity security<br />
Basic (CHF) 13.16<br />
Diluted (CHF) 12.93<br />
28/32
11. Core results reconciliation - 2013 | in millions of CHF<br />
IFRS<br />
Global<br />
restructuring<br />
Intangibles<br />
amortisation<br />
Intangibles<br />
impairment<br />
Alliances &<br />
business<br />
combinations<br />
Legal &<br />
environmental<br />
Pension plan<br />
settlements<br />
Normalisation of<br />
ECP tax benefit<br />
Core<br />
Sales 46,780 - - - - - - - 46,780<br />
Royalties and other<br />
operating income 1,832 - - - - - - - 1,832<br />
Cost of sales (11,948) (386) 442 - - - - - (11,892)<br />
Marketing and<br />
distribution (8,373) 127 5 - - - - - (8,241)<br />
Research and<br />
development (9,270) 152 56 362 - - - - (8,700)<br />
General and<br />
administration (2,645) 273 - 288 32 196 (19) - (1,875)<br />
Operating profit 16,376 166 503 650 32 196 (19) - 17,904<br />
Financing costs (1,580) - - - - - - - (1,580)<br />
Other financial<br />
income (expense) (119) - - - - - - - (119)<br />
Profit before taxes 14,677 166 503 650 32 196 (19) - 16,205<br />
Income taxes (3,304) (2) (168) (131) (4) (55) 7 (22) (3,679)<br />
Net income 11,373 164 335 519 28 141 (12) (22) 12,526<br />
Attributable to<br />
- <strong>Roche</strong><br />
shareholders 11,164 164 334 519 28 141 (12) (22) 12,316<br />
- Non-controlling<br />
interests 209 - 1 - - - - - 210<br />
EPS 12.93 0.19 0.39 0.60 0.03 0.17 (0.01) (0.03) 14.27<br />
29/32
12. Divisional core results reconciliation - 2013 | in millions of CHF<br />
IFRS<br />
Global<br />
restructuring<br />
Intangibles<br />
amortisation<br />
Intangibles<br />
impairment<br />
Alliances &<br />
business<br />
combinations<br />
Legal &<br />
environmental<br />
Pension plan<br />
settlements<br />
Core<br />
Pharmaceuticals<br />
Sales 36,304 - - - - - - 36,304<br />
Royalties and other<br />
operating income 1,702 - - - - - - 1,702<br />
Cost of sales (7,014) (461) 122 - - - - (7,353)<br />
Marketing and distribution (5,844) 49 - - - - - (5,795)<br />
Research and development (8,189) 101 55 350 - - - (7,683)<br />
General and administration (1,326) 197 - - 3 74 (15) (1,067)<br />
Operating profit 15,633 (114) 177 350 3 74 (15) 16,108<br />
Diagnostics<br />
Sales 10,476 - - - - - - 10,476<br />
Royalties and other<br />
operating income 130 - - - - - - 130<br />
Cost of sales (4,934) 75 320 - - - - (4,539)<br />
Marketing and distribution (2,529) 78 5 - - - - (2,446)<br />
Research and development (1,081) 51 1 12 - - - (1,017)<br />
General and administration (821) 67 - 288 13 28 (2) (427)<br />
Operating profit 1,241 271 326 300 13 28 (2) 2,177<br />
Corporate<br />
General and administration (498) 9 - - 16 94 (2) (381)<br />
Operating profit (498) 9 - - 16 94 (2) (381)<br />
30/32
13. <strong>Roche</strong> Group consolidated balance sheet | in millions of CHF<br />
31 December<br />
2013<br />
31 December<br />
2012<br />
31 December<br />
2011<br />
Non-current assets<br />
Property, plant and equipment 15,760 15,402 16,201<br />
Goodwill 7,145 7,480 7,843<br />
Intangible assets 3,944 4,214 5,126<br />
Deferred tax assets 4,707 4,849 2,753<br />
Defined benefit plan assets 636 678 581<br />
Other non-current assets 811 814 844<br />
Total non-current assets 33,003 33,437 33,348<br />
Current assets<br />
Inventories 5,906 5,542 5,060<br />
Accounts receivable 8,808 9,465 9,799<br />
Current income tax assets 218 339 222<br />
Other current assets 2,297 2,034 1,864<br />
Marketable securities 7,935 9,461 7,433<br />
Cash and cash equivalents 4,000 4,530 3,854<br />
Total current assets 29,164 31,371 28,232<br />
Total assets 62,167 64,808 61,580<br />
Non-current liabilities<br />
Long-term debt (16,423) (17,860) (23,459)<br />
Deferred tax liabilities (1,282) (1,397) (606)<br />
Defined benefit plan liabilities (6,062) (7,231) (5,498)<br />
Provisions (1,097) (1,042) (991)<br />
Other non-current liabilities (302) (319) (310)<br />
Total non-current liabilities (25,166) (27,849) (30,864)<br />
Current liabilities<br />
Short-term debt (2,220) (6,730) (3,394)<br />
Current income tax liabilities (1,805) (2,210) (2,206)<br />
Provisions (2,148) (2,158) (1,742)<br />
Accounts payable (2,162) (1,945) (2,053)<br />
Other current liabilities (7,425) (7,166) (6,815)<br />
Total current liabilities (15,760) (20,209) (16,210)<br />
Total liabilities (40,926) (48,058) (47,074)<br />
Total net assets 21,241 16,750 14,506<br />
Equity<br />
Capital and reserves attributable to <strong>Roche</strong><br />
shareholders 19,294 14,514 12,116<br />
Equity attributable to non-controlling interests 1,947 2,236 2,390<br />
Total equity 21,241 16,750 14,506<br />
31/32
14. <strong>Roche</strong> Group consolidated statement of cash flows | in millions of CHF<br />
2013 2012<br />
Cash flows from operating activities<br />
Cash generated from operations 20,796 19,984<br />
(Increase) decrease in net working capital (209) (523)<br />
Payments made for defined benefit plans (483) (439)<br />
Utilisation of provisions (1,000) (828)<br />
Disposal of products 6 138<br />
Other operating cash flows 3 2<br />
Cash flows from operating activities, before income taxes paid 19,113 18,334<br />
Income taxes paid (3,341) (3,329)<br />
Total cash flows from operating activities 15,772 15,005<br />
Cash flows from investing activities<br />
Purchase of property, plant and equipment (2,451) (2,171)<br />
Purchase of intangible assets (403) (235)<br />
Disposal of property, plant and equipment 65 107<br />
Disposal of intangible assets - -<br />
Business combinations (233) (36)<br />
Divestment of subsidiaries 2 8<br />
Interest and dividends received 51 39<br />
Sales of marketable securities 47,954 40,934<br />
Purchases of marketable securities (46,310) (43,158)<br />
Other investing cash flows 23 (2)<br />
Total cash flows from investing activities (1,302) (4,514)<br />
Cash flows from financing activities<br />
Proceeds from issue of bonds and notes - 2,698<br />
Redemption and repurchase of bonds and notes (6,633) (4,326)<br />
Increase (decrease) in commercial paper 404 (687)<br />
Increase (decrease) in other debt 151 153<br />
Hedging and collateral arrangements 247 172<br />
Equity contribution by non-controlling interests – capital injection 20 -<br />
Interest paid (1,299) (1,514)<br />
Dividends paid (6,362) (5,888)<br />
Equity-settled equity compensation plans, net of transactions in own equity (1,190) (301)<br />
Other financing cash flows (7) (1)<br />
Total cash flows from financing activities (14,669) (9,694)<br />
Net effect of currency translation on cash and cash equivalents (331) (121)<br />
Increase (decrease) in cash and cash equivalents (530) 676<br />
Cash and cash equivalents at beginning of period 4,530 3,854<br />
Cash and cash equivalents at end of period 4,000 4,530<br />
32/32


