RLE Progress Report No - Research Laboratory of Electronics - MIT
RLE Progress Report No - Research Laboratory of Electronics - MIT
RLE Progress Report No - Research Laboratory of Electronics - MIT
You also want an ePaper? Increase the reach of your titles
YUMPU automatically turns print PDFs into web optimized ePapers that Google loves.
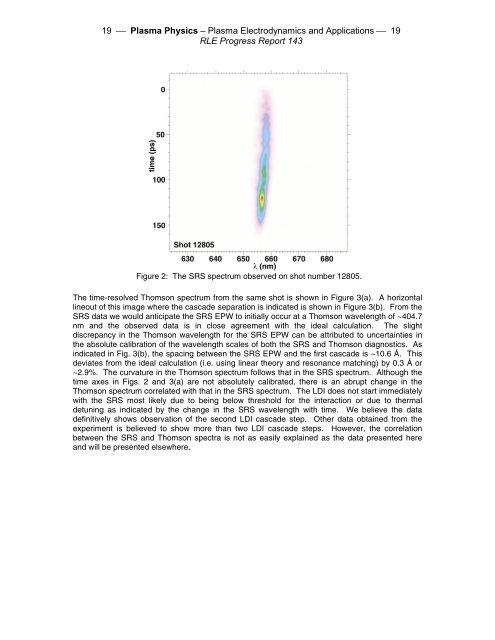
Figure 2: The SRS spectrum observed on shot number 12805.<br />
The time-resolved Thomson spectrum from the same shot is shown in Figure 3(a). A horizontal<br />
lineout <strong>of</strong> this image where the cascade separation is indicated is shown in Figure 3(b). From the<br />
SRS data we would anticipate the SRS EPW to initially occur at a Thomson wavelength <strong>of</strong> ~404.7<br />
nm and the observed data is in close agreement with the ideal calculation. The slight<br />
discrepancy in the Thomson wavelength for the SRS EPW can be attributed to uncertainties in<br />
the absolute calibration <strong>of</strong> the wavelength scales <strong>of</strong> both the SRS and Thomson diagnostics. As<br />
indicated in Fig. 3(b), the spacing between the SRS EPW and the first cascade is ~10.6 Å. This<br />
deviates from the ideal calculation (i.e. using linear theory and resonance matching) by 0.3 Å or<br />
~2.9%. The curvature in the Thomson spectrum follows that in the SRS spectrum. Although the<br />
time axes in Figs. 2 and 3(a) are not absolutely calibrated, there is an abrupt change in the<br />
Thomson spectrum correlated with that in the SRS spectrum. The LDI does not start immediately<br />
with the SRS most likely due to being below threshold for the interaction or due to thermal<br />
detuning as indicated by the change in the SRS wavelength with time. We believe the data<br />
definitively shows observation <strong>of</strong> the second LDI cascade step. Other data obtained from the<br />
experiment is believed to show more than two LDI cascade steps. However, the correlation<br />
between the SRS and Thomson spectra is not as easily explained as the data presented here<br />
and will be presented elsewhere.


