Renewable energy report final - Kent County Council
Renewable energy report final - Kent County Council
Renewable energy report final - Kent County Council

Create successful ePaper yourself
Turn your PDF publications into a flip-book with our unique Google optimized e-Paper software.
RENEWABLE ENERGY IN KENT<br />
Select Committee Report<br />
2010<br />
<strong>Kent</strong> <strong>County</strong> <strong>Council</strong><br />
<strong>County</strong> Hall<br />
Maidstone<br />
ME14 1XQ<br />
08458 247247<br />
county.hall@kent.gov.uk
THIS PAGE IS INTENTIONALLY BLANK<br />
2
Contents<br />
Contents..................................................................................................................................................3<br />
Chairman’s Foreword..............................................................................................................................8<br />
I EXECUTIVE SUMMARY ....................................................................................................................9<br />
1.1 Committee membership...............................................................................................................9<br />
1.2 Terms of Reference.......................................................................................................................9<br />
1.3 Definition of <strong>Renewable</strong> Energy .................................................................................................10<br />
1.4 Evidence gathering......................................................................................................................10<br />
1.5 Reasons for establishing the Select Committee .........................................................................10<br />
1.6 Key findings.................................................................................................................................10<br />
1.7 Recommendations ......................................................................................................................12<br />
2 INTRODUCTION AND POLICY BACKGROUND................................................................................15<br />
2.1 Introduction ................................................................................................................................15<br />
2.2 Emissions targets ........................................................................................................................17<br />
2.3 CRC Energy Efficiency Scheme ....................................................................................................17<br />
2.4 What does CRC mean for <strong>Kent</strong> <strong>County</strong> <strong>Council</strong>? ........................................................................17<br />
2.5 <strong>Renewable</strong> Energy Strategy ........................................................................................................19<br />
2.6 Microgeneration Strategy...........................................................................................................19<br />
2.7 <strong>Renewable</strong> Energy Targets..........................................................................................................20<br />
2.8 Regeneration Framework ...........................................................................................................21<br />
2.9 <strong>Kent</strong> Environment Strategy.........................................................................................................21<br />
3 HOW MUCH ENERGY DO WE USE?...............................................................................................23<br />
3.1 UK Energy Consumption .............................................................................................................23<br />
3.2 <strong>Kent</strong> Energy Consumption ..........................................................................................................23<br />
3.3 <strong>Kent</strong> <strong>County</strong> <strong>Council</strong> Energy Consumption .................................................................................25<br />
3.4 Reducing <strong>energy</strong> consumption in <strong>Kent</strong> .......................................................................................26<br />
3.5 Reducing <strong>energy</strong> use by the KCC estate......................................................................................27<br />
3
3.6 Direction of Travel.......................................................................................................................29<br />
3.7 KCC Sustainable Construction Policy ..........................................................................................29<br />
3.8 Policies that have resulted in increased <strong>energy</strong> use...................................................................30<br />
3.9 Better Workplaces ......................................................................................................................30<br />
3.10 Street Lighting Policy...................................................................................................................31<br />
3.11 What needs to be done to further reduce <strong>energy</strong> use in the KCC estate?.................................31<br />
3.12 Sustainable Schools.....................................................................................................................34<br />
3.13 LASER...........................................................................................................................................35<br />
3.14 LASER electricity contracts..........................................................................................................35<br />
3.15 Local authority sale of renewable electricity..............................................................................36<br />
4 RENEWABLE ENERGY GENERATION..............................................................................................37<br />
4.1 <strong>Renewable</strong> generation in the UK ................................................................................................37<br />
4.2 <strong>Renewable</strong> Generation in the South East and <strong>Kent</strong>....................................................................37<br />
4.3 <strong>Renewable</strong> Energy Capacity in <strong>Kent</strong>............................................................................................39<br />
4.4 <strong>Renewable</strong> Generation on the KCC Estate..................................................................................41<br />
4.5 School <strong>Renewable</strong>s Project.........................................................................................................41<br />
4.6 <strong>Renewable</strong> technologies.............................................................................................................42<br />
4.7 <strong>Renewable</strong> Electricity..................................................................................................................42<br />
4.8 <strong>Renewable</strong> Heat..........................................................................................................................49<br />
4.9 <strong>Kent</strong> woodfuel industry...............................................................................................................54<br />
5 FUNDING.......................................................................................................................................59<br />
5.1 <strong>Renewable</strong> Electricity Support Mechanisms...............................................................................59<br />
5.2 The <strong>Renewable</strong>s Obligation (RO) ................................................................................................59<br />
5.3 Low Carbon Buildings Programme..............................................................................................60<br />
5.4 Feed in tariff (FIT).......................................................................................................................61<br />
5.5 <strong>Renewable</strong> Heat Incentive ..........................................................................................................64<br />
5.6 Energy Efficiency Funding for <strong>Kent</strong> Businesses...........................................................................64<br />
4
5.7 Funding for <strong>energy</strong> efficiency and renewables on the KCC estate ............................................65<br />
5.8 The Energy and Water Investment Fund ....................................................................................65<br />
5.9 The Building Energy Efficiency Programme (BEEP).....................................................................66<br />
5.10 Energy Service Companies ..........................................................................................................66<br />
5.11 Energy company funding for school renewable <strong>energy</strong> projects ...............................................68<br />
5.12 KCC options for future projects on its estate..............................................................................69<br />
5.13 Funding for Low‐Carbon Communities .......................................................................................69<br />
5.14 Funding for individual households..............................................................................................71<br />
6 ENERGY EFFICIENT BUILDINGS......................................................................................................73<br />
6.1 European Directive......................................................................................................................73<br />
6.2 Display Energy Certificates..........................................................................................................73<br />
6.3 Demand Reduction .....................................................................................................................73<br />
6.4 Warm Homes Greener Homes....................................................................................................74<br />
6.5 Public awareness and perception of <strong>energy</strong> efficiency ..............................................................75<br />
6.6 Area Based Housing Retrofit.......................................................................................................77<br />
6.7 Energy Efficiency and hard‐to‐treat homes................................................................................78<br />
6.8 Other approaches to <strong>energy</strong> efficiency in communities.............................................................78<br />
7 PLANNING FOR RENEWABLES.......................................................................................................79<br />
7.1 A changed planning hierarchy ....................................................................................................79<br />
7.2 Planning for a Low Carbon Future ..............................................................................................80<br />
7.3 A more local perspective ............................................................................................................80<br />
7.4 Local Development Frameworks ................................................................................................81<br />
7.5 Woking – C Plan ..........................................................................................................................82<br />
7.6 Permitted Development .............................................................................................................82<br />
7.7 Exceptions to permitted development .......................................................................................83<br />
7.8 <strong>Kent</strong> Downs Area of Outstanding Natural Beauty (AONB) .........................................................84<br />
8 ELECTRICITY TRANSMISSION, DISTRIBUTION AND STORAGE.......................................................86<br />
5
8 ELECTRICITY TRANSMISSION, DISTRIBUTION AND STORAGE.......................................................87<br />
8.1 National electricity transmission ................................................................................................87<br />
8.2 Intermittency of renewable sources...........................................................................................88<br />
8.3 Managing demand ......................................................................................................................89<br />
8.4 Managing supply.........................................................................................................................89<br />
8.5 European Super Grid...................................................................................................................90<br />
9 LOW‐CARBON TRANSPORT...........................................................................................................93<br />
9.1 Policies and targets for renewable transport <strong>energy</strong> .................................................................93<br />
9.2 Transport planning......................................................................................................................93<br />
9.3 The King Review ..........................................................................................................................93<br />
9.4 <strong>Renewable</strong> Transport Fuels.........................................................................................................94<br />
9.5 Biofuels and <strong>Kent</strong> ........................................................................................................................94<br />
9.6 Food versus Fuel .........................................................................................................................95<br />
9.7 Methane‐powered vehicles ........................................................................................................95<br />
9.8 Automotive Technology..............................................................................................................96<br />
9.9 Decarbonisation of electricity.....................................................................................................97<br />
9.10 <strong>Kent</strong> <strong>energy</strong> consumption from transport..................................................................................97<br />
9.11 <strong>Kent</strong> Integrated Transport Strategy ...........................................................................................98<br />
9.12 Air Quality and transport ............................................................................................................98<br />
9.13 Electric Vehicles ..........................................................................................................................98<br />
9.14 Changing driver behaviour........................................................................................................100<br />
10 ECONOMIC OPPORTUNITIES FROM THE TRANSITION TO LOW CARBON ENERGY ...........................................101<br />
10.1 National Strategy for Climate and Energy.................................................................................101<br />
10.2 Economic Opportunities ...........................................................................................................101<br />
10.3 ‘Low Carbon Opportunities for Growth’ ...................................................................................102<br />
10.4 Offshore wind development.....................................................................................................103<br />
10.5 <strong>Kent</strong> Wind Energy Directory......................................................................................................105<br />
6
10.6 Microgeneration Certification Scheme Accreditation ..............................................................106<br />
10.7 Industry confidence ..................................................................................................................106<br />
10.8 Sustainable Business Programme .............................................................................................108<br />
10.9 Low Carbon Futures Project......................................................................................................108<br />
10.10 <strong>Kent</strong> Excellence in Business Awards .....................................................................................110<br />
10.11 <strong>Kent</strong> Environment Awards ....................................................................................................110<br />
11 CONCLUSIONS.............................................................................................................................111<br />
Appendix 1: Glossary ............................................................................................................................113<br />
Appendix 2: Written Evidence ..............................................................................................................115<br />
Appendix 3: Hearings ............................................................................................................................117<br />
Appendix 4: Visits undertaken as part of select committee review .....................................................119<br />
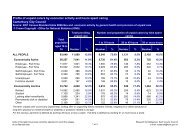
Appendix 5: Summary of questionnaire survey results ........................................................................120<br />
References ............................................................................................................................................126<br />
ACKNOWLEDGEMENTS.........................................................................................................................129<br />
7
Chairman’s Foreword<br />
Until the early 18 th century virtually all the <strong>energy</strong> used by mankind came<br />
from renewable resources. Between them water, wind, wood and muscle<br />
provided the power for home and industry. The age of fossil fuels began<br />
as the population grew and the industrial revolution gathered force.<br />
<strong>Renewable</strong> <strong>energy</strong> could no longer keep pace with demand and the<br />
intermittent nature of many renewable <strong>energy</strong> sources became more and<br />
more of a problem. Three hundred years later these same issues are with<br />
us once again as the availability of fossil fuels declines and worries about<br />
what we now call <strong>energy</strong> security increase.<br />
So far as electricity is concerned, a bigger and smarter grid can mitigate the problems to some<br />
extent; but it is not a cost free option and as the proportion of renewable generation increases<br />
we will inevitably see a time when overall generating capacity has to increase to meet the same<br />
level of demand. Even today 1 megawatt of wind <strong>energy</strong> cannot fully replace 1 megawatt of<br />
<strong>energy</strong> derived from fossil fuels, principally because it cannot be switched on and off as<br />
demand varies because it is dependent on how strongly the wind blows or the sun shines.<br />
There is clear public support for renewable <strong>energy</strong> in <strong>Kent</strong>. If this is to be maintained it is vital<br />
that the case for it is not overstated. The Committee’s view is that renewable <strong>energy</strong> resources<br />
are a useful addition to the <strong>energy</strong> mix available to help meet the problems of future <strong>energy</strong><br />
security. They are not at present a panacea enabling us to meet all future <strong>energy</strong> requirements.<br />
Most forms of renewable <strong>energy</strong> are not at present intrinsically cheaper than more<br />
conventional fuels; if anything the reverse is true, but this is likely to change as the supply of<br />
fossil fuels inevitably declines and renewable <strong>energy</strong> technology improves.<br />
In 2009 <strong>Kent</strong> <strong>County</strong> <strong>Council</strong> spent just under £24 million on buying <strong>energy</strong>. It is clear to us that<br />
this figure could be reduced substantially over the next few years by adopting a judicious<br />
mixture of improvements in <strong>energy</strong> efficiency and the exploitation of the subsidies available for<br />
the use of renewable <strong>energy</strong>. The county would simultaneously benefit from clear<br />
environmental improvements. The same is true for industry and households in <strong>Kent</strong>.<br />
The availability of good advice is vital to such a goal; but it is unusually hard to come by in this<br />
field. Too many of those offering advice see themselves as prophets of good practice or have a<br />
pecuniary interest in the technology they advocate. Therefore we believe that building KCC’s in<br />
house knowledge‐base and that of the county as a whole is vital to achieving success.<br />
Just as certainly we now face the prospect of very real financial penalties if we fail to reduce<br />
our environmental impact.<br />
In the Committee’s view the <strong>County</strong> <strong>Council</strong> now has a rare opportunity to exploit a situation in<br />
which financial, environmental and service considerations all point in the same direction. We<br />
would be foolish not to take it.<br />
May I thank all those who gave evidence to the Committee. Without them there could have<br />
been no <strong>report</strong>.<br />
Keith Ferrin<br />
Chairman, <strong>Renewable</strong> Energy Select Committee<br />
8
I<br />
EXECUTIVE SUMMARY<br />
1.1 Committee membership<br />
1.1.1 The Select Committee comprised eight Members of the <strong>County</strong> <strong>Council</strong>; seven<br />
Conservative and one Liberal Democrat.<br />
<strong>Kent</strong> <strong>County</strong> <strong>Council</strong> Members (<strong>County</strong> <strong>Council</strong>lors):<br />
Keith Ferrin<br />
(Cons)<br />
Charles Hibberd<br />
(Cons)<br />
David Hirst<br />
(Cons)<br />
Richard King<br />
(Cons)<br />
Tim Prater<br />
(Lib Dem)<br />
Chris Smith<br />
(Cons)<br />
Paulina Stockell<br />
(Cons)<br />
Elizabeth Tweed<br />
(Cons)<br />
1.2 Terms of Reference<br />
1.2.1 To determine existing and emerging national and local policies and strategies with<br />
regard to renewable <strong>energy</strong> and their effect on <strong>Kent</strong>.<br />
1.2.2 To establish a baseline position and future projections for <strong>Kent</strong> with regard to <strong>energy</strong><br />
requirements, generation and distribution including the contribution from renewable <strong>energy</strong>.<br />
1.2.3 To identify key challenges as well as opportunities in relation to renewable <strong>energy</strong> in<br />
<strong>Kent</strong>.<br />
1.2.4 To Identify and explore the views of suppliers and consumers in relation to renewable<br />
<strong>energy</strong>.<br />
1.2.5 Having considered the above, to make recommendations which will contribute to<br />
increased <strong>energy</strong> efficiency, <strong>energy</strong> security and prosperity for <strong>Kent</strong> residents and businesses as<br />
well as supporting the national transition to a low‐carbon future.<br />
9
1.3 Definition of <strong>Renewable</strong> Energy<br />
1.3.1 <strong>Renewable</strong> <strong>energy</strong>, which is replenished by natural processes as it is used, is defined by<br />
the EU as <strong>energy</strong> from: ‘non‐fossil <strong>energy</strong> sources (wind, solar, geothermal, wave, tidal,<br />
hydropower, biomass, landfill gas, sewage treatment plant gas and biogases).’ 1<br />
1.4 Evidence gathering<br />
1.4.1 The Select Committee trialled an alternative format for its evidence gathering and<br />
following initial desk research, approached a number of organisations for written evidence.<br />
Whilst awaiting responses, the Research Officer sought informal advice and information from<br />
KCC Officers. After studying the written material submitted, the Committee invited community<br />
groups and members of the public to give their views in writing, interviewed a number of<br />
individuals in person, carried out visits, attended conferences and circulated a questionnaire to<br />
<strong>Kent</strong> schools.<br />
1.4.2 A list of the witnesses who submitted written evidence is shown as Appendix 2. A list of<br />
witnesses attending hearings is at Appendix 3. Details of visits carried out are at Appendix 4 and<br />
results of the schools questionnaire, which received 47 responses, are at Appendix 5.<br />
1.5 Reasons for establishing the Select Committee<br />
1.5.1 The Select Committee was established by the Environment, Highways and Waste Policy<br />
Overview Committee following suggestions put forward by Dr Linda Davies, Director of<br />
Environment and Waste and Mr David Brazier, <strong>Council</strong> Member.<br />
1.5.2 The review has considered:‐<br />
1.6 Key findings<br />
Data on <strong>energy</strong> generation, consumption and distribution;<br />
The role of <strong>energy</strong> efficiency and renewable <strong>energy</strong> in increasing security of <strong>energy</strong><br />
supply and reducing harmful carbon emissions;<br />
<strong>Kent</strong>’s capacity for different types of renewable technology and factors affecting its<br />
development;<br />
The opportunities arising from the development of a new industry.<br />
1.6.1 For <strong>Kent</strong> to gain maximum benefit from the transition to a low‐carbon economy, it<br />
must welcome new ideas and technologies and encourage investment. It can do this by<br />
creating a favourable planning and regulatory environment; ensuring the right infrastructure is<br />
1 EU Directive 2001/77/EC amended and subsequently repealed by Directives 2003/30/EC and 2009/28/EC<br />
10
in place; that businesses are sustainable as well as geared up and ready to play their part and<br />
that people with the right skills are ‘grown’ locally.<br />
1.6.2 In April 2010, the government’s introduction of a Feed‐in Tariff to incentivise smallscale<br />
(up to 5MW) renewable electricity generation meant that technologies which were<br />
already desirable on environmental and <strong>energy</strong> security grounds became economically<br />
attractive. A change in legislation on the local authority sale of surplus electricity to the grid<br />
means that local authorities as well as communities and residents can make immediate savings<br />
on <strong>energy</strong> bills; earn income from long‐term investment in clean <strong>energy</strong> supplies and<br />
contribute to national targets for carbon reduction and renewable <strong>energy</strong> generation.<br />
1.6.3 Being <strong>energy</strong> efficient, and reducing the amount of <strong>energy</strong> we use is no longer a choice<br />
but a necessity. Energy efficiency alone, however, will not be enough to make the deep cuts in<br />
carbon emissions that are required and renewable, or other low‐carbon <strong>energy</strong> schemes will be<br />
required in order that <strong>Kent</strong> <strong>County</strong> <strong>Council</strong> does not incur penalties.<br />
1.6.4 There are clear advantages to <strong>Kent</strong> <strong>County</strong> <strong>Council</strong> ‘leading by example’ with its own<br />
activities and operations, and assisting others in <strong>Kent</strong> to contribute and to benefit. KCC<br />
Commercial Services is well placed to develop further its expertise and services in this field.<br />
1.6.5 Very substantial cost savings are possible, using a combination of behaviour change,<br />
building adaptation and <strong>energy</strong> efficiency as shown by the example of St Peter’s Church of<br />
England Primary School Aylesford..<br />
1.6.6 <strong>Kent</strong> is rich in community groups and individuals who are passionate about the<br />
environment and keen to pursue ideas for low‐carbon living and greater <strong>energy</strong> self‐sufficiency.<br />
With a small amount of support to get projects ‘off the ground’, such groups can be enabled to<br />
grow and thrive thus creating local resilience to a changing climate; greater community<br />
cohesion; and a network for sharing <strong>energy</strong> saving ideas and best practice across the county.<br />
1.6.7 As well as being ideally located to exploit renewable <strong>energy</strong> from the sun, wind and<br />
perhaps in future, the tides, <strong>Kent</strong> is lucky to have large areas of unmanaged, or undermanaged<br />
woodland that can be brought back into coppice‐management in order to achieve sustainable<br />
local supplies of wood fuel. There are multiple benefits to be gained from coppice‐management<br />
such as increased biodiversity, rural employment, improved access to the countryside and a<br />
reduced need for imported wood fuel.<br />
1.6.8 The decarbonisation of transport will require continued advances in vehicle technology,<br />
but perhaps more importantly, a cultural shift in the way people view their cars, and the<br />
journeys they make. KCC can, by its actions, help to pave the way for future changes.<br />
1.6.9 The successor to KCC’s ‘Towards 2010’ strategy document: ‘Bold Steps for <strong>Kent</strong>’ – will<br />
focus on growth in the <strong>Kent</strong> economy, tackling disadvantage and inspiring communities. The<br />
11
Select Committee believes that all three of these aims will be underpinned by the successful<br />
transition to a low‐carbon economy in <strong>Kent</strong> and the recommendations of this committee will<br />
seek to support them.<br />
1.7 Recommendations<br />
1. That KCC works with <strong>Kent</strong> District and Borough <strong>Council</strong>s and others to agree a Low Carbon<br />
and <strong>Renewable</strong> Energy Strategy for <strong>Kent</strong>. to enable the uptake of the most appropriate low<br />
carbon technologies. (page 107)<br />
2. That a Member Champion for Low‐Carbon and <strong>Renewable</strong> Energy is appointed to promote<br />
the implementation of the Strategy and <strong>report</strong> back to Cabinet and the Cabinet Climate<br />
Change Working Group on progress. (page 107)<br />
3. That KCC develops the existing expertise within KCC and Commercial Services (LASER) and<br />
builds capacity in order to ensure that the <strong>Council</strong> has access to sound, unbiased advice<br />
when taking <strong>energy</strong> efficiency and renewable <strong>energy</strong> schemes forward. (page 69)<br />
4. That KCC sets up new delivery mechanisms as appropriate in order to take advantage of<br />
emerging opportunities, allied to but separate from LASER, e.g. Energy Services Company<br />
(ESCO). (page 69)<br />
5. That KCC capitalises on opportunities in its own estate, and works with local authorities,<br />
<strong>energy</strong> network companies, landowners and prospective investors to ensure that a<br />
proactive approach is taken to the identification of sites for renewable <strong>energy</strong> schemes in<br />
the county, in order to encourage and enable investment. (page 107)<br />
6. That KCC reconfigures the Energy and Water Investment Fund, with a longer payback<br />
period, to enable continued provision of capital funding for <strong>energy</strong> efficiency measures in<br />
the estate and to allow for the longer‐term investment required for the installation of<br />
renewable <strong>energy</strong> systems.(page 66)<br />
7. That KCC facilitates access to emerging financial mechanisms, such as the new Green Deal<br />
and the Green Investment Bank, whereby schools, businesses and householders in <strong>Kent</strong> can<br />
take advantage of loan funding to pay for the installation of renewable <strong>energy</strong> and <strong>energy</strong><br />
efficiency systems on suitable properties, with repayments and term set to achieve a net<br />
saving in <strong>energy</strong> costs for the property and a reasonable rate of return over the period of<br />
the loan to investors (on a ‘Pay as you Save’ basis). (page 71)<br />
8. That KCC substantially drives down <strong>energy</strong> consumption in its estate. Each Directorate<br />
should be required to take action to improve <strong>energy</strong> efficiency and encourage behavioural<br />
and other changes; Building User Groups should have ‘<strong>energy</strong> usage and <strong>energy</strong> efficiency’<br />
as an agenda item at every meeting. (page 28)<br />
12
9. That KCC implements an immediate review of its properties to assess their suitability and<br />
develop strategies for the installation of renewable technologies, particularly photovoltaic<br />
(PV) panels, and encourages District and Borough <strong>Council</strong>s, housing providers, emergency<br />
services, health institutions and other targeted businesses to do the same in their estates,<br />
taking advantage of current incentives, in order to reduce <strong>energy</strong> costs; generate income<br />
and catalyse the acceptance of renewable technologies in the wider community. (page 63)<br />
10. That KCC uses <strong>energy</strong> display devices in prominent locations on its estate to encourage<br />
<strong>energy</strong> efficient behaviour (including where renewable <strong>energy</strong> installations are put in place,<br />
to increase awareness of the technology, the <strong>energy</strong> generation and the carbon‐savings).<br />
(page 76)<br />
11. That KCC lobbies the Department for Education to require schools to work with KCC to fulfil<br />
its CRC commitments and creates a direct incentive for schools to drive down their <strong>energy</strong><br />
use and carbon emissions, using a range of behavioural, <strong>energy</strong> efficiency and renewable<br />
<strong>energy</strong> options. (page 34)<br />
12. That KCC works with public agencies and approved suppliers, to provide a package of advice<br />
and support to schools, to enable them to benefit from <strong>energy</strong> efficiency work and<br />
renewable <strong>energy</strong> installations, at no net cost to the school or to KCC. (page 69)<br />
13. That, provided currently agreed procurement criteria are met, KCC considers giving<br />
preference, for the procurement of goods and services, to businesses who obtain<br />
accreditation through the South East Carbon Hub. (page 110)<br />
14. That KCC lobbies government, on planning issues, to:<br />
promote developments with a mixed heat demand suitable for district heating systems,<br />
which should be incorporated wherever possible.<br />
relax planning control for domestic renewable <strong>energy</strong> installations on listed buildings<br />
and properties affecting conservations areas where this does not detract from heritage<br />
objectives. (page 86)<br />
15. That KCC consults with District, Borough and other councils in <strong>Kent</strong> to determine what is<br />
needed to assist local authority planners and developers in making planning decisions<br />
relating to renewable <strong>energy</strong> applications, e.g. training, or an interactive planning tool.<br />
(page 86)<br />
16. That KCC supports low‐carbon community groups in the county by facilitating access to<br />
existing support and providing small grants of up to £5000 for advice or to assist with<br />
feasibility studies. (page 71)<br />
13
17. That KCC, working with District and Borough <strong>Council</strong>s ensures that <strong>Kent</strong> communities,<br />
including schools, businesses and households have access to clear and current information<br />
on <strong>energy</strong> efficiency and renewable <strong>energy</strong> opportunities, taking into account the Feed‐in<br />
Tariff and any subsequent incentives. (page 77)<br />
18. That KCC should work with organisations such as the Forestry Commission and Natural<br />
England, to invest in the sustainable production of wood fuel, through the regeneration of<br />
coppicing in <strong>Kent</strong>, by:<br />
Providing marketing expertise.<br />
Encouraging apprenticeships for young people wishing to enter the industry.<br />
Investigating the provision of a number of collection/chipping/distribution facilities,<br />
possibly based at recycling centres<br />
Ensuring that, where possible, newly designed KCC buildings include biomass boilers.<br />
(page 56)<br />
19. That, in view of the need for the UK to have a long term, sustainable mix of power supplies<br />
and due to the intermittent nature of some renewable <strong>energy</strong> sources, KCC presses for the<br />
provision of new generation low carbon power stations so that there is adequate back up<br />
capacity to cope with demand peaks, providing security of supply. (page 91)<br />
20. That KCC works with others, including District and Borough <strong>Council</strong>s, Network Rail and<br />
supermarkets, to assess the viability of establishing a network of public electric vehicle<br />
charging points in <strong>Kent</strong>. (page 99)<br />
21. That KCC regularly surveys its own vehicles, and business journeys to: identify (and review)<br />
work patterns in order to minimise business mileage and to prepare for the availability and<br />
purchase of electric vehicles, where appropriate. (page 100)<br />
22. That KCC adopts a policy of limiting its vehicles, except those attending emergencies, to a<br />
maximum speed of 56mph (90kph) in order to achieve greater fuel efficiency, in line with<br />
best commercial practice. (page 100)<br />
14
2 INTRODUCTION AND POLICY BACKGROUND<br />
‘… whatever our resources of primary <strong>energy</strong> may be in the future, we must, to be<br />
rational, obtain it without consumption of any material’.<br />
Nicola Tesla (1900) 2<br />
2.1 Introduction<br />
2.1.1 There is a growing awareness that we are coming to the end of an era characterised by<br />
plentiful fossil fuels and the rapid growth that accompanied their discovery and exploitation. A<br />
recent <strong>report</strong> by the UK Energy Research <strong>Council</strong> based on 500 studies concluded that global oil<br />
production will peak before 2030 and possibly within the next ten years. 3<br />
2.1.2 The International Energy Agency predicts that world primary <strong>energy</strong> demand will be<br />
40% higher in 2030 than in 2007 with more than three quarters of that increase coming from<br />
fossil fuels. However, if those trends are allowed to continue, serious impacts on our health<br />
and environment would result. 4<br />
2.1.3 UK <strong>energy</strong> production is in decline ‐ coal and nuclear power stations are being<br />
decommissioned as they come to the end of their operational lives and North Sea Gas supplies<br />
are dwindling; the UK at the end of 2008 had proven reserves of 0.29 trillion cubic metres of<br />
natural gas compared with the Russian Federation’s 44.38 trillion cubic metres 5 . The country is<br />
ever more reliant on imported fossil fuels – 80% of our gas is expected to be imported by 2020 ‐<br />
yet, for example, the UK has only 16 days worth of gas storage, so in a prolonged cold snap, we<br />
are particularly vulnerable to shortages 6 .<br />
2.1.4 The rise in domestic demand across Europe 7 coupled with higher <strong>energy</strong> costs means<br />
that in England the number of households in fuel poverty has risen threefold to 4.6 million in<br />
the period from 2001 to 2009. 8 So, there is clearly a need, based on these environmental,<br />
2 Tesla, N., ‘The Problem of Increasing Human Energy,’ The Century Illustrated Magazine, pp. 175‐211<br />
3 UKERC, 2009 Global Oil Depletion: An Assessment of the Evidence for a Near‐term Peak in Global Oil Production.<br />
London<br />
4 International Energy Agency, 2009 Why is our current <strong>energy</strong> pathway unsustainable?<br />
5 BP plc, 2010 Statistical Review of World Energy. London<br />
6 Ft.com/<strong>energy</strong> source – 9 th April 2010<br />
7 Bertoldi P., Atansiu B. (2007). Electricity consumption and efficiency trends in the enlarged European Union.<br />
European Communities:Luxembourg. 66pp.<br />
8 Consumer Focus, 2010 Fuel Poverty Charter. London<br />
15
logistical and social imperatives, to reduce our dependence on fossil <strong>energy</strong> to ensure security<br />
of supply into the future and it is widely accepted that the way to do this, is to diversify the<br />
‘<strong>energy</strong> mix’.<br />
2.1.5 International, European and UK <strong>energy</strong> policy is also very much driven by the need to<br />
drastically reduce carbon emissions to protect our atmosphere and this too has prompted a<br />
focus on low carbon <strong>energy</strong> generation from renewable sources. The proportion of the total<br />
<strong>energy</strong> demand which can be met in this way has been the subject of much conjecture, and<br />
whichever school of thought is subscribed to, the twin approach of increasing <strong>energy</strong> efficiency<br />
to reduce demand and increasing the proportion of <strong>energy</strong> generated from renewable sources,<br />
is the pragmatic solution.<br />
2.1.6 Though this review has not taken evidence on or considered nuclear power, any new<br />
generation nuclear power stations would not come online until around 2020, leaving us with an<br />
<strong>energy</strong> gap. A key element in favour of distributed generation (renewable <strong>energy</strong> generated<br />
and used locally) is the added security of supply that it brings.<br />
2.1.7 While a huge increase in renewable <strong>energy</strong> generation is needed across Europe,<br />
individual countries are free to decide upon their own <strong>energy</strong> mix 9 . The UK has a challenging<br />
target of 15% <strong>energy</strong> from renewables by 2020 which will require around 30% electricity to be<br />
generated renewably. Based on the evidence it has received, the Select Committee believe that<br />
we should take seriously concerns about the UK’s security of supply and, while some would<br />
argue there is no urgency, there are indications that <strong>energy</strong> shortages could occur within two<br />
or three years and there is a real risk of ‘brown outs’ between 2012 and 2020. 1011<br />
2.1.8 Geographical and other factors will mean that some locations will be better suited to<br />
particular renewable technologies, but in <strong>Kent</strong> we are lucky that we have the ingredients<br />
necessary to create a diverse mix of generation from renewable <strong>energy</strong> sources. 12<br />
2.1.9 For our future and that of our children and grandchildren, human ingenuity and our<br />
ability to harness immediately available, non‐polluting, sources of <strong>energy</strong>, coupled with policy<br />
measures to move us in the right direction, are seen as key to our having sustainable <strong>energy</strong><br />
supplies in the future.<br />
9 Charles Morgan, KCC International Affairs Group – written evidence<br />
10 Dr Howard Lee, Lecturer and Sustainability Champion, Hadlow College – written evidence<br />
11 Richard Knox‐Johnson, Chairman, Protect <strong>Kent</strong>: – ‘Keeping the Lights On’ Protect <strong>Kent</strong> Energy Conference<br />
presentation<br />
12 Karl Jansa, Business Development Manager, Locate in <strong>Kent</strong> – written evidence<br />
16
2.2 Emissions targets<br />
‘80% cut in UK CO 2 emissions by 2050’ 13<br />
2.2.1 A whole raft of policies is designed to reduce pollution from greenhouse gas emissions,<br />
and increase the proportion of <strong>energy</strong> obtained from renewable sources. Since the Kyoto<br />
Protocol was signed up to by the UK in 1997, and following on from the Energy White Paper in<br />
2003, emissions reduction targets have become more stringent and The Climate Change Act<br />
2008 commits the UK to an 80% cut in CO 2 emissions (on 1990 levels), by 2050. The legally<br />
binding Kyoto Pledge commits the UK to reducing overall greenhouse gas emissions by 12.5%<br />
by 2012.<br />
2.3 CRC Energy Efficiency Scheme<br />
2.3.1 This scheme, introduced in April, and known previously as the Carbon Reduction<br />
Commitment, is a mandatory carbon emissions trading scheme designed to help the UK to<br />
achieve its 80% cut in emissions. It is administered by the Environment Agency, and its aim is to<br />
ensure that large organisations in the public and private sectors address the amount of <strong>energy</strong><br />
they use, and the carbon emissions that result from their operations. One rationale behind<br />
such a measure, implemented at a time of financial constraint, is that the costs organisations<br />
incur in implementing the scheme will be offset by savings from reduced <strong>energy</strong> usage. 14 The<br />
large organisations the scheme is aimed at, account for around 10% of UK emissions.<br />
2.4 What does CRC mean for <strong>Kent</strong> <strong>County</strong> <strong>Council</strong>?<br />
2.4.1 <strong>Kent</strong> <strong>County</strong> <strong>Council</strong> (KCC) is one of around 20,000 large public and private sector<br />
organisations required to participate in the scheme, which for around 5000 organisations (KCC<br />
included), will involve the purchase of carbon allowances for each tonne of CO 2 emitted (based<br />
on the level of <strong>energy</strong> consumption in 2008). Allowances could potentially cost KCC £1.4<br />
million.<br />
2.4.2 Participants will be organised into ‘league tables’ whereby those that have successfully<br />
cut their emissions 15 get allowances back, and those who fail to act are penalised. KCC will<br />
benefit from a degree of protection initially through the achievement of the Carbon Trust<br />
13 Climate Change Act 2008. London: HMSO<br />
14 DECC, 2010 CRC Energy Efficiency Scheme User Guide<br />
15 CRC emissions ‐ which are a proportion of total emissions<br />
17
Standard certification award, which provides ‘early action credits’. Allowances received back<br />
16 17<br />
from the scheme can be used to fund <strong>energy</strong> saving measures, including renewables.<br />
2.4.3 As a large <strong>energy</strong> user, KCC is among those organisations legally required to both<br />
monitor and <strong>report</strong> on emissions, and in this regard it co‐ordinates the emissions data from the<br />
District and Borough <strong>Council</strong>s in <strong>Kent</strong>. KCC is required to submit a ‘footprint <strong>report</strong>’ on 29th<br />
July 2011 for the first year of the scheme.<br />
2.4.4 There are immediate penalties of £5000 plus £500 per working day for a maximum of 40<br />
days for failing to submit (£25,000). Thereafter, the total rises to £45,000 and there are a<br />
number of significant financial and other penalties associated with accuracy of data recording<br />
and <strong>report</strong>ing 1819 . There are strict criteria for accuracy, and the costs of inaccuracy could be<br />
great. A good, accurate carbon footprint <strong>report</strong> is effectively worth £5 million to KCC over 5<br />
years. 20<br />
2.4.5 The select committee learned that implementation of the scheme has been costly and<br />
to ensure that the council ultimately benefits from it, sustained action and improvements will<br />
be needed in order to compete with the wide range of organisations, including for example<br />
supermarkets, who will be taking part. Aside from the costs of setting up the scheme, another<br />
detrimental effect will be its implications for cash flow, as the purchase of allowances takes<br />
place six months before any ‘recycling payment’ (based on position in the league table) is paid<br />
out.<br />
2.4.6 The majority of the emissions from the KCC estate (80%) result from schools<br />
operations, since schools represent 86% of the estate’s 700 buildings 21 and the Towards 2010<br />
target of a 10% reduction in emissions has not been achieved. To benefit from the CRC, and in<br />
order to ensure direct cost savings from reduced <strong>energy</strong> use, it is therefore vital that KCC steps<br />
up its <strong>energy</strong> efficiency work, and puts in place effective mechanisms to ensure that the<br />
schools estate can quickly reduce its emissions and benefit from lower <strong>energy</strong> costs.<br />
16 Jennie Donovan, Planning and Communications Manager (<strong>Kent</strong> and East Sussex), Environment Agency – written<br />
evidence<br />
17 It should be noted that CRC is one three emissions related schemes which together will account for over 90% of<br />
these organisations’ emissions; the others being the EU Emissions Trading Scheme (EY ETS) and Climate Change<br />
Agreements (CCAs).<br />
18 Full details can be found in Annex 7 to the Guidance.<br />
19 Certain activities are excluded from CRC, namely domestic accommodation, transport and fuel, and <strong>energy</strong><br />
purchased for supply to a third party (as undertaken by LASER, the <strong>energy</strong> buying division of KCC Commercial<br />
Services).<br />
20 Deborah Kapaj, Corporate Environmental Performance Co‐ordinator – supplementary evidence<br />
21<br />
<strong>Kent</strong> <strong>County</strong> <strong>Council</strong>, 2009 Towards a Low Carbon <strong>Kent</strong> ‐ making a world of difference to <strong>energy</strong> saving!<br />
18
2.5 <strong>Renewable</strong> Energy Strategy<br />
2.5.1 The UK <strong>Renewable</strong> Energy Strategy 22 was published on 1 st July 2009 and sets out the<br />
UK’s plans to reduce fossil fuel use by 10% and reduce by 20‐30% the level of gas imports which<br />
would have been needed by 2020. The aim of the Strategy is an almost six‐fold increase in the<br />
amount of electricity generated from renewables. In order to achieve 30% of UK electricity<br />
generation from renewables by 2020 an increase from 22TWh 23 per annum to 117TWh per<br />
annum is required, with the majority of this expected to be from on and offshore wind. 24<br />
2.5.2 The Strategy acknowledges that for this to be achieved, the involvement of all sectors<br />
from government to individuals will be needed. It outlines how the rapid development of the<br />
renewables industry will be facilitated by the introduction of various financial support<br />
mechanisms, targeting both supply and take up, and those to date will be covered in Section 5<br />
of this <strong>report</strong>.<br />
2.6 Microgeneration Strategy<br />
2.6.1 Underpinned by the Green Energy (Definition and Promotion) Act 2009, the government<br />
are (from July‐December this year) consulting on a new Microgeneration Strategy, and it is<br />
expected to be <strong>final</strong>ised early next year. The Strategy covers small‐scale electrical systems up to<br />
50kW and heat systems up to 300kW and has four themes: quality and consumer confidence,<br />
technology improvements, skills/employment and advice for businesses, homeowners and<br />
communities.<br />
2.6.2 The technologies covered by the Strategy are:<br />
Air, ground and water source heat pumps<br />
biomass boilers<br />
fuel cells<br />
micro Combined heat and power (micro CHP)<br />
micro hydro schemes<br />
micro wind turbines<br />
passive flue gas recovery devices.<br />
solar photovoltaics (PV)<br />
solar thermal water heating<br />
22 DECC, 2009 The UK The UK <strong>Renewable</strong> Energy Strategy, London<br />
23 TW = terawatt = one trillion watts<br />
24 Dr Wayne Cranstone, Head of Onshore Development and Projects, RNRL ‐ written evidence<br />
19
2.7 <strong>Renewable</strong> Energy Targets<br />
2.7.1 EU and National Targets<br />
The EU Target of 20% of <strong>energy</strong> from renewable sources is divided up between countries and<br />
the UK ‘share’ is 15%. Realistically this is likely to involve renewable generation of:<br />
30% electricity<br />
12% heat<br />
10% transport <strong>energy</strong><br />
It can be seen from Figure 1 below that steady progress has been made but currently we have<br />
achieved only 6.6% of our electricity, 1.6% of our heating (and cooling) and 2.5% of our<br />
transport <strong>energy</strong> from renewables. In terms of progress towards the 15% UK target, the<br />
proportion of total <strong>energy</strong> consumption from renewables is 3%.<br />
Figure 1: % of electricity, heat and transport from renewables<br />
7<br />
6<br />
5<br />
4<br />
3<br />
2<br />
1<br />
0<br />
2004 2005 2006 2007 2008 2009<br />
electricity 3.5 4.1 4.5 4.8 5.4 6.6<br />
heating 0.7 0.9 1 1.2 1.4 1.6<br />
transport 0.1 0.2 0.5 0.9 2 2.5<br />
2.7.2 Regional and Local Targets<br />
In July this year, the Secretary of State for Communities abolished regional spatial strategies<br />
and so the South East Plan, which included a regional target of 1130 MW of renewable<br />
electricity capacity by 2020; (154 MW in <strong>Kent</strong> by 2016) is no longer in effect and the national<br />
target of 15% <strong>energy</strong> from renewable sources prevails. The challenge is therefore to devise<br />
ways to help <strong>Kent</strong> play its part in achieving national targets. ‘Business as usual’ is expected to<br />
20
deliver only 5.4% renewable <strong>energy</strong> in the South East by 2020 25 and so it is clear that its<br />
successful deployment in the county and across the region is vital in order to contribute to the<br />
UK’s 2020 targets for 15% renewable <strong>energy</strong> and 80% emissions reduction..<br />
2.8 Regeneration Framework<br />
2.8.1 The efficient use of <strong>energy</strong> and resources is at the core of council strategies, particularly<br />
the Regeneration Framework: Unlocking <strong>Kent</strong>’s Potential, which had a cross‐cutting theme of<br />
‘Meeting the Climate Challenge’, taken forward in <strong>Kent</strong>’s Environment Strategy and subsequent<br />
Low Carbon Opportunities for Growth (which is considered further in Section 9).<br />
2.9 <strong>Kent</strong> Environment Strategy<br />
2.9.1 A new version of the 2007 Strategy was agreed by the <strong>Kent</strong> Partnership in June 2010.<br />
Five of the ten key priorities relate directly to <strong>energy</strong> reduction and efficiency or renewable<br />
<strong>energy</strong> generation; other priorities also relate to topics covered in this review.<br />
2.9.2 The cross cutting themes of this strategy are environmental management and green<br />
jobs and these, as well as the key priorities, are reflected in KCC’s Environment Policy and<br />
strongly embedded throughout KCC operations; monitored by the Sustainability and Climate<br />
Change Team, hosted by Environment, Highways and Waste Directorate (EHW), and providing<br />
co‐ordination both within and outside of the organisation. 26 The council achieved certification<br />
to the ISO 14001 environmental management standard in May 2009 across all areas of its<br />
operation and has been selected as a case study for its community leadership role, in this<br />
regard. KCC’s Policy Overview and Scrutiny Committees monitor progress within each<br />
Directorate on the sustainability work undertaken and receive annual <strong>report</strong>s on progress.<br />
2.9.3 A number of Environment, Highways and Waste Directorate’s service priorities for the<br />
coming year (and which will be referred to in later sections of this <strong>report</strong>), will impact on<br />
<strong>energy</strong> efficiency and carbon reduction, both within the <strong>Council</strong> and across <strong>Kent</strong>, including:<br />
emissions reduction work with the public and private sector<br />
development of an environmental behaviour change programme<br />
the start of a 25 year contract at Allington where 44% of <strong>Kent</strong>’s municipal waste is<br />
converted to <strong>energy</strong><br />
an area‐based retrofitting programme to increase home <strong>energy</strong> and water efficiency<br />
25 Richards, K., 2010 SEPB Conference Presentation<br />
26 <strong>Kent</strong> <strong>County</strong> <strong>Council</strong>, 2010 Environment Highways and Waste: The year Ahead. Internal Report<br />
21
THIS PAGE IS INTENTIONALLY BLANK<br />
22
3 HOW MUCH ENERGY DO WE USE?<br />
3.1 UK Energy Consumption<br />
3.1.1 Energy consumption is influenced by mean temperatures and economic factors and<br />
with few exceptions the higher the Gross Domestic Profit (GDP) of a country, the higher the<br />
consumption. The UK is fairly typical of European countries at around 125kWh per person per<br />
day.<br />
3.1.2 Since 1970 there has been a steady increase in primary <strong>energy</strong> consumption in the UK,<br />
which by 2001 had risen 13%, peaking at 236.3 million tonnes of Oil Equivalent (MtOE) in that<br />
year 27 .<br />
3.1.3 Over the following eight years, to 2009, this figure has fallen to 211.2 MtOE. Data for<br />
the first quarter of 2010 indicates that the downward trend continues. (The unit of oil<br />
equivalence used in the national data allows comparison of technologies and <strong>energy</strong> sources<br />
whose output is usually measured in a variety of ways.)<br />
3.2 <strong>Kent</strong> Energy Consumption<br />
3.2.1 As shown by the map on the next page (Figure 2), compared with the rest of the UK,<br />
<strong>energy</strong> consumption in <strong>Kent</strong> (with the exception of Medway) is towards the lower end of the<br />
spectrum, with <strong>energy</strong> use per person per year at under 30,000kWh which equates to an<br />
average of 82kWh per day. 28<br />
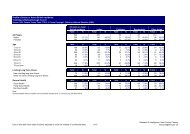
3.2.2 In 2007, <strong>Kent</strong>’s total <strong>energy</strong> consumption of all fuel types was 44,167.8 GWh and this<br />
was fairly evenly split between the sectors as shown in Table 1 below. There were variations<br />
between districts, partially due to the level of industry present, though Members of the Select<br />
Committee believe that some of the disparities between districts may not be reflected in later<br />
data when they become available.<br />
Table 1: <strong>Kent</strong> Energy Consumption in 2007 (GWh) Source DECC: December 2009<br />
Industry &<br />
Commercial Domestic Transport Total<br />
<strong>Kent</strong> (inc. Medway) 14,391.70 14,537.70 15,238.30 44,167.80<br />
27 DECC 2010 Energy Consumption in the UK. Table 1.1<br />
28 2006 data, published in 2009.<br />
23
Figure 2: Average total <strong>energy</strong> consumption per capita in 2006 (kWh) Source: DECC 29<br />
29 http://www.decc.gov.uk/assets/decc/statistics/regional/file41497.pdf<br />
24
3.3 <strong>Kent</strong> <strong>County</strong> <strong>Council</strong> Energy Consumption<br />
3.3.1 KCC in its operations consumed 355,811,827 kWh of electricity, gas and oil in 2008/9<br />
(costing £23,797,107) and the breakdown of this by fuel type is shown in Figure 3 below. Of all<br />
the oil used by KCC, 92% is consumed by primary and secondary schools, (96% if non‐school<br />
education buildings are included).<br />
Figure 3: KCC <strong>energy</strong> consumption by fuel type 2008/9<br />
Oil<br />
15%<br />
Electricity<br />
41%<br />
Gas<br />
44%<br />
3.3.2 When all fuel types are included, by far the largest proportion of <strong>energy</strong> consumption, a<br />
total of 59% is accounted for by primary and secondary schools and as stated previously 80% of<br />
the estate’s emissions come from education operations as shown in Figure 4 below.<br />
Figure 4: KCC <strong>energy</strong> consumption 2008/9 30<br />
Education Non‐Schools<br />
3%<br />
Residential Home / Day<br />
centre<br />
4%<br />
Offices<br />
5%<br />
Library and Community<br />
Buildings Depots<br />
3% 2%<br />
Metered Tunnels<br />
1%<br />
Secondary Schools<br />
33%<br />
Streetlighting<br />
(unmetered)<br />
16%<br />
Primary Schools<br />
33%<br />
30 Data provided by Andy Morgan, Head of Energy Management<br />
25
3.3.4 The next largest usage is from unmetered street lighting which is based on estimated<br />
use. However, from April this year the Select Committee has learned that estimates will be<br />
more accurate since they will take account of reductions in the wattage of bulbs or <strong>energy</strong><br />
savings made by switching off lights at different times.<br />
3.3.5 All the other buildings: offices, social care establishments, non‐school education<br />
buildings, library and community buildings, depots and metered tunnels together only account<br />
for 16% of <strong>energy</strong> costs, though these can be significant e.g. office <strong>energy</strong> costs while<br />
representing only 5%, were still just under £1.2 million so, for example, changes in behaviour<br />
can result in significant savings.<br />
3.4 Reducing <strong>energy</strong> consumption in <strong>Kent</strong><br />
National Indicator NI 186: Per capita reduction in CO 2 emissions in the local authority area<br />
3.4.1 This Indicator is included in the <strong>Kent</strong> Agreement 2 (LA2) requiring an 11.2% reduction in<br />
per capita emissions for the county by 2011 from a 2005 baseline. Between 2005 and 2007<br />
emissions reduced by 7.2% in <strong>Kent</strong> but a backlog in data means that more up to date figures are<br />
unavailable at present 31 . KCC contributions towards this reduction have included: 32<br />
Offering Free home <strong>energy</strong> surveys to over 100,000 <strong>Kent</strong> residents with take‐up from<br />
almost 9,000 households.<br />
Reducing congestion by using technology to improve traffic flows – a traffic<br />
management system has resulted in an 18% reduction in peak time journeys into<br />
Maidstone and this is being extended to Canterbury and Gravesend.<br />
Implementing the <strong>Kent</strong> Freedom Pass for children and young people (with 22,000<br />
passes issued) which has reduced congestion particularly around school journey times.<br />
Promoting sustainable travel choices including <strong>Kent</strong> Car Share, saving 3 million car<br />
journeys in 2009, equal to 1,000 metric tonnes of CO 2 and Walk to School initiatives<br />
saving 114,000 school‐run journeys<br />
Work with local businesses to help them implement travel plans<br />
3.4.2 A future project to address the <strong>energy</strong> efficiency of <strong>Kent</strong> homes is outlined on page 74.<br />
31 Jennifer Hunt, Maidstone Borough <strong>Council</strong> – Hearing 1 st June 2010<br />
32 <strong>Kent</strong> <strong>County</strong> <strong>Council</strong>, 2009 Towards 2010 Progress Report<br />
26
3.5 Reducing <strong>energy</strong> use by the KCC estate<br />
National and <strong>Kent</strong> Indicator NI 185: Percentage CO 2 reduction from local authority operations<br />
3.5.1 NI185 measures percentage CO 2 reduction from local authority operations and relates<br />
to both buildings and transport. A number of methods successfully being used to address this<br />
are highlighted below:<br />
Cut in business miles<br />
A reduction in business miles of 3.5% in 2009/10 resulted in savings of £277,000 which<br />
equates to a substantial reduction in petrol and diesel consumption. Staff are also are<br />
encouraged to avoid meeting‐related travel by using BT Meetme teleconference facilities<br />
and this is estimated to have avoided an additional £40,000‐worth of business miles.<br />
Increased use of this facility could result in further substantial savings. It is important to<br />
maintain a focus on this aspect since business miles and commuting are responsible for 38%<br />
of all CO 2 emissions at national level. 33<br />
Traffic light replacement<br />
Traffic lights were replaced with LEDs resulting in a 70% saving (reducing carbon emissions<br />
by 27 tonnes at a cost of £1000 per tonne of carbon).<br />
Investment in environmental projects<br />
Supplemented by a one off payment of £240,000 interest free funding available from the<br />
government through Salix Finance, KCC has invested £1 million in a range of <strong>energy</strong><br />
efficiency projects and 25 renewable <strong>energy</strong> projects, (mainly solar powered systems and<br />
biomass boilers), the latter saving 7,000 tonnes CO 2 and reducing fuel costs. 53 <strong>energy</strong><br />
efficiency projects together saved 1,103 tonnes of CO 2 emissions and cut costs by £187,387<br />
per annum including a £125,000 road tunnel lighting project in Ramsgate where inefficient<br />
lighting was changed to a low <strong>energy</strong> alternative. Other measures included: boiler controls<br />
and education in how to use them; Building Energy Management Systems (BEMS); cavity<br />
wall and loft insulation; draught proofing; lighting upgrades and automatic lighting controls;<br />
valve wraps and heating pipe work insulation; voltage reduction equipment 34 and zoning<br />
controls for heating. 35<br />
33 Robin Haycock, Arup – Hearing 1 st June 2010 (uncorrected evidence)<br />
34 KCC has implemented voltage optimisation at Sessions House in Maidstone where it has had the effect of<br />
reducing <strong>energy</strong> use by 7%. An explanation of voltage optimisation is given on page 72<br />
35 <strong>Kent</strong> <strong>County</strong> <strong>Council</strong>, 2009 Towards a Low Carbon <strong>Kent</strong> – Making a world of difference to <strong>energy</strong> saving!<br />
27
Introduction of mixed recycling<br />
The introduction of mixed recycling to all KCC buildings has proved to be an easier system<br />
to operate than the previous system where different types of recycling were separated. It<br />
requires fewer collections by contractors, which reduces both the cost and the associated<br />
carbon footprint.<br />
Use of technology and innovation to influence behaviour<br />
As an example, at new KCC premises at Thistley Hill, multi‐purpose printer/fax/scanner/<br />
photocopiers require a code to be inserted before printing can be collected; this reduces<br />
waste and avoids unnecessary <strong>energy</strong> costs.<br />
Encouragement of <strong>energy</strong> efficient behaviour<br />
KCC has over 300 Green Guardians who champion environmental awareness and <strong>energy</strong><br />
efficiency. A survey of 2,800 computers in 13 offices found that 73% staff switched off their<br />
computers after work and part of Green Guardians’ role is to promote good practice by<br />
conducting regular office surveys, providing either a Fair Trade sweet and a thank you note<br />
or a reminder to staff. After a period of campaigning by the Green Guardians, the<br />
proportion of computers switched off rose to 95%. It has been calculated that 100%<br />
compliance would save £46,000 <strong>energy</strong> costs from the surveyed computers alone, and so<br />
the impact is considerable. Staff who take on the role are rewarded by acknowledgement in<br />
the appraisal process.<br />
3.5.2 Behavioural changes will be easier to effect if every individual member of staff and<br />
every county councillor is encouraged to give efficient <strong>energy</strong> use a high priority. During its<br />
evidence gathering the Select Committee learned that each KCC building has a ‘Building User<br />
Group’ which meets regularly; but that <strong>energy</strong> usage and <strong>energy</strong> efficiency is not on the<br />
agenda. In addition to corporate <strong>energy</strong> saving programmes, the Select Committee feel that<br />
having <strong>energy</strong> use and efficiency as a regular agenda item at every such meeting would be an<br />
effective way to ensure that local expertise e.g. detailed knowledge of buildings, heating and<br />
lighting systems, as well as staff habits with regard to <strong>energy</strong> use, is put to good use and that<br />
initiatives and successes at individual building level can be shared throughout the organisation.<br />
RECOMMENDATION 8<br />
That KCC substantially drives down <strong>energy</strong> consumption in its estate. Each Directorate<br />
should be required to take action to improve <strong>energy</strong> efficiency and encourage behavioural<br />
and other changes; Building User Groups should have ‘<strong>energy</strong> usage and <strong>energy</strong> efficiency’<br />
as an agenda item at every meeting.<br />
28
3.6 Direction of Travel<br />
3.6.1 All new domestic buildings are required to be zero carbon from 2016; public<br />
buildings from 2018 and while Building Regulations revisions will continue to raise<br />
sustainability standards, this will only be achievable with both building integrated<br />
and community scale renewables.<br />
3.7 KCC Sustainable Construction Policy 36<br />
3.7.1 Through its capital building programme KCC seeks to reduce negative environmental<br />
impacts including CO 2 and other greenhouse gas emissions. The Sustainable Construction Policy<br />
statement builds upon the Environment Policy commitments on <strong>energy</strong>, to meet high<br />
standards of sustainable construction in all new KCC buildings and refurbishments, and in all<br />
developments on KCC‐owned land, with BREEAM ‘very good’/Code for Sustainable Buildings<br />
Level 3 or equivalent required as a minimum; and requires all new KCC buildings and<br />
refurbishments to assess the feasibility of developing on‐site renewable <strong>energy</strong> to help meet<br />
<strong>energy</strong> needs.<br />
3.7.2 The Policy takes a lifecycle approach to costing buildings, taking into account ‘future<br />
<strong>energy</strong> prices and the cost of retrofitting <strong>energy</strong> efficiency and adaptation measures to inform<br />
upfront investment’ and reduce running costs. Its commitments on <strong>energy</strong> efficiency aim to<br />
reduce the embodied as well as in‐use <strong>energy</strong> of a building and are summarised here:<br />
Maximise opportunities for natural heating and cooling<br />
Minimise heat loss and gain through use of thermally efficient materials<br />
Use natural or low‐<strong>energy</strong> ventilation (including heat pumps where possible)<br />
Comply with or exceed building regulations for air testing and use high standards of<br />
glazing and draught proofing<br />
Comply with or exceed building regulations for carbon emissions<br />
Choose <strong>energy</strong> efficient: heating and hot water systems; lighting, cooling and<br />
ventilation; electrical equipment and appliances<br />
Employ, support and research new <strong>energy</strong> efficient technologies<br />
Investigate opportunities to retrofit <strong>energy</strong> efficiency measures into existing<br />
buildings using KCC’s Energy and Water Investment Fund<br />
3.7.3 The policy statement outlines KCC’s commitments on material selection, construction,<br />
consultants and contractors. It has a specific commitment to renewable <strong>energy</strong> saying that: ‘We<br />
36 Supplementary to the <strong>Kent</strong> Design Guide: https://shareweb.kent.gov.uk/Documents/business/propertygroup/sustainable‐construction‐policy‐2009.pdf<br />
29
will thoroughly assess the feasibility of developing on‐site renewable <strong>energy</strong>. This will be done<br />
by considering planning considerations, capital cost, required associated infrastructure,<br />
embodied <strong>energy</strong> of materials, ongoing management/maintenance requirements (frequency,<br />
skill required and component replacement costs), running costs, estimated payback period and<br />
predicted <strong>energy</strong>/carbon emission savings. Investigations will also be made as to whether grant<br />
funding can be obtained’.<br />
3.8 Policies that have resulted in increased <strong>energy</strong> use<br />
3.8.1 The Select Committee learned that despite the great strides made through the<br />
incorporation of <strong>energy</strong> efficiency schemes and a small number of renewable <strong>energy</strong> projects,<br />
the reduction in <strong>energy</strong> use achieved over two previous years has not been repeated and there<br />
has been a 10% increase in emissions from the KCC estate over the past year. The measures<br />
outlined above will have had a positive effect but other factors have militated against the<br />
otherwise downward trend.<br />
3.8.2 Evidence provided to the Select Committee indicates that significant factors that have<br />
played a part in this are the Extended Schools programme, under which schools offer a range of<br />
extended services to pupils and the community outside of normal school hours, thus increasing<br />
<strong>energy</strong> use, and policies towards increasing the use of Information and Communication<br />
Technology (ICT) in school media suites. Aspects of flexible working and extended library hours<br />
have played a part, as has an increase in the number of Children’s Centres.<br />
3.8.3 A number of other KCC policies and strategies are likely to impact on <strong>energy</strong> use and<br />
though the net effects will not be known for some time, it is essential that any negative impacts<br />
are minimised and that opportunities are taken to minimise <strong>energy</strong> use wherever possible.<br />
3.9 Better Workplaces<br />
3.9.1 Over the next 6 years the Better Workplaces Programme (BWP) will see the closure of<br />
buildings and a resulting reduction in the floor plate of the office estate, as the portfolio of<br />
offices is rationalised to take account of business needs and service delivery. This will take place<br />
gradually as leases for particular buildings end and while the <strong>energy</strong> profile at retained sites is<br />
likely to increase as staff are relocated; overall there will be significant financial and <strong>energy</strong><br />
savings. Thistley Hill, as mentioned previously in relation to the use of <strong>energy</strong> efficiency<br />
technology, is the first of the BWP to be fully functional. Here, for example, there are more<br />
staff than desks, and 60% of staff share office space at different times. 37<br />
37 Edward Trimmer, <strong>Kent</strong> Facilities Business Manager – supplementary evidence<br />
30
3.10 Street Lighting Policy<br />
3.10.1 A new policy and strategy relates to the work of <strong>Kent</strong> Highway Services (KHS) who as<br />
highway authority undertake the provision and maintenance of street lights, lit signs and lit<br />
bollards. The Policy commits to a reduction in <strong>energy</strong> use and CO 2 emissions by the installation<br />
of less <strong>energy</strong> intense lighting and to de‐illumination, part night lighting, light dimming or<br />
removal of certain units where they are deemed, after full consultation and consideration of<br />
public benefit and crime prevention priorities, to be unnecessary.<br />
3.11 What needs to be done to further reduce <strong>energy</strong> use in the KCC estate?<br />
3.11.1 A typical hierarchy for sustainable <strong>energy</strong> use is shown in Figure 5 below.<br />
Figure 5: Energy hierarchy<br />
Conserve <strong>energy</strong> – change behaviour to reduce demand<br />
Install <strong>energy</strong> efficiency measures to<br />
reduce <strong>energy</strong> wasted<br />
.<br />
Exploit sustainable,<br />
renewable <strong>energy</strong><br />
sources<br />
Exploit fossil fuels with waste<br />
and emissions reduction<br />
technology such as Combined<br />
Heat and Power or Carbon<br />
Capture and Storage<br />
3.11.2 When finances are constrained, only a proportion of possible measures can be put in<br />
place, since, for example, implementing a renewable <strong>energy</strong> scheme will usually (but not<br />
always) be more expensive per tonne of carbon reduction than requiring behaviour change, or<br />
installing <strong>energy</strong> efficiency measures. Continuing with a hierarchical approach is therefore likely<br />
to lead to ‘business as usual’. However, evidence to the Select Committee indicates that a ‘step<br />
change’ is required in order to make the necessary <strong>energy</strong> and cost savings and furthermore,<br />
targets for carbon reduction will not be achievable by <strong>energy</strong> efficiency measures alone.<br />
Therefore it is necessary to look holistically at what needs to be achieved, and the best way to<br />
achieve it.<br />
3.11.3 This type of approach is now made possible by the introduction of the Feed‐in Tariff and<br />
the forthcoming <strong>Renewable</strong> Heat Incentive (see Section 5) which make the business case for<br />
installing renewable technologies ‘stack up’. However, to achieve this low‐carbon transition,<br />
any investment in renewable <strong>energy</strong>, must be accompanied by a review of, and commitment<br />
31
to, behaviour change to reduce <strong>energy</strong> consumption and a continuous programme of <strong>energy</strong><br />
efficiency work, probably allied to ongoing maintenance.<br />
3.11.4 The Select Committee learned that just such an approach had been adopted by a <strong>Kent</strong><br />
school and a case study outlining what has been achieved, over a very brief period of time, at<br />
St Peter’s Church of England Primary School, is shown on the following page.<br />
32
St Peter’s – Better than Zero Carbon School!<br />
St Peter's Church of England (VC) School, Aylesford is a traditional<br />
Victorian building from 1836; not an establishment that you would<br />
expect to be setting out to become the first carbon‐negative<br />
school in Europe in a venture involving all 130 school children,<br />
their parents, teachers and governors, the local community and<br />
international companies who can see the benefits from using such<br />
an unlikely organisation as a show room!<br />
The catalyst for the venture was a House Challenge to come up<br />
with a design for Coronation Gardens (pictured above), a walled<br />
green space that had fallen into disuse and is now leased from the<br />
Parish <strong>Council</strong>. The School’s desire to be self‐sufficient, the arrival<br />
of PTS <strong>Renewable</strong>s (a local company dedicated to the supply of<br />
<strong>energy</strong> efficiency and renewable <strong>energy</strong> technologies) to Aylesford<br />
and a lot of hard work led to some incredible results, not least a<br />
reduction in annual <strong>energy</strong> costs from £10,000 to £4,500 in a little<br />
over a year. The school’s 4 R’s have underpinned their <strong>energy</strong>‐busting plans:<br />
‘Reduce’ ☺Walls and ceilings were insulated with Actis Super<br />
10 and wood wool (chosen by the children, who<br />
tested the insulation properties of several products)<br />
☺Lighting sensors were installed<br />
☺Doors and windows are being replaced<br />
☺‘Power Rangers’ save <strong>energy</strong> by closing doors and<br />
turning off equipment<br />
☺Heating systems were replaced with low <strong>energy</strong> technology, beginning with<br />
Worcester Bosch air source heat pumps (the picture above shows the nursery<br />
unit) to provide both heating and cooling as well as freeing up space in<br />
classrooms.<br />
‘Reuse’ ☺There is good equipment husbandry, and everything<br />
possible is reused<br />
‘Recycle’ ☺Eco‐warriors make sure everything is sorted and recycled<br />
‘<strong>Renewable</strong>’ ☺The children came up with some ambitious ideas for their<br />
green park with solar panels and a wind turbine as well as a<br />
slide for access! The next step is to get funding for solar<br />
photoelectric and thermal panels.<br />
Headteacher, Simon Temple, wants other schools to benefit from the lessons learned:<br />
reduce heat loss (insulation, windows, doors, power rangers)<br />
reduce <strong>energy</strong> consumption (power rangers, alternative heating)<br />
monitor <strong>energy</strong> usage to evaluate the impact of measures<br />
generate <strong>energy</strong> with solar thermal and photovoltaic technology<br />
reduce costs further by installing grey water recovery and rain‐water capture<br />
33
3.12 Sustainable Schools<br />
3.12.1 Until the recent change of government on 11 th May, the DCSF Sustainable Schools<br />
programme provided the framework for schools’ activities on sustainability, including <strong>energy</strong><br />
efficiency, and guidance for schools on carbon management was published in March 2010 38 .<br />
Government policy in this regard is likely to change under the new Department for Education.<br />
3.12.2 KCC’s document, Supporting <strong>Kent</strong> Schools to become Sustainable Schools 39 sets out the<br />
help available to schools to make them sustainable by 2020. It highlights ways in which this can<br />
be approached, including through the achievement of Healthy Schools status, the<br />
implementation of travel plans and through Eco Schools awards. In line with the government<br />
framework, the guidance provides eight voluntary ‘pathways’ for sustainability including<br />
‘Energy and Water’, and outlines the advice and support available through KCC’s Energy<br />
Management Team.<br />
3.12.3 Energy and Water will be a compulsory theme for Eco Schools from September 2010<br />
and progression through awards will be linked to data from Display Energy Certificates (for<br />
larger schools). The Select Committee believe this is a step in the right direction as currently<br />
DEC data shows no correlation between green flag status (the highest Eco Schools award) and<br />
<strong>energy</strong> efficiency of school buildings. However, the scheme itself is voluntary and schools can, if<br />
they wish, choose to do nothing.<br />
3.12.4 Every Child Matters (ECM) is the central agenda under which schools are measured and<br />
as noted previously, ECM aims to increase the level of technology available to children and<br />
young people (raising the ratio of computers to 1:1) and to provide wrap around and extended<br />
services. ‘The school that never sleeps’ will mean increased <strong>energy</strong> usage in schools and so it<br />
will be important for government to acknowledge these potentially competing aims of <strong>energy</strong><br />
and education policy, and seek to reconcile them.<br />
RECOMMENDATION 11<br />
That KCC lobbies the Department for Education to require schools to work with KCC to fulfil<br />
its CRC commitments and creates a direct incentive for schools to drive down their <strong>energy</strong><br />
use and carbon emissions, using a range of behavioural, <strong>energy</strong> efficiency and renewable<br />
<strong>energy</strong> options..<br />
38 DCSF, 2010 Climate Change: A Carbon Management Strategy for the Schools Sector<br />
39 <strong>Kent</strong> <strong>County</strong> <strong>Council</strong> (undated) Supporting <strong>Kent</strong> Schools to become Sustainable Schools<br />
34
3.13 LASER<br />
3.13.1 LASER Energy Buying Group is part of Commercial Services; the trading arm of KCC<br />
which, enabled by legislation, provides goods and services to publicly funded bodies across the<br />
South East of England, helping those bodies to reduce their costs and generating income for<br />
KCC equivalent to a reduction in <strong>Council</strong> Tax of 1.2%. 40<br />
3.13.2 LASER has an active role in the <strong>energy</strong> market and carries out <strong>energy</strong> contract<br />
management, <strong>energy</strong> procurement and <strong>energy</strong> management services. A small Energy<br />
Management Team (6 officers) provides the latter for public sector clients including around 80<br />
councils in London and the South East, <strong>Kent</strong> Police, <strong>Kent</strong> & Medway Fire and Rescue and most<br />
of the KCC estate including schools (except those built under the Private Finance Initiative).<br />
Schools that choose to buy <strong>energy</strong> through LASER benefit both from economies of scale, and<br />
from the expertise and advice the team is able to provide.<br />
3.13.3 Members of the Energy Management Team undertook assessment training to become<br />
fully‐accredited to Building Research Establishment (BRE) standards to facilitate the work<br />
required to ensure all schools over 1000m 2 were assessed and had Display Energy Certificates<br />
and Advisory Reports when these became a requirement. Equipping the team for this role<br />
saved £70,000 compared with the cost of appointing external assessors, demonstrating the<br />
cost‐effectiveness of developing expertise within the organisation. In addition to DEC work, the<br />
Energy Management Team administers the Energy and Water Investment Fund, as well as<br />
managing the CRC Energy Efficiency Scheme.<br />
3.14 LASER electricity contracts<br />
3.14.1 The Select Committee learned from Andy Morgan, Head of Energy Management that<br />
LASER has so far chosen not to purchase renewable electricity. In 2008 for example, suppliers<br />
were required to source 9.1% of electricity from renewable sources yet only 5.5% was actually<br />
being generated – demand therefore outstripped supply. Suppliers were obliged to pay a<br />
buyout sum to be recycled back to those in the scheme based on their renewable <strong>energy</strong><br />
portfolio. However, at that time this meant that the customer, (and as noted earlier LASER are<br />
large <strong>energy</strong> customers who seek to keep costs down for KCC and their other clients in the<br />
public sector) ‘could pay a premium to their electricity supplier for renewable electricity which<br />
the supplier is already obliged by Government to source’.<br />
3.14.2 The CRC Energy Efficiency Scheme treats all electricity from the Grid in the same way<br />
(with CO 2 /kWh based on the mix of generation across the board), again with no incentive to<br />
40 <strong>Kent</strong> <strong>County</strong> <strong>Council</strong>, 2010 Medium Term Plan 2010‐2013<br />
35
purchase renewably sourced supplies. So, LASER do not consider that paying a premium for it is<br />
a worthwhile option. 41 This situation could however change, when the current contract comes<br />
to an end. Currently, a very few <strong>energy</strong> clients specify they want to source renewable electricity<br />
and the most cost effective option has been to source electricity from (fossil fuelled) Combined<br />
Heat and Power (CHP) plants, which due to their efficient generation are exempt from Climate<br />
Change Levy for High Rate VAT clients so there is no net increase in the price per kWh<br />
purchased.<br />
3.15 Local authority sale of renewable electricity<br />
3.15.1 Since 1989, legislation has prevented local authorities from selling electricity they<br />
generate themselves (other than that associated with heat i.e. CHP) 42 , however, the Climate<br />
Change Secretary announced his intention to remedy this situation and on 18 th August 2010 the<br />
Sale of Electricity by Local Authorities (England and Wales) Regulations 2010 came into force.<br />
3.15.2 This means that should KCC invest in microgeneration technologies such as (but not<br />
restricted to) photovoltaic (PV) panels they may sell that electricity to the Grid resulting in a<br />
long term reduction in fuel bills and carbon emissions and also deriving an income stream. This<br />
may be via the Feed‐in Tariff or <strong>Renewable</strong>s Obligation, though the <strong>final</strong> details are not yet<br />
available. This provides a huge financial incentive for local councils, enabling them to make<br />
sound business cases for investment in renewable <strong>energy</strong>.<br />
41 Andy Morgan, Head of Energy Management – written evidence<br />
42 The Local Government (Miscellaneous Provisions) Act 1976 as amended by the Energy Act 1989.<br />
36
4 RENEWABLE ENERGY GENERATION<br />
4.1 <strong>Renewable</strong> generation in the UK<br />
4.1.1 There has been a steady increase in the amount of renewable <strong>energy</strong> generation from<br />
different sources and Figure 6 below shows figures for the period from 2007 to 2009. Biodegradable<br />
waste is included in the biomass figure, and non‐biodegradable waste is given<br />
separately. Data for 2010/11 will show a marked increase in offshore wind production as Phase<br />
2 wind farms currently being built come on‐stream, including two off the <strong>Kent</strong> coast at Thanet<br />
Offshore (now operational) and the London Array.<br />
Figure 6: UK Total Generation from renewables and wastes 2007‐2009 43<br />
(units are thousands of tonnes of oil equivalent (KtOE)<br />
8000<br />
7000<br />
6000<br />
5000<br />
4000<br />
3000<br />
2000<br />
1000<br />
0<br />
Solar<br />
heating and<br />
PV<br />
Onshore<br />
and<br />
offshore<br />
Hydro<br />
Biomass<br />
Geothermal<br />
aquifers<br />
Transport<br />
fuels<br />
Non‐biodegradable<br />
wastes<br />
All<br />
renewables<br />
and waste<br />
2007 46.1 453.5 437.5 3,871.00 0.8 361.7 435.6 5606.2<br />
2008 57.2 610.3 444.4 4,068.50 0.8 820.7 464.1 6466<br />
2009 71.2 800 452.4 4,541.80 0.8 1,008.60 509 7383.8<br />
4.2 <strong>Renewable</strong> Generation in the South East and <strong>Kent</strong><br />
4.2.1 Richard Hurford, Head of the Energy Saving Trust in the South East, informed the Select<br />
Committee that information from the Low Carbon Buildings Programme which provided grants<br />
for renewables between 2006 and 2010 shows that the South East is ahead of the rest of the<br />
country with 3,458 domestic installations during that period; most having under 1,000.<br />
43 Data source: DECC Energy Trends Special Report – <strong>Renewable</strong> Energy in 2009<br />
37
4.2.2 The Low Carbon Buildings Programme (LCBP) data shows that of the 3,458 installations<br />
in the South East, after Hampshire, <strong>Kent</strong> had the second highest number ‐ 577 (17%) as shown<br />
in Table 2 below.<br />
Figure 2: SE <strong>Renewable</strong> Energy Installations funded by LCBP (April 2006 – January 2010) 44<br />
Buckinghamshire 250<br />
Berkshire 223<br />
Oxfordshire 379<br />
Hampshire (inc IOW) 610<br />
<strong>Kent</strong> 577<br />
Surrey 436<br />
East Sussex 518<br />
West Sussex 465<br />
4.2.3 However, when the number of installations is considered as a proportion of the<br />
households in each county, it can be seen from Figure 7 below that <strong>Kent</strong> ranks fifth among the<br />
South East Counties with only Berkshire and Surrey having a lower proportion and East Sussex<br />
having over twice as many installations as <strong>Kent</strong> relative to household numbers.<br />
Figure 7: LCBP installations as a % of household number<br />
0.30<br />
0.24<br />
0.20<br />
%<br />
0.10<br />
0.13<br />
0.07<br />
0.15<br />
0.12<br />
0.10 0.10<br />
0.14<br />
0.00<br />
Buckinghamshire Berkshire Oxfordshire Hampshire (inc<br />
IOW)<br />
<strong>Kent</strong> Surrey East Sussex West Sussex<br />
4.2.4 Across the whole of the South East, the types of technology that people chose were<br />
predominantly solar‐powered systems, with solar PV and solar thermal hot water systems<br />
accounting for 88% of the total as shown in Figure 8 on the next page.<br />
44 Data Source: Energy Saving Trust – Hearing 19 th May 2010<br />
38
Figure 8: SE <strong>Renewable</strong> installations by technology type (April 2006‐January 2010)<br />
2000<br />
1812<br />
1600<br />
1200<br />
1240<br />
800<br />
400<br />
0<br />
129<br />
ASHP<br />
5<br />
Biomass<br />
heating<br />
(stove)<br />
144<br />
GSHP Solar PV Solar<br />
Thermal<br />
62 66<br />
Wind<br />
turbine<br />
Wood<br />
fuelled<br />
boiler<br />
system<br />
4.2.5 In addition, LCBP data shows that there were a number of installations at Community,<br />
Medium and Large scale and the grant amounts allocated for these in the South East were<br />
£260,157, £832,389 and £152,189 respectively 45 .<br />
4.2.6 The Select Committee was informed that, when all types of renewable <strong>energy</strong> are taken<br />
into account, the current installed capacity in <strong>Kent</strong> is approximately 201MW of electricity and<br />
1.18MW heat which equates to around 1.1% of the county’s total <strong>energy</strong> consumption, 46 both<br />
of which will contribute to the 15% renewable <strong>energy</strong> target for the UK by 2020.<br />
4.3 <strong>Renewable</strong> Energy Capacity in <strong>Kent</strong><br />
4.3.1 Land Use Consultants and TV Energy on behalf of the South East England Partnership<br />
Board 47 undertook a piece of work, to assess the potential for renewable and decentralised<br />
<strong>energy</strong> in the South East. The results of their high level assessment, which indicates a<br />
theoretical level of capacity based on a number of criteria, and before filters such as technical<br />
issues and planning constraints are applied, have now been made available. The data have<br />
been disaggregated to <strong>County</strong> level for all the included technology types and to local authority<br />
level where possible. 48 Table 3 on the next page shows the assessed capacity for the<br />
technology types in <strong>Kent</strong> (including Medway) and the estimated carbon savings from<br />
implementation at that level by 2020. There are high, medium and low scenarios assumed for<br />
45 http:\\www.lowcarbonbuildings.org.uk<br />
46 Neil Hilkene, Sustainability Manager – supplementary evidence<br />
47 The regional planning body which has now been abolished by the government.<br />
48 The full work is available online at: http://www.se‐partnershipboard.org.uk/page/5/view/175/sub/77/<strong>energy</strong><br />
39
<strong>energy</strong> crop data but only the medium scenario is listed here. The high level study and<br />
associated mapping can now be used as the basis for further, more detailed work.<br />
Table 3: <strong>Kent</strong> Resource Potential identified by the regional study 49<br />
Technology Resource Potential MW installed GWh<br />
Kilotonnes CO 2<br />
saved<br />
Commercial scale wind <strong>energy</strong> (nondesignated<br />
3352 5285 2082<br />
areas – 2.5 MW turbines)<br />
Small scale wind <strong>energy</strong> (nondesignated<br />
275 385 152<br />
areas – 6kW turbines)<br />
Small scale wind <strong>energy</strong> (designated 65.6 91.95 36.22<br />
areas)<br />
Biomass – managed woodland (used to 8.6/169.7 64.8/297.3 25.5/71.9<br />
generate electricity/heat)<br />
Biomass – <strong>energy</strong> crops (medium 9.35/121.57 70.12/212.98 27.62/51.54<br />
scenario,<br />
non‐designated,<br />
electricity/heat)<br />
Biomass – <strong>energy</strong> crops (medium 4.30/55.87 32.22/97.88 12.69/23.69<br />
scenario, designated, electricity/heat)<br />
Biomass – waste wood – 6.4/96.2 47.9/168.6 89.9/194.6<br />
electricity/heat<br />
Biomass – agricultural arisings 129.60 3170.70 1248.90<br />
Biomass – poultry litter 0.28 1.40 0.60<br />
Biogas – wet organic waste 567.70 2934.00 1155.60<br />
Biomass – co‐firing 480.40 3427.40 1350.00<br />
Municipal Solid Waste 499.00 1923.00 3688.00<br />
Commercial and Industrial waste 1203.00 4637.00 1826.00<br />
Biogas – landfill gas 12.00 55.20 21.80<br />
Biogas – sewage gas 11.20 42.00 16.60<br />
Hydropower – small scale (nondesignated<br />
areas)<br />
Hydropower ‐ small scale (designated<br />
areas)<br />
1.11 5.76 2.27<br />
0.36 1.87 0.74<br />
Solar Photovoltaic (PV) 509.41 401.62 158.20<br />
Solar Thermal 439.71 192.59 46.61<br />
Heat Pumps 2746.00 6254.00 755.00<br />
49 Land Use Consultants and TV Energy (2010) Review of <strong>Renewable</strong> and Decentralised Energy Potential in South<br />
East England<br />
40
4.4 <strong>Renewable</strong> Generation on the KCC Estate<br />
4.4.1 As noted previously, to date only 25 renewable <strong>energy</strong> projects have been put in place<br />
on the KCC estate including 4 biomass boilers and 12 solar PV and solar thermal systems 50 .<br />
4.5 School <strong>Renewable</strong>s Project<br />
4.5.1 KCC commissioned work in 2007 to find out which of <strong>Kent</strong>’s schools were suited to<br />
various types of renewable <strong>energy</strong>. The technologies considered were:<br />
Biomass (wood fuel) heating<br />
Combined Heat and Power (CHP)<br />
Ground source heating<br />
Solar photovoltaic (PV) panels<br />
Solar water heating panels<br />
Wind turbine (building mounted)<br />
Wind turbine (stand alone)<br />
4.5.2 At that time 45 schools were selected for further assessment and a good potential for<br />
solar PV, solar water heating and wind power was identified. Some schools were found to be<br />
suited to a number of technologies but heat pumps were considered only where new building<br />
was planned because of difficulties with retrofitting. Just under half the schools also had good<br />
potential for wood fuel heating. It was calculated at the time that converting all those schools<br />
to wood fuel heating would save 1,800 tonnes of carbon per annum and create a demand for<br />
1,400 tonnes of wood fuel which could be locally sourced.<br />
4.5.3 It was recommended that two or three projects were pursued initially and work was<br />
taken forward at Valley Park Community School, Maidstone and St Augustine’s Catholic Primary<br />
School, Tunbridge Wells. A <strong>report</strong> outlining progress was written in February 2010, 51 concluding<br />
that biomass heating was more expensive to implement than <strong>energy</strong> efficiency measures but<br />
provided a much deeper cut in CO 2 emissions (90%) and schools had benefited from fuel cost<br />
savings. It stated that the economic case for the technology being employed more widely on<br />
the KCC estate would be improved by the introduction of the <strong>Renewable</strong> Heat Incentive; if<br />
50 Carolyn McKenzie, Sustainability and Climate Change Manager – Supplementary evidence<br />
51 Morgan, A., 2010 Wood Fuel Heating in <strong>Kent</strong> Schools. Internal Report<br />
41
installed in buildings with higher, more constant heat load or in new builds, particularly Building<br />
Schools for the Future (BSF) schools where very low carbon emissions are stipulated or if wood<br />
chip prices are stable while oil/gas prices rise significantly<br />
4.5.4 The Select Committee were informed that a major barrier that mitigated against<br />
implementing <strong>energy</strong> saving and renewable <strong>energy</strong> measures in schools was that while KCC<br />
met the capital cost, any revenue benefits would fall to the school. Possible solutions to this<br />
barrier are discussed in Section 5.<br />
4.6 <strong>Renewable</strong> technologies<br />
4.6.1 The following pages provide a brief overview of main technologies, with reference to<br />
evidence received in relation to <strong>Kent</strong>. For the majority of the technologies, issues in <strong>Kent</strong> are<br />
similar to those elsewhere. However, regarding onshore development, a large proportion of<br />
the county has protected status as an Area of Outstanding Natural Beauty which offers<br />
particular challenges, highlighted in Section 7 on planning. The fact that <strong>Kent</strong> has a large<br />
proportion of formerly coppiced woodland, means that there is very good potential to develop<br />
renewable wood fuel production in the county, which would also meet a number of other<br />
objectives including rural regeneration and employment as well as providing the opportunity<br />
for KCC’s own Country Parks to contribute to renewable <strong>energy</strong> aims while enhancing their<br />
access and amenity value.<br />
4.7 <strong>Renewable</strong> Electricity<br />
4.7.1 Issues regarding the variability (usually termed intermittency) of renewable electricity<br />
are discussed in Section 8 page 86. The following technologies are covered.<br />
Solar PV<br />
Wind<br />
Hydro power<br />
o Wind<br />
o Wave<br />
o Small scale hydro electricity<br />
Energy from Waste<br />
o Biological processing<br />
o Thermal processing<br />
42
Solar Photovoltaics<br />
Photovoltaic (PV) cells generate electricity using solar (or<br />
reflected) <strong>energy</strong>. No fuel other than the sun’s <strong>energy</strong> is<br />
needed and output is measured in terms of kilowatt peak<br />
(kWp) which is the rated capacity of the unit in ideal<br />
conditions. Cells (panels) are made of layers of a<br />
semiconductor across which electric fields are created when<br />
sunlight ‘excites’ the electrons in the material creating an<br />
electric current. Silicon is the most commonly used<br />
semiconductor, however research is identifying other<br />
materials and systems which may supersede this. PV roof<br />
tiles and flexible PV materials, for example, are already<br />
available. Panels can be grouped together to form an array,<br />
according to the output required.<br />
The map above shows that <strong>Kent</strong> benefits from average insolation of between 1100 and 1200<br />
kWh per square meter (at a 30 degree incline; 30‐45 degrees is recommended); and so is in the<br />
zone best suited to take advantage of solar <strong>energy</strong> apart from the very tip of Cornwall.<br />
Tilted surfaces such as roofs are ideal surfaces on which to<br />
mount panels, as this increases the amount of sunlight<br />
available and free‐standing tilted arrays are possible with a<br />
4kW section (the limit for a single connection to the grid that<br />
can benefit from payments from the Feed‐in Tariff) taking up<br />
about 30m 2 .<br />
Advantages: Low maintenance (simple cleaning only required), easy to retrofit, permitted<br />
development rights (since 2008); works all year round but with higher output in summer;<br />
reduced fuel bills; suitable for domestic to industrial/utility scale installations.<br />
Disadvantages: A suitably sized south facing roof or external surface/support is required.<br />
Planning may currently be refused in protected areas though as noted in section 7, solar PV is<br />
one of the technologies that is ‘given the green light’ in a <strong>report</strong> compiled for the <strong>Kent</strong> Downs<br />
AONB. 52<br />
Stats: A 2.5kWp domestic installation would meet around 50% household needs, save 1.2<br />
tonnes of CO 2 per year and give a £250 per year reduction in electricity bills in addition to<br />
payments from the Feed‐in Tariff. 53 . The Solar Trade Association indicates that costs range from<br />
£4,000‐£8,000 per kWp, therefore a typical domestic system would cost from £10,000 to<br />
£20,000 but the return on investment has been calculated to be 8‐10%.<br />
52 <strong>Kent</strong> Downs AONB (2009)<br />
53 Source: Department of Energy and Climate Change (DECC)<br />
43
Wind Power<br />
Modern wind turbines harvest wind power to generate electricity and range from domestic<br />
scale micro size to massive turbines the largest of which are rated at around 6‐7MW. The Select<br />
Committee would not recommend micro‐scale turbines due to their low efficiency.<br />
Large turbines are most effective and a Norwegian company is planning a 10MW turbine, 533<br />
feet high. The technical challenges of offshore wind make it twice as expensive but the wind<br />
resource is better than onshore. A summary of the offshore wind development around the <strong>Kent</strong><br />
coast is included in Section 9.<br />
The UK has an excellent wind resource with average wind speeds of 8‐9 m/s (in the south) and<br />
a load factor (generating capacity minus downtime) for a well‐sited turbine of 30% compared<br />
to Germany’s 19%. Currently there is 4.5GW of installed capacity on/offshore. Onshore,<br />
3,490.74MW is operational, 881.75 is under construction and 4,064.13MW has planning<br />
approval but is not yet constructed. A further 7,625.19MW (47% of the total) is in planning. 54<br />
Rural areas have more than four times the capacity of urban areas when<br />
considering the potential for siting wind turbines. 55 However, evidence to<br />
the review indicates that small to medium scale onshore turbines could be<br />
better placed close to industrial sites. The urban environment is not<br />
generally suitable for the traditional horizontal‐axis wind turbine (HAWT –<br />
shown below) which tracks to follow wind direction, because of<br />
obstructions and turbulence from buildings, but vertical axis turbines<br />
(VAWT) or wind spires which are quiet and experience less vibration, such<br />
as the Quiet Revolution, shown to the right, could provide a useful alternative.<br />
Examples in <strong>Kent</strong><br />
<strong>Kent</strong> has several examples of individual turbines including<br />
the HAWT pictured, at Wealden Forest Park in Herne. An<br />
onshore wind farm at Little Cheyne Court Farm, New<br />
Romney has been operational since November 2008. It has<br />
26 turbines each 115m tall (to blade tip) of 2.3 MW, with<br />
total capacity of 59.8MW, linked to the Grid by 13km of<br />
underground cabling.<br />
There is likely to be continued growth of onshore wind in <strong>Kent</strong> at the single turbine/small<br />
cluster community scale 56 . Currently, a further wind farm has been approved at Sheerness, Isle<br />
of Sheppey, for 4 wind turbines each of 2.5MW, total capacity 10MW and sites at <strong>Kent</strong><br />
Thameside, Isle of Sheppey and Isle of Grain are under consideration. The review also learned<br />
of a proposal for a turbine with shared community ownership at East Farleigh, near Maidstone<br />
and this is outlined on the next page.<br />
54 Paul Reynolds, Offshore Wind Development Manager, <strong>Renewable</strong>UK – Hearing 26th May 2010<br />
55 William White, SE Regional Director, National Farmer’s Union – Hearing 12 th May 2010<br />
56 Neil Hilkene, Sustainability Manager – supplementary evidence<br />
44
Case Study: Community Turbine Proposal<br />
Residents in East Farleigh, near Maidstone were recently invited to their<br />
local Church Hall to find out about and give their views on a proposed<br />
community co‐ownership initiative. The proposal, for a single turbine to<br />
generate electricity at a nearby fruit farm, is the first of its kind in <strong>Kent</strong><br />
(there being only one other in the UK, in Cambridge) and would allow<br />
local people to own a share of the resource (as is common practice in<br />
Denmark) through the setting up of an investment vehicle such as a cooperative<br />
or community interest company which would earn local<br />
investors a favourable rate of return (around 12%). The community<br />
would also benefit directly from a percentage of revenue paid to the<br />
Parish <strong>Council</strong> each year (around £5000) and the scheme’s landlord<br />
would benefit from a share as shown below<br />
Local<br />
Turbine<br />
Company,<br />
26%<br />
Landlord,<br />
25%<br />
The scheme is for one Acsa 27 mid sized<br />
turbine located in a farm setting. Proposers,<br />
Distgen, will shortly be seeking planning<br />
permission for the turbine, having first<br />
consulted with 11 statutory consultees and<br />
members of the local community.<br />
Community<br />
investors,<br />
49%<br />
so that low levels of noise at various<br />
distances from it, would largely be<br />
absorbed by the ambient noise and<br />
virtually undetectable at 300m. The<br />
picture to the right shows how the turbine<br />
would look from the Castle Farm entrance.<br />
Residents were keen to learn about the<br />
scheme and the concerns they had were<br />
mainly about the level of noise that might be<br />
experienced from the turbine’s operation.<br />
They were provided with detailed technical<br />
and environmental data as well as information<br />
about the careful positioning of the turbine,<br />
Key points:<br />
500,000kWh (estimated annual generation – enough to power about 100 homes)<br />
Ideal location with 7m/s average windspeed<br />
Could connect directly to the local High Voltage Grid<br />
A scale of development favoured by Planning Policy Statement (PPS) 22<br />
Could contribute to the national 15% target for renewables<br />
Could contribute to government aims for distributed generation, <strong>energy</strong> security and<br />
carbon emissions reduction<br />
Project website: www.distgen.com/projects/castle‐farm<br />
45
Hydro Power<br />
Wave & Tidal Power – Though output is more predictable than with wind and solar power, only<br />
2GW is expected to be developed in the UK by 2020. Potentially wave and tidal power could<br />
supply 15‐20% of UK electricity by 2050 with tidal barrages and lagoons providing another 5%.<br />
A new Marine Planning System is being developed and a draft Marine Policy Statement is at<br />
the consultation stage until 13 th October 2010.<br />
Currently, Europe’s only tidal power station is in the Rance estuary in northern France<br />
(240MW) where electricity is generated by the high‐volume tidal flow passing through turbines<br />
within a barrage.<br />
In the UK, the focus is on Scotland and the West Coast and of potential sites at the Dee,<br />
Humber, Severn and Solway, the Severn Barrage has come closest to fruition.<br />
An example of the exciting developments in the field of wave <strong>energy</strong> is the Anaconda, a giant<br />
snake‐like tube made of rubber which has been developed by Checkmate Sea<strong>energy</strong> with<br />
funding from the Carbon Trust. A 200m long device is planned for 2014, with a turbine at the<br />
‘tail end’, each ‘snake’ capable of generating 1MW electricity. 57<br />
In the South East, a SEEDA study identified areas around the Isle of Wight and Dover as having<br />
potential for 1000‐1900 MWh per annum but constrained by environmental factors, the<br />
location of sub‐sea cables, pipelines or archaeological sites, and shipping. 58 The risk of<br />
environmental damage, as well as the cost and size of schemes have militated against large<br />
scale take up in the UK so far and the Select Committee believe that these factors are likely to<br />
restrict the potential for schemes around the <strong>Kent</strong> coast.<br />
Small Scale Hydro‐electric power ‐ Hydro‐electric schemes need a constant water source over<br />
which a weir is built. A pipeline takes water from the weir via an intake to a covered turbine<br />
and water is fed back to the watercourse via a ‘tailrace’.<br />
In England, most sites with potential for 1MW or over have been developed and currently<br />
hydropower produces 1.2% of UK electricity consumption. The Environment Agency (EA) will<br />
approve schemes provided there are no increased flood risks or impacts on migrating fish and<br />
1200 schemes are expected across the UK by 2020. There may be potential for further ‘run of<br />
river’ or ‘low head’ micro‐hydro sites and EA mapping of the South East has revealed 5832 sites<br />
which could generate 79MW electricity (enough for 55,000 homes).<br />
The EA have so far permitted two sites in <strong>Kent</strong> and five more on the River Medway are being<br />
considered. In principle the Select Committee favour small scale hydro schemes but there is<br />
limited scope for them in the county.<br />
(The Feed‐in Tariff would incentivise a medium scale scheme (electricity for 32,000 homes) by<br />
about £25,000 per year which represents 16‐25% of set up costs).<br />
57 The Carbon Trust, 2009 Innovations Case Study CS153<br />
58 Paul Reynolds, Offshore Wind Development Manager, <strong>Renewable</strong>UK – Hearing 26th May 2010<br />
46
Energy from Waste – biological processing<br />
Waste is increasingly being recognised as a resource and the Waste Strategy for England<br />
expects that 25% of municipal waste will be used to generate <strong>energy</strong> by 2020; a figure already<br />
exceeded in <strong>Kent</strong>. 59 Apart from the three thermal techniques available, anaerobic digestion<br />
(AD), a biological process involving the breakdown of organic waste by microbes in the absence<br />
of oxygen, can be used to produce biogas or methane (CH 4 ).<br />
AD is suited to homogenous food and agricultural waste and<br />
is the best treatment method, in <strong>energy</strong> and carbon<br />
reduction terms, provided materials are collected<br />
separately 60 . The end product of dried sewage sludge can<br />
also be used as a fertilizer.<br />
‘The NFU has a vision for 1,000 on‐farm AD plants by 2020<br />
and we firmly believe AD can add value to the agricultural<br />
sector, while demonstrating how farmers can provide part of<br />
the solution to the problem of climate change.’ 61<br />
Biogas can be purified and injected into the gas grid; burned<br />
onsite to generate electricity; purified and bottled as a<br />
vehicle fuel or piped a short distance and used as a<br />
combustible fuel. 62 The UK potential is considerable with<br />
over 100 million tonnes (mt) per year of organic waste comprising 12‐20mt food waste (50%<br />
municipal); 90mt agricultural waste and 1.73mt sewage sludge. 63<br />
The Environment Agency is in favour of AD provided the recovered value outweighs impacts<br />
such as bad smells and increased transport. However, incentives for farm‐scale projects are felt<br />
to be too low to make them viable. Larger, more expensive schemes, taking in waste food from<br />
councils or businesses could benefit from charging gate fees.<br />
KCC is the household waste authority for <strong>Kent</strong>, responsible for disposal of the waste (with the<br />
exception of green waste in some cases) collected by the twelve <strong>Kent</strong> boroughs and districts.<br />
The council is contracted to supply municipal waste to the WRG Allington thermal waste‐to<strong>energy</strong><br />
plant for the next 25 years. Nevertheless, there is potential for non‐council organic<br />
waste from the restaurant/food and agricultural industries to be processed by anaerobic<br />
digestion in <strong>Kent</strong>.<br />
59 Jennie Donovan, Planning and Communications Manager (<strong>Kent</strong> and East Sussex), Environment Agency – written<br />
evidence<br />
60 DEFRA Waste Strategy Factsheet: Energy from Waste and Anaerobic Digestion<br />
61 National Farmers’ Union, Media Release 2 February 2010 – supplementary evidence<br />
62 Dr Howard Lee, Lecturer and Sustainability Champion, Hadlow College – written evidence<br />
63 Defra (2010) Accelerating the Uptake of Anaerobic Digestion in England: an Implementation Plan<br />
47
Energy from Waste ‐ thermal processing<br />
‘EfW can have a role both in bridging the gap left as old coal and nuclear plant are closed, and<br />
also in contributing to our renewable <strong>energy</strong> targets….’ 64<br />
‘A shift in perception is required. Waste needs to be recognised as a resource.’ 65<br />
The three main thermal techniques available for the generation of <strong>energy</strong> from waste are<br />
combustion, pyrolysis and gasification. 66 The process of generating <strong>energy</strong> from waste is<br />
distinct from the incineration of waste to reduce its volume.<br />
Combustion – An Energy from Waste plant operated by<br />
<strong>Kent</strong> Enviropower at Allington Quarry is one of two<br />
operated by Waste Recycling Group in the UK. The plant<br />
uses fluidised bed technology whereby hot air is blown up<br />
through a layer of sand which swirls around, like a fluid.<br />
Shredded waste is fed in from the top and the abrasiveness<br />
of the sand plus the high temperature causes the waste to<br />
vapourise. With the least noxious end products, this combustion method is preferable from the<br />
air quality point of view. An alternative method uses moving‐grate technology.<br />
The Allington plant processes 500,000 tonnes of waste per annum, and has a 34MW electricity<br />
generating capacity, offsetting 77,000 tonnes of CO 2 per annum.<br />
KCC is contracted to supply a minimum quantity of MSW to the facility, equating to around 44%<br />
of the <strong>Kent</strong> total. Given a long term 50% recycling target, and declining waste arisings, KCC has<br />
already reached an optimum level of <strong>energy</strong> generation from MSW (the biodegradable fraction<br />
of which is considered to be a renewable <strong>energy</strong> source). 67<br />
Pyrolysis ‐ Pyrolysis uses temperatures of over 500 °C to decompose biomass in the absence of<br />
oxygen. Feedstocks such as poultry litter, manure, straw, wood and green wastes can be used<br />
and the end products are syngas, pyrolysis oil and charcoal. Research is being sponsored by the<br />
Carbon Trust to see whether pyrolysis oil can be upgraded to transport fuel. The process is also<br />
being investigated by New Earth Solutions, who operate Blaise Farm In‐Vessel composting<br />
facility in <strong>Kent</strong>, to see whether there are opportunities to reduce the carbon impact of waste<br />
processing by exploring ways to generate renewable fuel for use on site 68 .<br />
64 Paul Andrews, Managing Director, <strong>Kent</strong> Enviropower – written evidence<br />
65 Karl Jansa, Business Development Manager, Locate in <strong>Kent</strong> – written evidence<br />
66 Gasification is referred to on page 52 in relation to CHP.<br />
67 Sue Barton, Strategic Projects & Business Development Manager – Hearing 21 st April 2010<br />
68 Rob Asquith ‐ Director of Land & Planning, New Earth Solutions (Blaise Farm) – written evidence<br />
48
4.8 <strong>Renewable</strong> Heat<br />
4.8.1 Heating accounts for 46% of UK <strong>energy</strong> consumption with the majority of buildings’ heat<br />
and hot water requirements provided by gas boilers; while industry uses proportionately more<br />
electricity and oil. So far, only around 1% of heat is generated from renewable sources<br />
compared to the UK target of 12% by 2020 but the take up of these technologies and others<br />
such as biogas and biomethane production and combined heat and power (CHP) will be<br />
stimulated by the <strong>Renewable</strong> Heat Incentive (introduced by The Energy Act 2008) which is due<br />
to come into effect on 1 st April 2011.<br />
4.8.2 A cost comparison of some renewable technologies with their fossil fuel alternatives is<br />
given in Table 4 below. 69<br />
Table 4: Cost comparisons of renewable with fossil fuel heating<br />
Technology<br />
Heat Cost in<br />
pence per<br />
kWh th<br />
Fuel Emissions<br />
in kgCO 2 /<br />
kWh th<br />
Electric heater 19‐24 0.61<br />
Oil boiler 8.1‐14 0.32<br />
Gas boiler 6.7‐16 0.23<br />
<strong>Renewable</strong> Technology<br />
Ground source heat pump 10‐32 0.14‐0.17<br />
Air source heat pump 10‐39 0.20‐0.22<br />
Biomass District Heating 11‐22 0.036<br />
Biomass boiler 11‐24 0.031<br />
Solar Thermal 50‐74 n/a<br />
4.8.3 Highlighted on the following pages are heat pumps, solar thermal and combined<br />
technology (PV‐T), district heating using fossil/renewable fuels and <strong>final</strong>ly biomass.<br />
69 Parliamentary Office of Science and Technology, 2010 Postnote: <strong>Renewable</strong> Heating<br />
49
Ground Source Heat Pumps<br />
Heat pump systems work by taking low grade heat from the environment, raising the<br />
temperature by compression and moving the heat to where it is needed (or using it to power<br />
cooling). Ground Source Heat Pumps (GSHPs) use heat stored in the ground at a stable<br />
temperature of about 9‐14 degrees. Electricity is used to operate the compressor and pump<br />
but efficiency is good with a Coefficient of Performance (CoP) of 3 or 4 (for every unit of<br />
electricity ‘invested’, 3‐4 units of heat are obtained). CoPs of 4‐5 are often quoted but the<br />
Environmental Agency cautioned the Select Committee to note that the seasonal average is a<br />
better measure, and efficiency is dependant on the range between the source temperature and<br />
that of the heating system. GSHPs are usually used for low temperature heat distribution<br />
systems like underfloor heating which transfer the heat effectively over a large area.<br />
The technology has three main parts, a ground loop (vertical, horizontal, or spiral); an electric<br />
pump, and a distribution system. Of the two types of GSHP system: ‘closed loop’ and ‘open<br />
loop’ the latter usually needs greater assessment, planning and regulation including an<br />
abstraction licence and discharge consent. 70 They are most suited to new developments where<br />
underfloor heating can be specified and bore holes or trenches incorporated into site works.<br />
The market is expected to grow significantly following the introduction of the <strong>Renewable</strong> Heat<br />
Incentive in April 2011 after which an annual installation rate of 40,000 systems is expected.<br />
Environment agency data shows that in <strong>Kent</strong> there are 3 open loop systems currently installed<br />
in three different sectors (industrial, domestic and power generation industry) and<br />
approximately 38 closed loop systems. A typical 6‐8kW system costs £7,300‐£11,800. 71<br />
There is excellent potential for further GSHP systems in <strong>Kent</strong>. Though the technology is not<br />
easily retrofitted, at KCC’s Oakwood House an alternative <strong>energy</strong> source was required for a<br />
bedroom extension, as grid limits for electricity had already<br />
been reached. The solution was to install a ground source<br />
heat pump which will supply 60% of the annual heating<br />
load (coupled with solar panels producing 15% of the<br />
<strong>energy</strong> required for hot water) for the 40 bedrooms. 72 A<br />
deep well system was chosen for the loop, shown in the<br />
diagram to the left, and its output is 30KW.<br />
Air/Water source heat pumps<br />
These work on the same principle as GSHPs but drawing the<br />
heat either from the ambient air, or a nearby water source<br />
of sufficient capacity. Air source heat pumps, though less <strong>energy</strong> efficient than GSHPs, can be<br />
easily retrofitted, with a small unit on the inside of a building and one on the outside, as shown<br />
in the example at St Peter’s Church of England Primary School, Aylesford on page 31.<br />
70 Unless hazardous materials are used in the closed loop system<br />
71 Dr Howard Lee, Lecturer and Sustainability Champion, Hadlow College – written evidence<br />
72 Peter Binnie, Head of Operations, Property Group – Hearing 14 th April 2010<br />
50
Solar Thermal– hot water<br />
The UK has around 2% of the European solar market, similar to countries like Belgium and<br />
Switzerland, while Denmark has 44%. 73<br />
To date, solar thermal, is the most popular renewable technology in the UK, used to provide<br />
hot water. Panels are commonly roof mounted, glazed, flat plates with a closed system of pipes<br />
containing water which is heated by the sun. There are alternative designs, including evacuated<br />
tube, and systems can be either direct, where water circulates through the system to the taps,<br />
or indirect, where there is an interface between the heated tubes and the hot water system via<br />
a heat transfer fluid.<br />
Solar thermal panels are a proven technology which is easy to retrofit or integrate at relatively<br />
low cost (cheaper still for new build). The evacuated tube design takes up less roof space and<br />
performs better in colder ambient air temperatures but costs more and is less sturdy than flat<br />
plate systems; it can also be used for central heating but with technical challenges. 74 A typical<br />
domestic installation would cost around £4,000 and provide 50‐70% of domestic hot water<br />
needs.<br />
Solar Photovoltaic Thermal (PV‐T)<br />
This hybrid technology has been introduced to the UK by a <strong>Kent</strong> company, the Carbon Free<br />
Group, who provided evidence to the Select Committee. It combines the two types of solar<br />
<strong>energy</strong> capture systems and exploits the fact that PV works best at cooler temperatures. It can<br />
therefore supply electricity, hot water and central heating, requiring less space than if the two<br />
systems were applied individually. It is felt to be an ideal choice for individual houses. 75<br />
The technology is relatively new to the market; early versions of combined systems proved<br />
unsuccessful and of lower efficiency than the individual systems, 76 however the latest PV‐T<br />
systems offer greater efficiency and cost savings in situations where both electricity generation<br />
and hot water are required as the cost per kWp electricity plus 4.5 kWp hot water is currently<br />
£7,000. 77 At the time of writing, it was not clear to the Select Committee how this hybrid<br />
technology might benefit from the two separate government incentive schemes aimed at<br />
renewable electricity (Feed‐in Tariff) and heat (<strong>Renewable</strong> Heat Incentive).<br />
73 Howard Johns and Chris Rowlands, Directors, OVESCO – Hearing 26 th May 2010<br />
74 Tom Vosper, Head of Biomass Team, Creative Environmental Networks – written evidence<br />
75 James Sweet, Commercial Director, C4Ci – written evidence<br />
76 <strong>Renewable</strong> Energy Systems – visit 16 th March 2010<br />
77 Jae Mather, Director of Sustainability, Carbon Free Group – Supplementary evidence<br />
51
District Heating and CHP<br />
Combined Heat and Power (CHP) is an efficient method for converting fossil or renewable fuel<br />
into electricity and heat by utilising heat that would otherwise be wasted. Losses in<br />
transmission are outweighed by greatly reduced emissions, even if fossil fuels are used. CHP<br />
can provide domestic to utility scale heating and in Denmark, for example, it provides 50% of<br />
the country’s electricity. Highly efficient plants in Copenhagen use a variety of fuels including<br />
waste straw. Other forms of biomass such as wood can be used and the gasification process<br />
produces emissions that comply with Clean Air requirements.<br />
Battersea Power Station had the first decentralised CHP district heating system, supplying hot<br />
water and heating to 11,000 homes in Pimlico. 78 Few systems exist in the UK today but<br />
Southampton has a CHP system fuelled by geothermal heat from a deep well and by gas. Heat<br />
from the plant is circulated via an 11km main to customers in the City centre.<br />
Gas powered CHP is also used in Woking and its town centre plant, situated in a multi storey<br />
car park, supplies the central business district on a private wire network. The system is over<br />
three times more efficient than centrally supplied <strong>energy</strong>.<br />
A utility scale gas CHP plant at Kingsnorth, Isle of Grain will come online in 2011, producing<br />
1275MW electricity, enough for 1 million homes. The heat will be used by National Grid to<br />
convert liquid natural gas, to gaseous form for the gas grid.<br />
The Allington EfW plant is not fitted with CHP technology but WRG’s smaller plant in<br />
Nottingham, in addition to generating electricity, produces 375GW high pressure steam<br />
annually which is used to provide heating for shopping centres, the National Ice Arena, Capital<br />
One HQ, Nottingham Trent University, the Guildhall and 5,000 residential customers. WRG are<br />
willing to explore the feasibility of developing of district heating infrastructure at Allington,<br />
which could raise the plant’s thermal efficiency from 25% to 75%. 79<br />
In April, a 150kW CHP plant began operations at Port of Dover, fuelled partly by waste cooking<br />
oil collected by <strong>Kent</strong> residents. Provided there are adequate supplies of homogenous waste,<br />
anaerobic digestion can also be used to provide continuous electricity and district heating.<br />
In order that district heating is economical and efficient, CHP plants should be located in areas<br />
with a balanced heat load, so they do not suit developments solely of housing. However,<br />
developers are happy to opt for CHP as it is cost neutral and reduces emissions. In Woking, they<br />
are guided towards it by the requirement for a particular carbon profile. 80<br />
The Select Committee believes that large scale developments planned in <strong>Kent</strong> offer significant<br />
opportunities for district heating and furthermore, the Select Committee was told that a<br />
medium scale biomass CHP scheme, located correctly, could showcase it as a viable technology<br />
in <strong>Kent</strong> 81 .<br />
78 Institute of Civil Engineers (ICE), 2009 Why Waste Heat?<br />
79 Paul Andrews, Managing Director, <strong>Kent</strong> Enviropower – written evidence<br />
80 Mr John Thorp, Director, Thamesway Energy – Hearing 14 th April 2010<br />
81 Tom Vosper, Head of Biomass Team, Creative Environmental Networks – written evidence<br />
52
Biomass<br />
<strong>Renewable</strong> biomass is defined as ‘the biodegradable fraction of products, waste and residues<br />
from agriculture (including vegetal and animal substances), forestry and related industries, as<br />
well as the biodegradable fraction of industrial and municipal waste.’ Biomass is regarded as<br />
being less ‘deep green’ than other renewable sources but the CO 2 released when plant biomass<br />
is burnt is balanced out by the CO 2 absorbed during the life of the plant, resulting in a near<br />
neutral carbon profile for heat and power generation. As well as providing fuel for heating,<br />
biomass can provide power and be used as a transport fuel. The Select Committee primarily<br />
considered biomass wood fuel though the potential in <strong>Kent</strong> for other types of biomass is listed<br />
on page 40 and considered further in Section 10.<br />
Wood Fuel<br />
Wood burning stoves produce space<br />
heating for buildings and can also provide<br />
domestic hot water/heating by means of a<br />
heat exchanger.<br />
Biomass Boilers burn solid biomass fuels to<br />
heat water or produce steam for space<br />
heating. They are large pieces of plant and<br />
require additional storage space for fuel,<br />
with easy access for deliveries.<br />
The technologies have different efficiencies, for example an open fire is 10‐20% efficient; a<br />
wood‐burning stove 30‐65% and a biomass boiler is around 80‐95% efficient.<br />
Forestry, tree surgery, sawmill and recycled timber can be used as woodfuel in the form of logs,<br />
chips or pellets.<br />
Logs are most often used in domestic scale stoves and this method of heating is becoming<br />
increasing popular in the UK; the Select Committee were told that last year members of the<br />
Stove Industry Alliance sold 186,000 wood burning stoves in 2009 alone. 82<br />
Chips have a lower <strong>energy</strong> density than pellets and are less free‐flowing, but they are<br />
cheaper to produce per unit of heat delivered (dependent on moisture content), requiring<br />
only a chipping machine. They are therefore suitable for onsite or local production and<br />
consumption.<br />
Pellets are as yet uncommon in the UK, however the select committee learned that Creative<br />
Environmental Networks, with the benefit of a Bio<strong>energy</strong> Infrastructure Grant have opened<br />
a pelleting plant in <strong>Kent</strong> which will help to meet the needs of domestic customers, (since<br />
pellets are more compact, and require less storage space than chips) thus avoiding the need<br />
to import pellets.<br />
82 Nigel Jennings, Environmental Planning Adviser, Natural England – written evidence<br />
53
4.9 <strong>Kent</strong> woodfuel industry<br />
‘Biomass should be produced sustainably in order that negative environmental impacts,<br />
such as on soils, groundwater, air quality, forests and water resources, are reduced as far<br />
as possible.’ 83<br />
4.9.1 The Forestry Commission informed the Select Committee that <strong>Kent</strong> is the second most<br />
wooded county in England, after Hampshire, with 10.6% woodland cover (40,000 hectares), a<br />
quarter of which is or has in the past been managed as coppice. Those woodlands currently<br />
under management are shown in Figure 9 below.<br />
Figure 9: Managed woodlands in <strong>Kent</strong> Source: Forestry Commission<br />
4.9.2 The shaded areas shown above could potentially be more actively managed to produce<br />
wood fuel, along with part of the Forestry Commission’s own holdings of sweet chestnut<br />
coppice. The KCC estate also includes some woodland.<br />
4.9.3 The Forestry Commission’s UK Strategy target is to produce two million cubic metres of<br />
wood fuel per annum by 2020. Half of <strong>Kent</strong>’s sustainable yield of broadleaved, conifer and<br />
coppice woodland would give 90,000 cubic metres of wood fuel per annum (4.5% of the<br />
national target) which equates to around 90MW of heating capacity, and maximum benefit<br />
would be from local use of the fuel.<br />
83 Jennie Donovan, Planning and Communications Manager (<strong>Kent</strong> and East Sussex), Environment Agency – written<br />
evidence<br />
54
4.9.4 The select committee benefitted from a <strong>report</strong> by KCC Member Mr David Brazier who<br />
undertook a brief study tour to Austria, where the wood fuel industry is highly developed and is<br />
viewed as a critical element in maintaining secure fuel supplies for the country. The<br />
communities and markets served in Austria are different to those in <strong>Kent</strong> but certain factors<br />
were felt to be common to the success of both, namely: area‐wide co‐ordination and the<br />
development of a local supply chain.<br />
4.9.5 The existence of an international market for biomass means that in order to establish a<br />
competitive and sustainable wood fuel industry locally, the matching of supply with demand,<br />
efficient distribution and the availability of support is necessary to keep costs down and<br />
maximise benefits.<br />
4.9.6 Market development would be of considerable social, environmental and economic<br />
benefit to <strong>Kent</strong>, firstly since industrial demand has declined due to the closure of local paper<br />
mills, resulting in there being fewer local, forestry‐related jobs. 84 Smaller scale, producers can<br />
also find logistical difficulties, regulatory requirements and other costs to be a real barrier to<br />
success. Secondly, evidence from Natural England indicates that an increase in coppicing could<br />
help to improve biodiversity since coppice woods are ideal for a large number of species who<br />
depend on the cutting cycle every 10‐15 years to maintain their habitat. Thirdly, market<br />
development would ensure that <strong>Kent</strong> can benefit from the increased opportunities on both the<br />
supply and demand side, afforded by the introduction of the <strong>Renewable</strong> Heat Incentive which<br />
will greatly extend the range of organisations to whom biomass boilers, for example, become<br />
financially attractive.<br />
4.9.7 The Select Committee would therefore like to see the positive promotion of biomass<br />
(wood fuel) heating systems in <strong>Kent</strong>, which would create a demand for a locally produced<br />
product and could stimulate a significant increase in the level of coppice management<br />
undertaken in the county. Coppice management is also complimentary to the purposes of the<br />
<strong>Kent</strong> Downs Area of Outstanding Natural Beauty and has great potential for social,<br />
environmental, economic as well as recreational benefits.<br />
4.9.8 Aside from wishing to support the production and use of local wood fuel, the Select<br />
Committee also believe there is an opportunity for <strong>Kent</strong>, due to its coastal location, to play a<br />
part both in the international trading of wood fuels and potentially, the hosting of renewable<br />
<strong>energy</strong> production from biomass plants based on waste woods. A proposed CHP scheme at<br />
Ridham Dock would utilise waste woods to generate 25MW electricity and 35MW heat.<br />
84 Tom Vosper, Head of Biomass Team, Creative Environmental Networks – written evidence<br />
55
4.9.9 A small number of schemes are being put in place to explore the potential benefits of<br />
bringing woodland back into management, as well as the practicalities of developing a local<br />
wood fuel market. For example, a scheme being explored by Natural England in partnership<br />
with the Forestry Commission in the South Downs area has the potential for:<br />
Accreditation and co‐ordinated support of local firewood producers<br />
A ‘South Downs Brand’ linking product to landscape to stimulate positive, financially<br />
sustainable, woodland management<br />
A High quality local firewood supply for south Downs and neighbouring communities<br />
Targeted positive management of Biodiversity Action Plan (BAP) priority habitats<br />
Greater public understanding of woodland management<br />
and in <strong>Kent</strong>, an initiative at Blean near Canterbury is considering how small scale heating<br />
solutions can help reinvigorate local coppicing. The Select Committee would like to see a<br />
number of such schemes across the county and feel that there is scope for KCC to lend support<br />
in a number of ways.<br />
RECOMMENDATION 18<br />
That KCC should work with organisations such as the Forestry Commission and Natural<br />
England, to invest in the sustainable production of wood fuel, through the regeneration of<br />
coppicing in <strong>Kent</strong>, by:<br />
Providing marketing expertise.<br />
Encouraging apprenticeships for young people wishing to enter the industry.<br />
Investigating the provision of a number of collection/ chipping/distribution facilities,<br />
possibly based at recycling centres<br />
Ensuring that, where possible, newly designed KCC buildings include biomass boilers.<br />
4.9.10 As noted, mature coppice is an ideal fuel for small‐scale local supply, however the fact<br />
that some areas of woodland are remote and inaccessible to heavy machinery can make large<br />
scale commercial coppicing impractical. Notwithstanding the comments made in section 9.6, if<br />
biomass heating is to be a significant part of a mixed <strong>energy</strong> market, fuel production on a quasiindustrial<br />
basis may need to be considered. Short rotation crops (SRC) such as willow and<br />
poplar varieties can be planted on a wide range of soil types from heavy clay to sand, including<br />
land reclaimed from mineral workings and colliery spoil. In general terms, these may be<br />
56
harvested four years after planting and may then be coppiced every 3‐5 years. The most<br />
efficient way to harvest short rotation crops of willow and poplar is to use direct‐chip<br />
harvesters; the chip material then needs to be dried in store to an optimum 30% moisture<br />
content. Up to 18 tonnes per hectare may be yielded annually and the coppice stools may be<br />
productive for up to 30 years. Two further advantages are that SRC can be grown in an<br />
industrial environment on poor, marginal land and that the <strong>energy</strong> per hectare is high as shown<br />
in table 5 85 below:<br />
Table 5: Approximate yearly outputs of biofuels<br />
Fuel<br />
(MC=moisture<br />
content)<br />
Wood (forestry<br />
residues, SRW,<br />
thinnings etc) @<br />
30% MC<br />
Wood (SRC<br />
Willow) @ 30%<br />
MC<br />
Miscanthus 86<br />
@25% MC<br />
Wheat<br />
@20% MC<br />
Straw<br />
Net calorific<br />
value (MJ/kg)<br />
Output per<br />
hectare p.a.<br />
MT/ha.a)<br />
Energy per<br />
hectare p.a.<br />
GJ/ha.a<br />
Energy per<br />
Hectare p.a.<br />
MWh/ha.a<br />
13 2.9 37 10.3<br />
13 12.9 167 46<br />
13 17.3 225 63<br />
13.5 4.6 62 17<br />
85 Forestry Commission Biomass Website: Potential outputs of biofuels per hectare, per annum<br />
86 Miscanthus is Miscanthus giganteus, “Elephant Grass” a sterile hybrid of African origin, now grown extensively<br />
on the continent as fuel biomass.<br />
57
THIS PAGE IS INTENTIONALLY BLANK<br />
58
5 FUNDING<br />
5.1 <strong>Renewable</strong> Electricity Support Mechanisms<br />
5.1.1 A number of financial support mechanisms for renewable electricity, in the form of<br />
obligations, grants and incentives, have been implemented by the government over a number<br />
of years, to try to create a more level playing field for this form of <strong>energy</strong> generation. However,<br />
even with demonstrable savings over time in <strong>energy</strong> costs and carbon emissions, the capital<br />
cost of renewable <strong>energy</strong> schemes has been a deterrent to their implementation for many<br />
organisations and individuals, for whom the level and availability of government support has<br />
often been the deciding factor.<br />
5.1.2 The range of grants and loans offered differs from county to county and between areas<br />
of poverty and affluence and with limited pots of money available, the impact of some schemes<br />
has been minimal. Some of <strong>Kent</strong>’s districts and boroughs have benefited from funding allocated<br />
in the Regional Housing Board round (2008‐11) which focused on delivering decent homes and<br />
<strong>energy</strong> efficiency measures in private sector housing, but these grants or loans have seldom<br />
applied to microgeneration. Successful exceptions to this have been short‐term schemes<br />
offered in the past by Canterbury and Shepway councils for mainly solar technologies. 87<br />
5.2 The <strong>Renewable</strong>s Obligation (RO)<br />
5.2.1 Introduced by the Utilities Act in 2000, this mechanism places an obligation on suppliers<br />
to source an increasing proportion of their electricity from a range of renewables to stimulate<br />
an increase in capacity. The first <strong>Renewable</strong>s Obligation Order was made in April 2002 and in a<br />
scheme administered by Ofgem, generators of renewable electricity can obtain <strong>Renewable</strong><br />
Obligation Certificates (ROCs), which can be sold to suppliers or traded. ROCs are available for:<br />
• Agriculture and forestry wastes, and <strong>energy</strong> crops<br />
• All biodegradable material<br />
• Co‐firing of biomass with fossil fuel<br />
• Geothermal (hot dry rock and aquifers)<br />
• Hydro power (under 20MW)<br />
• Landfill gas and sewage gas<br />
• Photovoltaics<br />
• Tidal and tidal stream<br />
87 Matthew Morris, Senior Project Manager, Energy Saving Trust Advice Centre – written evidence<br />
59
• Wave <strong>energy</strong><br />
• Wind <strong>energy</strong> (offshore and onshore) 88<br />
5.2.2 In addition to the electricity value, and that of sold or traded ROCs an additional benefit<br />
of ROCs is exemption from the Climate Change Levy (a small extra charge per kWh) via<br />
exemption certificates (LECs). The latest <strong>Renewable</strong>s Obligation Order, from 1 April 2009,<br />
rather than a specific percentage of electricity, required suppliers in England to present 9.7<br />
certificates per 100MWh of electricity supplied in England (in 2009/10), rising to 11.1 per 100<br />
MWh (in 2010/11).<br />
5.2.3 The Energy Act 2008 introduced ‘banding’ to the <strong>Renewable</strong>s Obligation to incentivise<br />
particular technologies.<br />
5.3 Low Carbon Buildings Programme<br />
5.3.1 The Low Carbon Buildings Programme was a national grant scheme which operated<br />
from 2006 to 2010 offering grants of between £600 and £1200 for renewable <strong>energy</strong><br />
installations. Different strands of the scheme focused on installations for householders,<br />
communities, medium and large scale installations with additional grants specifically for the<br />
public sector. The scheme’s take up in the South East with regard to domestic installations is<br />
detailed in section 4.<br />
5.3.2 The Select Committee learned that while the scheme was popular, the stop‐start nature<br />
of support, as streams of funding became available or ended, created a very difficult<br />
environment for businesses to operate in, as demand fluctuated with the availability of grants.<br />
Furthermore, the level of interest from the public in microgeneration schemes has not, so far,<br />
been matched by schemes coming to fruition and implementation has been limited.<br />
‘…only around 20% of those considering to buy microgeneration go on to obtain a quote<br />
and only a small fraction of these (30‐40%) go on to purchase. 89<br />
5.3.3 The Low Carbon Building Programme was withdrawn in early 2010 in favour of the<br />
Feed‐in Tariff and the forthcoming <strong>Renewable</strong> Heat Incentive.<br />
88 DECC, 2010 Energy Trends Special Report: <strong>Renewable</strong> Energy in 2009<br />
89 LCBP funded installations 07/08 from Tom Vosper, Head of Biomass Team, Creative Environmental Networks –<br />
written evidence<br />
60
5.4 Feed in tariff (FIT)<br />
‘The Feed‐in Tariff will support growth and employment in the renewable <strong>energy</strong> industry,<br />
and bring down the cost of renewable technologies.’ 90<br />
5.4.1 The Feed in Tariff was introduced on 1 st April 2010 under Section 100 of the Energy Act<br />
2008, and is now the main support mechanism for small scale renewable generation. It<br />
significantly changes the economics of microgeneration, making schemes for households and<br />
communities financially viable. The way it works is depicted below.<br />
Source: EST<br />
5.4.2 The technologies it applies to are listed on the following page in Table 6 along with the<br />
tariff rate per kWh of electricity generated, which is dependent on the type and size of<br />
technology installed. The best rate is for the installation of solar photovoltaic panels (PV) at<br />
41.3p per kWh of electricity generated and used, plus a bonus payment (3p per kWh, index<br />
linked) for electricity exported to the grid, for systems installed between 15 th July 2009 and 31 st<br />
July 2012.<br />
5.4.3 PV has the longest tariff payment period of 25 years but prompt take up of the scheme<br />
is necessary in order to gain the maximum rate, guaranteed for the entire period, as rates fall<br />
over time. For an average household, the time to payback the cost of installing a 2.5kW system<br />
is around 10 years and so provided the initial capital can be accessed, there would follow a 15<br />
year period with much reduced electricity bills and an annual income of just under £1000.<br />
90 Richard Hurford, Head of Energy Saving Trust – Hearing 19 th May 2010<br />
61
Figure 6: The Feed in Tariff – initial rates for different technologies 91<br />
Energy Source<br />
Scale<br />
Generation Tariff<br />
(p/kWh)<br />
Duration<br />
(years)<br />
Anaerobic digestion ≤500kW 11.5 20<br />
Anaerobic digestion >500kW 9.0 20<br />
Hydro ≤15 kW 19.9 20<br />
Hydro >15 ‐ 100kW 17.8 20<br />
Hydro >100kW ‐ 2MW 11.0 20<br />
Hydro >2kW ‐ 5MW 4.5 20<br />
Micro‐CHP 4‐10kW 36.1 25<br />
Solar PV >10 ‐ 100kW 31.4 25<br />
Solar PV >100kW ‐ 5MW 29.3 25<br />
Solar PV Standalone 29.3 25<br />
Wind ≤1.5kW 34.5 20<br />
Wind >1.5 ‐ 15kW 26.7 20<br />
Wind >15 ‐ 100kW 24.1 20<br />
Wind >100 ‐ 500kW 18.8 20<br />
Wind >500kW ‐ 1.5MW 9.4 20<br />
Wind >1.5MW ‐ 5MW 4.5 20<br />
Existing generators<br />
transferred from<br />
RO<br />
9.0 to 2027<br />
5.4.4 The success of the scheme will be key to the government’s wish to involve the private<br />
sector, communities and individuals in order to achieve renewable <strong>energy</strong> targets and diversify<br />
supply. This method of fiscal stimulus for renewables is used in 19 EU countries; 47 throughout<br />
the world. 92<br />
91 Source and further information: http://www.fitariffs.co.uk<br />
92 Ecobuild Conference – Seminar Session<br />
62
5.4.5 Feed‐in tariffs were introduced in Germany in 2000 and the rapid increase in<br />
photovoltatic installations that resulted, is shown in Figure 10 below. It is expected that it will<br />
have a similar positive effect on the renewable industry in the UK, helping to provide jobs,<br />
while also bringing down the price of technologies. 93<br />
Figure 10: The effect of the Feed‐in Tariff on PV installations in Germany 94<br />
Introduction of FIT<br />
5.4.6 Given the introduction of the Feed‐in Tariff, and the change in legislation regarding local<br />
authority sale of electricity, the Select Committee believe that KCC should take immediate<br />
steps to increase generation of renewable electricity on the KCC estate and encourage other<br />
public bodies to do the same. There is also potential for KCC, through Laser, to maximise its<br />
buying power and achieve the best price for public sector procurement of PV systems.<br />
RECOMMENDATION 9<br />
That KCC implements an immediate review of its properties to assess their suitability and<br />
develop strategies for the installation of renewable technologies, particularly photovoltaic<br />
(PV) panels, and encourages District and Borough <strong>Council</strong>s, housing providers, emergency<br />
services, health institutions and other targeted businesses to do the same in their estates,<br />
taking advantage of current incentives, in order to reduce <strong>energy</strong> costs; generate income and<br />
catalyse the acceptance of renewable technologies in the wider community..<br />
93 Richard Hurford, Head of Energy Saving Trust – Hearing 19 th May 2010<br />
94 Ibid<br />
63
5.5 <strong>Renewable</strong> Heat Incentive<br />
5.5.1 Section 100 of the Energy Act 2008 made provision for the <strong>Renewable</strong> Heat Incentive<br />
(RHI) and, following the government’s publication of its proposed operation, detailing the<br />
technologies, tariffs and eligibility criteria, consultation on the RHI ended in April 2010.<br />
Following secondary legislation the RHI is due to start on 1 st April 2011. The Forestry<br />
Commission informed the Select Committee that under the proposed scheme, biomass boilers<br />
installed after July 2009 would qualify for the incentive according to the amount of heat<br />
produced by the boiler.<br />
5.6 Energy Efficiency Funding for <strong>Kent</strong> Businesses<br />
5.6.1 The Energy Grant 500 scheme, which is SEEDA funded through the European Regional<br />
Development Fund (highlighted in the box below), is administered through Business Support<br />
<strong>Kent</strong> and promoted through the Sustainable Business Programme. It can cover any aspect of<br />
business <strong>energy</strong>‐use reduction and provides funding for <strong>energy</strong> efficiency measures. Any Small<br />
or Medium sized Enterprise (SME) can apply to the scheme, which also loans out smart meters<br />
which have been found to be an excellent tool for <strong>energy</strong> reduction. The scheme is very simple,<br />
and once approved, businesses can carry out their <strong>energy</strong> saving work, submit invoices and<br />
obtain the grant. Data from the businesses who have so far benefitted from the scheme<br />
indicate that on average, savings of £637 per year on <strong>energy</strong> costs can be made (equal to a<br />
reduction of 3.66 tonnes in CO 2 emissions). The 660 grants for the South East Region are each<br />
worth £500 and the aim is that this will ‘act as a primer’ and lead to businesses adopting <strong>energy</strong><br />
saving behaviours as the norm. 95<br />
‘The European Regional Development Fund (ERDF) has been established to<br />
reduce the gap between the levels of development of various regions and the<br />
extent to which the least‐favoured regions and islands (including rural areas) are<br />
lagging behind. With nearly £22 million European funding from ERDF, the aim of<br />
the South East England Operational Programme (SEEOP) is to promote<br />
competitiveness and productivity in the South East of England through resource<br />
efficiency. This will have the win‐win benefit for the region of strengthening our<br />
economic competitiveness at the same time as contributing to reducing the<br />
region's ecological footprint to achieve the vision of achieving sustainable<br />
prosperity by 2016.’ 96<br />
95 Jane Ollis, Head of Sustainable Business, Business Support <strong>Kent</strong> – Hearing 26 th May 2010<br />
96 Source: http://www.seeda.co.uk/what‐we‐do/european‐investment/erdf<br />
64
5.6.2 In another example of ERDF funding, Medway <strong>Council</strong> informed the Select Committee<br />
that they had obtained funding for two projects in order to support local businesses: Eco‐<br />
Advantage, which combines the market’s need for environmental skills with the opportunity to<br />
train and provide new skills e.g. in sustainable construction, to local unemployed people, those<br />
on low income or with a low level of skills. Secondly, the LO‐C‐US project provides local<br />
businesses with support which will help them to reduce <strong>energy</strong> costs and become more<br />
competitive 97 .<br />
5.7 Funding for <strong>energy</strong> efficiency and renewables on the KCC estate<br />
5.7.1 With reference to the schools estate, the Select Committee learned that maintenance<br />
funding is not used for <strong>energy</strong> efficiency work, its main objective being to keep schools safe,<br />
warm and operating. However, the Select Committee believe that all maintenance work should<br />
take <strong>energy</strong> efficiency into account.<br />
5.8 The Energy and Water Investment Fund<br />
5.8.1 The Energy and Water Investment Fund (EWIF) is a capital pot which originally<br />
benefitted from funding by the government. It was match funded from the Low Carbon<br />
Buildings Programme (LCBP) to make (mainly) <strong>energy</strong> saving improvements to the KCC estate,<br />
though there was at one time also a £100,000 water grant. The fund, which was at its peak<br />
worth just over £2 million, fluctuates as loan payments are recycled back into the scheme.<br />
5.8.2 In addition, a £500,000 grant for renewable <strong>energy</strong> systems was identified and this has<br />
now been spent. Funding from the LCBP is no longer available as this programme has closed<br />
and the Select Committee learned that despite the enthusiasm from schools, applications to<br />
the scheme overall were disappointing.<br />
5.8.3 The payback period stipulated for the fund was 1‐5 years and although linked to carbon<br />
reduction, this precluded the implementation of a range of renewable <strong>energy</strong> schemes whose<br />
payback time was longer.<br />
5.8.4 There have been demonstrable savings from the investments made, and evidence to<br />
the Select Committee indicates that for <strong>energy</strong> efficiency work in particular, the Fund provided<br />
£928,995 in loans and grants which will result in eventual savings estimated at £1,923,246 over<br />
the installed equipment’s lifetime (though potentially more, dependant on future <strong>energy</strong><br />
costs). It is now a familiar scheme and the Select Committee feel it is would be worthwhile to<br />
seek an alternative funding source to refresh the recycling funds, as loans are repaid, to enable<br />
97 Steve Long, Senior Research and Review Officer, Medway <strong>Council</strong> – supplementary evidence<br />
65
further work to take place, pending the successful implementation of an alternative funding<br />
mechanism. Along with ‘an <strong>energy</strong> checklist’, information about the Energy and Water<br />
Investment Fund was a top choice of respondents to <strong>Kent</strong> schools’ survey carried out as part of<br />
this review, when asked about the type of support that they would most value.<br />
RECOMMENDATION 6<br />
That KCC reconfigures the Energy and Water Investment Fund, with a longer payback period,<br />
to enable continued provision of capital funding for <strong>energy</strong> efficiency measures on the<br />
estate and to allow for the longer‐term investment required for the installation of<br />
renewable <strong>energy</strong> systems.<br />
5.9 The Building Energy Efficiency Programme (BEEP)<br />
5.9.1 This programme is an international funding initiative (part of the Clinton Climate<br />
Initiative) which is now being taken forward by the London Development Agency and rolled out<br />
across London with the aim of reducing carbon emissions from city buildings. Energy and<br />
facilities managers in councils and other public bodies across London have been consultees to<br />
the scheme, which proposes a commercial model to address the problem of capital funding for<br />
renewable and other <strong>energy</strong> efficiency projects. The model acknowledges and seeks to address<br />
the two main problems preventing the public sector from addressing the <strong>energy</strong> emissions<br />
from its own estate i.e. capital funding, and capacity/expertise.<br />
5.9.2 The model of financing being developed aims to set the amount of loan funding so that<br />
it is less than or equal to the amount of savings to be made, through the implementation of<br />
<strong>energy</strong> (and therefore cost) saving measures. For London, it has been calculated that<br />
retrofitting buildings in both the public and private sector could avoid 3.6 million tonnes of<br />
carbon emissions (1 million tonnes from the public sector alone) 98 .<br />
5.10 Energy Service Companies<br />
5.10.1 The expertise for the BEEP <strong>energy</strong> performance contracting model is provided through<br />
the employment of Energy Service Companies (ESCOs) who would provide guaranteed <strong>energy</strong><br />
and cost savings, making the exercise cost neutral in a relatively short period of time (around 8<br />
years) followed by a period of ongoing savings. The programme has been piloted in London by<br />
TfL (Transport for London), The London Fire Brigade and the Metropolitan Police.<br />
98 Simpson‐Jones, R., 2009 Introduction to the Building Energy Efficiency Programme, online at:<br />
<br />
66
5.10.2 The Select Committee sought evidence on various types of ESCO and for example heard<br />
from Mr John Thorp of Thameswey Limited, who are a publicly owned ESCO set up by Woking<br />
Borough <strong>Council</strong> to invest in Combined Heat and Power (CHP – in this case gas powered) to<br />
provide <strong>energy</strong> to residents, with less impact on the environment than from centralised<br />
supplies. Mr Thorp advised the Committee that since 1990, the ESCO arrangements have<br />
resulted in substantial <strong>energy</strong> and cost savings for the <strong>Council</strong>, including a 31% reduction in<br />
<strong>energy</strong> consumption and a 29% reduction in CO 2 emissions. In the borough, the <strong>energy</strong><br />
efficiency of homes has been improved by 35% and emissions reduced by 21%. 99<br />
5.10.3 An alternative type of ESCO was set up by Lewes District <strong>Council</strong> in the form of OVESCO,<br />
which started as a limited company, providing <strong>energy</strong> advice and assistance to the council,<br />
community groups such as Transition Towns, businesses and individuals and has now become<br />
an Industrial and Provident Society for Community Benefit, aiming to issue shares to the public<br />
to enable them to invest in local sustainable <strong>energy</strong> projects. 100<br />
5.10.4 Below is a summary of ESCO types and some of the alternative funding arrangements,<br />
which could, for example, facilitate the installation of biomass boilers in public sector buildings.<br />
(As noted, biomass boilers provide reduced cost heating which have been demonstrated in<br />
<strong>Kent</strong> schools to give a 90% reduction in carbon emissions and good payback times, but at high<br />
initial capital cost and with the need for ongoing maintenance.)<br />
Energy Service Companies (ESCOs)<br />
An ESCO can take away from the user the need to co‐ordinate installation, maintenance, repair<br />
and fuel supply (possibly purchasing all or part of the plant itself), earning income from the<br />
metered heat, by way of a heat agreement. This is suitable for sites without the capital to<br />
invest in biomass technology, and with a high heat demand. A disadvantage is that the cost of<br />
metered heat could vary, moreso where there is less public sector involvement.<br />
There are four basic models of ESCO on a spectrum ranging from publicly to privately owned<br />
and, for example, the greater degree of control at the ‘public’ end of the spectrum would mean<br />
that more stable heat costs could be achieved but on the right of the spectrum, the risks in<br />
terms of technology and price fluctuations are taken on by a private company. 101<br />
Public Joint public/private Stakeholder owned Private<br />
99 John Thorp, Director, Thameswey Limited – Hearing 14 th April 2010<br />
100 Howard Johns and Chris Rowlands, Directors, OVESCO – Hearing 26 th May 2010<br />
101 King, M., 2010 SEPB Conference Presentation<br />
67
Other types of funding arrangement suitable for biomass heating:<br />
Turnkey Installation<br />
Contractors install and set up the heating system; maintenance and management is carried out<br />
by the user.<br />
Turnkey & Service<br />
Contractors install the heating system and carry out regular servicing. The purchaser benefits<br />
from reduced running costs and no maintenance requirement but needs to source fuel and<br />
servicing.<br />
Back‐to‐Back: turnkey, operations, maintenance and fuel supply<br />
Contractor installs the heating system, looks after operations, maintenance and fuel supply.<br />
User does day‐to‐day running of the system, with support and guidance from the contractor.<br />
5.11 Energy company funding for school renewable <strong>energy</strong> projects<br />
5.11.1 A number of schemes are beginning to emerge in the UK whereby <strong>energy</strong> companies<br />
offer to invest in schools renewable <strong>energy</strong> projects. For example a proposed British Gas<br />
scheme aims to invest £15 million in solar technology for 750 schools which would give a<br />
proportion of free electricity. This particular scheme includes educational elements such as<br />
lesson plans and other awareness raising such as smart metering, a website shared by schools<br />
on the scheme and <strong>energy</strong> saving measures as prizes. At this stage it is not clear who would<br />
benefit from any Feed‐in Tariff payments, but it is assumed the <strong>energy</strong> company would benefit,<br />
rather than the school. 102<br />
5.11.2 General Electric and Solarcentury also have a scheme to install solar PV technology, on<br />
a 15 year lease (on payment of a small deposit). This would cut the school’s <strong>energy</strong> bills and<br />
earn income from the Feed‐in Tariff, with 10 years further revenue from FIT at the end of the<br />
lease when ownership of the panels would revert to the school resulting in considerable<br />
savings in costs and carbon emissions. This type of scheme would also avoid the necessity for<br />
high capital costs which are quoted as being around £16,000 for a primary school and £35,000<br />
for a secondary school.<br />
102 The website for the scheme is: http://www.generationgreen.co.uk/solarpanels/<br />
68
RECOMMENDATION 12<br />
That KCC works with public agencies and approved suppliers, to provide a package of advice<br />
and support to schools, to enable them to benefit from <strong>energy</strong> efficiency work and<br />
renewable <strong>energy</strong> installations, at no net cost to the school or to KCC.<br />
5.12 KCC options for future projects on its estate<br />
5.12.1 Having considered the funding models available to KCC, and with the likelihood of a<br />
variety of ESCO‐type offers being made to schools, the Select Committee considered whether<br />
more work could be carried out at the same cost, if the council set up its own ESCO and/or<br />
sought to work in partnership with other organisations to provide a back‐to‐back service. A<br />
brokerage service for schools who may otherwise independently undertake schemes in<br />
partnership with <strong>energy</strong> companies could also help to identify the most appropriate solutions.<br />
Either of these options should help to avoid some of the pitfalls that the Select Committee has<br />
been made aware of regarding the need to co‐ordinate installation/supply/maintenance as well<br />
as manage ongoing fuel needs (in the case of biomass which routinely requires considerably<br />
more every day maintenance and attention that, say, a gas powered heating system).<br />
RECOMMENDATION 3<br />
That KCC develops the existing expertise within KCC and Commercial Services (LASER) and<br />
builds capacity in order to ensure that the <strong>Council</strong> has access to sound, unbiased advice<br />
when taking <strong>energy</strong> efficiency and renewable <strong>energy</strong> schemes forward.<br />
RECOMMENDATION 4<br />
That KCC sets up new delivery mechanisms as appropriate in order to take advantage of<br />
emerging opportunities, allied to but separate from LASER, e.g. Energy Services Company<br />
(ESCO).<br />
5.13 Funding for Low‐Carbon Communities<br />
5.13.1 Following on from a project in 2009 to find out what people across the country felt<br />
about domestic <strong>energy</strong> efficiency and how communities could get their <strong>energy</strong> supplies in the<br />
future, a Low Carbon Community Challenge was issued to 20 communities to look, for example,<br />
69
at how behaviour change and community engagement could contribute to ‘low <strong>energy</strong><br />
lifestyles’. 103<br />
5.13.2 <strong>Kent</strong> hosts many community groups focused on or working towards more sustainable<br />
lifestyles and <strong>energy</strong>/carbon reduction, including as Eco‐congregation, Fairtrade Towns,<br />
Greening Campaign and Transition Towns. 104 There are already four Transition Towns in <strong>Kent</strong>:<br />
Canterbury, Sevenoaks, Whitstable and Tunbridge Wells, (with more groups planned in Deal,<br />
Faversham and Tonbridge). The Select Committee heard from members of the Sevenoaks<br />
Group about their commitment to making communities more resilient and able to cope with<br />
the shift away from fossil fuel dependence. Transition Town groups work on long term ‘Carbon<br />
Descent’ plans to help them achieve a more sustainable way of living, including, <strong>energy</strong> and<br />
food supplies which must both be addressed in order to achieve local sustainability. 105106<br />
5.13.2 Four Low Carbon Community pilot projects, in Eastchurch, Elham, Hadlow and St<br />
Margaret’s at Cliffe each received seed funding, and have since gone on to develop their own<br />
plans. A key finding from evaluation of the projects was that:<br />
‘… groups need assistance to get off the ground, such as hiring halls and funding publicity for<br />
awareness‐raising events. The development of a ‘start‐up fund’ would therefore allow groups to<br />
set up their project, build community support and spread awareness. 107 ’<br />
5.13.3 The Select Committee also heard about the work of Carbon Free Group, based at Pines<br />
Calyx, St Margaret’s at Cliffe who have worked with village residents and arrived at a proposal<br />
for the whole community to become carbon neutral, (potentially the first of its kind) meeting<br />
<strong>energy</strong> needs locally using a range of renewable <strong>energy</strong> options, including biomass combined<br />
heat and power (CHP) for the whole village. The scheme would involve the setting up of a<br />
Community Interest Company so that local people can buy shares in the scheme as well as<br />
benefitting from reduced fuel costs. 108<br />
103 Breeze, L., 2009 Supporting Low Carbon Communities in <strong>Kent</strong>: An appraisal of initiatives and opportunities. KCC<br />
Internal Report<br />
104 Ibid<br />
105 Steve Plater and Ian Smith, Core Group Members, Sevenoaks Transition Town – Hearing 19 th May 2010<br />
106 Dr Howard Lee, Lecturer and Sustainability Champion, Hadlow College – Hearing 12 th May 2010<br />
107 Breeze, L., 2009 Supporting Low Carbon Communities in <strong>Kent</strong>: An appraisal of initiatives and opportunities. KCC<br />
Internal Report p9<br />
108 Jae Mather, Director of Sustainability, Carbon Free Group – written evidence<br />
70
5.13.4 Individuals are often keen to involve themselves in groups with like‐minded people,<br />
rather than simply pursuing household‐level schemes such as one member of the public who<br />
wrote in to the Select Committee, saying:<br />
‘If you know of any sustainability/<strong>energy</strong> group in Hythe or Folkestone, please let me know – I<br />
feel I am a lone voice in the wilderness!’<br />
5.13.5 Sustainability and Climate Change Manager, Carolyn McKenzie, indicated to the Select<br />
Committee that in her view, a small number of groups are already at the stage where they<br />
could immediately progress with <strong>energy</strong> related projects, with some financial help.<br />
5.13.6 The Select Committee is therefore keen that seed funding should be made available to a<br />
number of low‐carbon community groups in <strong>Kent</strong> to enable them to progress and to reach out<br />
to individuals in their communities.<br />
Recommendation 16<br />
That KCC supports low‐carbon community groups in the county by facilitating access to<br />
existing support and providing small grants of up to £5000 for advice or to assist with<br />
feasibility studies.<br />
5.14 Funding for individual households<br />
5.14.1 Energy efficiency schemes in homes become progressively more expensive after the<br />
first 20‐35% of cuts and ‘Pay as You Save’ (PAYS) could enable borrowing of around £50 a<br />
month to be rewarded over 20‐25 years by immediate <strong>energy</strong> cost savings of £60‐70 per<br />
month. Mr Mather of the Carbon Free Group told the Select Committee that multiple benefits<br />
could result from such scheme by saving residents’ money; reducing carbon emissions; securing<br />
<strong>energy</strong> supplies and helping to provide local jobs. 109<br />
RECOMMENDATION 7<br />
That KCC facilitates access to emerging financial mechanisms, such as the new Green Deal<br />
and the Green Investment Bank, whereby schools, businesses and householders in <strong>Kent</strong> can<br />
take advantage of loan funding to pay for the installation of renewable <strong>energy</strong> and <strong>energy</strong><br />
efficiency systems on suitable properties, with repayments and term set to achieve a net<br />
saving in <strong>energy</strong> costs for the property and a reasonable rate of return over the period of<br />
the loan to investors (on a ‘Pay as you Save’ basis).<br />
109 Jae Mather, Director of Sustainability, Carbon Free Group – Written evidence<br />
71
THIS PAGE IS INTENTIONALLY BLANK<br />
72
6 ENERGY EFFICIENT BUILDINGS<br />
6.1 European Directive<br />
‘In short being <strong>energy</strong> efficient is a good thing as it can save money.’ 110<br />
6.1.1 The European Directive on <strong>energy</strong> performance of buildings (2002/91/EC) was updated<br />
in May this year and it requires Members States to apply minimum standards for buildings<br />
<strong>energy</strong> efficiency. The reduction of <strong>energy</strong> use and emissions form buildings is key to the<br />
achievement of the 20% reductions required by 2020.<br />
6.2 Display Energy Certificates<br />
6.2.1 On 1 st October 2008 Display Energy Certificates (DECs) were introduced under the<br />
European Energy Performance of Buildings Directive (EPBD) in an attempt to address the high<br />
proportion of <strong>energy</strong> consumption in buildings which account for 40% <strong>energy</strong> consumption<br />
across the EU. Applicable to individual public‐access buildings of over 1000m 2 , the aim was to<br />
increase public awareness of <strong>energy</strong> use and efficiency by displaying the <strong>energy</strong> rating of each<br />
public building based on its <strong>energy</strong>/fuel use and emissions. Buildings are graded A‐G (best to<br />
worst) and also have a numerical rating (the lower the better).<br />
6.2.2 Schools represent a large proportion of the 40,000 public buildings required to display a<br />
DEC, which must be updated every year. DEC and accompanying Advisory Reports (listing costeffective<br />
improvement measures) require the services of an accredited <strong>energy</strong> assessor. Details<br />
of KCC’s work on its own estate in this regard are given on page 33. The Energy Performance<br />
Certificates are also required for new buildings or those offered for sale or rent. The Directive<br />
also requires a change in Building Regulations and these are being gradually amended to reflect<br />
sustainable construction requirements.<br />
6.3 Demand Reduction<br />
6.3.1 There are widely accepted methods of <strong>energy</strong> demand reduction which most people<br />
will be familiar with such as good housekeeping (including switching off lights and equipment<br />
when not in use); replacing worn out appliances with ‘A’ rated equivalents; replacing<br />
conventional lightbulbs with low <strong>energy</strong> lightbulbs; installing/increasing loft and cavity wall<br />
insulation and upgrading windows and doors. The relatively simple measure of installing cavity<br />
wall insulation can reduce heat loss from most buildings by 40%.<br />
6.3.2 In addition, technologies such as voltage optimisation have been shown to offer<br />
reductions in base demand. For example the Select Committee learned that calculations made<br />
110 Karl Jansa, Business Development Manager, Locate in <strong>Kent</strong> – written evidence<br />
73
in relation to a ‘whole community’ approach to <strong>energy</strong> at St. Margaret’s at Cliff, indicated that<br />
savings of £66 per household per annum could be made, following initial outlay equivalent to<br />
£266 per household, and thus a payback period of only four years 111 making them a very cost<br />
effective retrofittable technology in both domestic and commercial settings where individually,<br />
the average payback times are 5 years and 2.5 years respectively. 112<br />
Voltage Optimisation<br />
The average voltage supplied to premises in the UK is around 242V. This varies in Northern<br />
Ireland and the Republic of Ireland where it is 239 and 235V respectively. Operating equipment<br />
at a higher‐than‐necessary voltage can lead to greater <strong>energy</strong> loss in the form of heat and<br />
voltage/current optimisation works to minimise those losses, which in turn reduces costs and<br />
CO 2 emissions. Savings of 15‐20% are quoted in various sources.<br />
For some time, the voltages supplied to premises in the UK and continental Europe have been<br />
different, with the UK’s at 240V ±6% and Europe’s at 220V. This situation has now been<br />
remedied through harmonisation so that Europe’s supply is 230V ± 10%, (statutory limits of<br />
207–253 Volts). Within that range, the UK supply has lower tolerances still in force (216‐253<br />
Volts). In reality, there has been little change to the voltage supplied, but it is higher than<br />
strictly necessary according to the Institution of Electrical Engineers who, in a 1996 <strong>report</strong>,<br />
recommended equipment be tested across the range 198‐253 Volts (to allow for voltage drops<br />
that may occur). Voltage optimisation technology reduces the voltage supplied to a site, thus<br />
cutting <strong>energy</strong> usage and costs and with the additional benefit that equipment lasts longer and<br />
needs less maintenance.<br />
6.4 Warm Homes Greener Homes<br />
6.4.1 The government’s strategy for Household Energy Management 113 sets out the plan for<br />
reducing CO 2 emissions from domestic buildings by 29% (24 million tonnes CO 2 – by 2020). The<br />
proposals aim to ensure that by 2015 every home will have loft and cavity wall insulation, a<br />
smart meter and display and that up to 7 million homes will, over and above that, have an ecoupgrade<br />
with measures like solid wall insulation or heat pumps. The strategy envisages that<br />
people in rented accommodation will have more efficient homes and the industry will employ<br />
111 Alistair Gould, The Bay Trust: ‘Keeping the Lights On’ Protect <strong>Kent</strong> Energy Conference presentation<br />
112 James Sweet, Commercial Director, C4Ci – written evidence<br />
113 DECC, 2010 A Strategy for Household Energy Management: Warm Homes Greener Homes. London<br />
74
around 65,000 people in core <strong>energy</strong> efficiency provision alone and that everyone should have<br />
access to Home Energy Advice. 114<br />
6.4.2 The take up of <strong>energy</strong> efficiency measures in <strong>Kent</strong>, as recorded on the Homes Energy<br />
Efficiency Database (HEED) 115 is shown in Figure 11 below:<br />
Figure 11: Energy Efficiency measures (excluding lightbulbs) carried out in <strong>Kent</strong><br />
20000<br />
18000<br />
18631<br />
16000<br />
14000<br />
12000<br />
10000<br />
9990<br />
14970<br />
12643<br />
8988<br />
12672<br />
10406 9977<br />
14314<br />
10507<br />
12902<br />
8000<br />
6000<br />
6270<br />
4000<br />
2000<br />
0<br />
Ashford<br />
Canterbury<br />
Dartford<br />
Dover<br />
Gravesham<br />
Maidstone<br />
Sevenoaks<br />
Shepway<br />
Swale<br />
Thanet<br />
Tonbridge &<br />
Malling<br />
Tunbridge<br />
Wells<br />
6.5 Public awareness and perception of <strong>energy</strong> efficiency<br />
6.5.1 While the public generally have a good awareness of basic <strong>energy</strong> efficiency measures,<br />
resistance to making the necessary changes still exists and economic concerns usually outweigh<br />
environmental considerations. Furthermore, government’s subsidy of <strong>energy</strong> efficiency<br />
measures has not yet prompted market forces to take over in spite of very short payback times.<br />
For many people, it would seem, the initial spending required to implement even those <strong>energy</strong><br />
efficiency measures with a very quick pay back, is a deterrent and the ‘hassle factor’ is also<br />
significant. 116<br />
114 Richard Hurford, Head of Energy Saving Trust – Hearing 19 th May 2010<br />
115 Ibid<br />
116 Dr Wayne Cranstone, Head of Onshore Development and Projects, RNRL ‐ written evidence<br />
75
6.5.2 Monitoring devices with <strong>energy</strong> displays have been shown to cut down <strong>energy</strong> use and<br />
costs by between 5 and 10 %. There are two main types: smart meters to replace existing<br />
meters which display <strong>energy</strong>, emissions and cost information (Section 8 refers) and wireless<br />
display devices. The latter are a quick and easy way to encourage <strong>energy</strong> efficient behaviour<br />
and many local authorities have introduced <strong>energy</strong> monitor loan schemes, often via libraries.<br />
Units are inexpensive at around £40 each and, for example, would pay for themselves in under<br />
six months in an average household; considerably less in a large building.<br />
RECOMMENDATION 10<br />
That KCC uses <strong>energy</strong> display devices in prominent locations on its estate to encourage<br />
<strong>energy</strong> efficient behaviour (including where renewable <strong>energy</strong> installations are put in place,<br />
to increase awareness of the technology, the <strong>energy</strong> generation and the carbon‐savings).<br />
6.5.3 Creative Environmental Networks undertook a survey of households in Ashford to find<br />
out about attitudes to <strong>energy</strong> and water efficiency 117 . Two key findings were that:<br />
i) Energy efficiency ‘for its own sake’ was not the motivator for most people but<br />
information about costs and savings could prompt them to act.<br />
ii) Householders changed their priorities about <strong>energy</strong> efficiency measures once<br />
they had been informed about their relative cost effectiveness.<br />
6.5.4 The Select Committee believe that it is important, firstly to ensure that householders<br />
have access to accurate and up to date information about technology options and the<br />
accompanying incentives, and secondly to ensure there are affordable ways to access the<br />
capital required to undertake <strong>energy</strong> efficiency work or implementation of renewable <strong>energy</strong><br />
schemes (ensuring that those on lower incomes are not excluded from the longer term<br />
financial benefits to be gained by investing in measures).<br />
6.5.5 KCC Property Group, in conjunction with the Energy Management Team recently<br />
provided clear and concise information to schools on <strong>energy</strong> saving measures and renewable<br />
<strong>energy</strong> options but as the circumstances around grants and incentives have changed<br />
considerably, the Select Committee would like to see this information updated and made<br />
available more widely than it was previously. 118<br />
117 CEN (2009) Ashford Energy and Water Retrofit: Baseline Survey<br />
118 <strong>Kent</strong> <strong>County</strong> <strong>Council</strong>, ‘Environmental Options’<br />
76
RECOMMENDATION 17<br />
That KCC, working with District and Borough <strong>Council</strong>s ensures that <strong>Kent</strong> communities,<br />
including schools, businesses and households have access to clear and current information<br />
on <strong>energy</strong> efficiency and renewable <strong>energy</strong> opportunities, taking into account the Feed‐in<br />
Tariff and any subsequent incentives.<br />
6.6 Area Based Housing Retrofit<br />
6.6.1. The Select Committee learned of a project being planned by KCC and the Energy Saving<br />
Trust to address <strong>energy</strong> inefficient homes in <strong>Kent</strong> on an area by area basis. This follows the<br />
success of similar schemes such as at Kirklees in Yorkshire where a 3 year project to install<br />
cavity wall and loft insulation in 50,000 homes, funded 50% through CERT (Carbon Emissions<br />
Reduction Target funding) and 50% by the <strong>Council</strong>, created 118 jobs and will save an estimated<br />
4.5m tonnes of carbon over the lifetime of the measures. In Kirklees the cost to householders<br />
was £7 on <strong>Council</strong> Tax, but savings of £200 per year per household were achieved. 119 The<br />
proposed <strong>Kent</strong> scheme is highlighted below:<br />
KCC and Energy Saving Trust ‐ Area Based Housing Retrofit in <strong>Kent</strong><br />
‘80% <strong>Kent</strong>’s future housing is already built and much of it is not <strong>energy</strong> efficient’.<br />
100,000 <strong>Kent</strong> homes are eligible for Warm Front Grants (of £3500‐£6000) but take up in <strong>Kent</strong> is<br />
slow with less than 5000 applications per year. Retrofitting these homes could result in £170m<br />
savings for residents and £175 million economic benefit to businesses; providing affordable<br />
warmth for residents and helping to reduce emissions from the housing sector. The aim of the<br />
Retrofit Project is to step up the rate of <strong>energy</strong> efficiency improvements using an area by area<br />
approach (including in hard‐to‐treat homes where renewable <strong>energy</strong> technologies could be<br />
employed to reduce fuel poverty) for the high proportion of older people living in such<br />
homes). 120 Initially the scheme would focus on an area of deprivation and an area of high<br />
<strong>energy</strong> consumption and, working with one utility partner, key features would be:<br />
A single point of contact for multi agency referrals provided by the Energy Saving Trust<br />
Advice Centre (ESTAC)<br />
A Street by street approach<br />
Funding simplified for residents by bringing together various sources into one pot 121<br />
119 Richard Hurford, Head of Energy Saving Trust – Hearing 19 th May 2010<br />
120 Ibid<br />
121 Lucy Breeze, Climate Change Project Officer ‐ supplementary evidence<br />
77
6.6.2 This scheme addresses the various barriers that residents have by simplifying the whole<br />
process and providing advice and co‐ordination and it is welcomed by the Select Committee as<br />
a way to begin to address domestic <strong>energy</strong> usage, and the resulting carbon emissions in <strong>Kent</strong>. It<br />
is important, in taking such schemes forward, that <strong>energy</strong> supply companies are fully<br />
involved. 122<br />
6.7 Energy Efficiency and hard‐to‐treat homes<br />
6.7.1 People living in homes which are hard to treat with conventional <strong>energy</strong> efficiency<br />
measures can benefit from renewables even where other measures are not possible. Work<br />
done by the Energy Saving Trust (EST) has demonstrated that this is sometimes the case where<br />
people live in homes without cavity walls; where installing <strong>energy</strong> efficiency measures would<br />
cause too much disruption such as complete redecoration; or where planning permission would<br />
be needed for changes to the outside of the building. People can benefit from lower <strong>energy</strong><br />
costs (and thus be lifted out of fuel poverty in some cases) if easily retrofitted solar water<br />
heating or solar photovoltaic panels are installed. The Retrofit Project will seek to incorporate<br />
such measures where possible.<br />
6.8 Other approaches to <strong>energy</strong> efficiency in communities<br />
6.8.1 Medway <strong>Council</strong> is trying a different approach to <strong>energy</strong> efficiency through community<br />
engagement, recruiting local residents to become <strong>energy</strong> champions. The champions are<br />
provided with training so that they can identify those who may need support in order to access<br />
advice and benefit from schemes. 123 The involvement of community leaders in such schemes<br />
was also highlighted in a recent <strong>report</strong> by the Sustainable Development Commission 124 .<br />
122 Dr Wayne Cranstone, Head of Onshore Development and Projects, RNRL ‐ written evidence<br />
123 Steve Long, Senior Research and Review Officer, Medway <strong>Council</strong> – supplementary evidence<br />
124 SDC, 2010 Sustainable Neighbourhood Infrastructure: Evidence Base. London<br />
78
7 PLANNING FOR RENEWABLES<br />
What’s needed is ‘a radical change of planning laws, so that renewable <strong>energy</strong> schemes<br />
across <strong>Kent</strong> are encouraged and not impeded.’ 125<br />
7.1 A changed planning hierarchy<br />
7.1.1 The hierarchy that has applied to the planning and development of renewable <strong>energy</strong>,<br />
from the national to the local perspective changed during the information gathering period of<br />
this Select Committee due to the abolition of the Infrastructure Planning Commission and of<br />
Regional Spatial Strategies. A Major Infrastructure Planning Unit within the Planning<br />
Inspectorate will now fast track major infrastructure proposals. The South East Plan is no longer<br />
in force and the current hierarchy is shown in Figure 12 below.<br />
7.1.2 At the time of the Select Committee’s evidence gathering the South East England<br />
Partnership Board (SEPB) were developing the Regional Strategy which required new, more<br />
ambitious regional targets to be set for renewable <strong>energy</strong> development. Members of the<br />
committee attended an SEPB consultation event held at council headquarters in June.<br />
Figure 12: National framework for development of renewable <strong>energy</strong> 126<br />
NATIONAL<br />
Draft National Policy<br />
Statements on <strong>energy</strong><br />
PPS1 & PPS22<br />
LOCAL<br />
Local<br />
Development<br />
Frameworks –<br />
saved local<br />
plan policies<br />
Supplementary<br />
Planning<br />
documents<br />
<strong>Kent</strong><br />
Design<br />
Guide<br />
Masterplans<br />
and Energy<br />
Studies<br />
OTHER<br />
Code for<br />
Sustainable<br />
Homes/BREEAM<br />
Building<br />
Regulations<br />
Energy<br />
Performance<br />
Certificates<br />
125 Dr Howard Lee, Lecturer and Sustainability Champion, Hadlow College – written evidence<br />
126 Based on information provided by Neil Hilkene, Sustainability Manager<br />
79
7.2 Planning for a Low Carbon Future<br />
7.2.1 Following a consultation period from March to June this year, a new National Planning<br />
Policy Statement: Planning for a Low Carbon Future in a changing climate 127 ; bringing together<br />
PPS1: Delivering Sustainable Development (2005) and PPS22: <strong>Renewable</strong> Energy (2004), was<br />
due to be <strong>final</strong>ised in 2010, however a new consultation will now take place and the new PPS is<br />
likely to emerge in early 2011.<br />
7.2.2 The Draft PPS requires that local planning authorities take a much more proactive<br />
stance on planning for sustainable <strong>energy</strong> supplies, for example by making it a condition of<br />
planning consent that major developments meet particular criteria for low carbon design. It<br />
expects planning authorities to promote low carbon and renewable technologies in Local<br />
Development Frameworks (LDFs), underpinned by the local evidence base to encourage<br />
development that will involve communities and increase their resilience to climate change.<br />
7.2.3 In anticipation of the new PPS and based on the evidence with regard to new<br />
development in Ashford, the Select Committee believe that alongside changes to Building<br />
Regulations, it is important that the <strong>energy</strong> requirements of new developments are given a very<br />
high priority. 128<br />
7.3 A more local perspective<br />
7.3.1 For councils in <strong>Kent</strong>, a starting point for the building of a local evidence base is available<br />
from a range of sources. This includes data from the high level assessment undertaken by Land<br />
Use Consultants and TV Energy, for the SEPB and, for example, information from the<br />
Environment agency on the potential for small hydro schemes in <strong>Kent</strong> as well as other types of<br />
renewable <strong>energy</strong> for which they have a regulatory role.<br />
7.3.2 The high level assessment carried out for the SEPB used the Department of Energy and<br />
Climate Change (DECC) methodology shown in Figure 13 on the next page, which had been<br />
developed to encourage a consistent approach to assessing regional capacity for different types<br />
of renewable <strong>energy</strong>. However, when applied to protected areas the methodology was found<br />
to be less effective. The theoretical capacity identified by the study, for renewable technologies<br />
in <strong>Kent</strong>, is given on page 40.<br />
7.3.3 The Select Committee were told that spatial approaches and strategic constraints<br />
mapping ‘are not generally welcomed’ by developers due to the site specific nature of technical<br />
and other issues such as grid connections and the keenness of land owners. 129 However, the<br />
127 http://www.communities.gov.uk/documents/planningandbuilding/pdf/1499780.pdf<br />
128 Dr Laurienne Tibbles, Sustainability Manager, Ashford’s Future – Hearing – 1 st June 2010<br />
129 Dr Wayne Cranstone, Head of Onshore Development and Projects, RNRL ‐ written evidence<br />
80
high level study that has already taken place could be supplemented by local detail in order to<br />
provide a comprehensive picture of the capacity for renewables development in <strong>Kent</strong>.<br />
Figure 13: DECC <strong>Renewable</strong> and Low Carbon Energy Capacity Methodology for the English<br />
Regions ‐ January 2010 130<br />
7.3.4 With regard to designated areas, there is an even greater need for local expertise if<br />
sufficient sites are to be identified, and organisations such as the <strong>Kent</strong> Downs AONB are wellplaced<br />
to proactively identify suitable sites, based on their own detailed knowledge, in order to<br />
assess future capacity and inform target setting. It was suggested that the <strong>County</strong> <strong>Council</strong> could<br />
be best placed to take on the role of co‐ordinating such an effort in <strong>Kent</strong>.<br />
7.4 Local Development Frameworks<br />
7.4.1 Dr Wayne Cranstone stressed to the Select Committee 131 that, from the perspective of<br />
renewable <strong>energy</strong> developers, it is important that KCC works with the local planning authorities<br />
to ensure that ‘the positive national and regional planning policy framework feeds down to the<br />
local level’. In his view the aim should be to arrive at ‘positively worded, criteria‐based policies’<br />
in Local Development Frameworks. David Payne of the South East England Partnership Board<br />
also indicated that, along with national incentives for and public and private sector investment<br />
in renewables, the planning system has a role to enable and promote them at all scales and<br />
development management should ‘fully support the transition to a low carbon future’.<br />
(Recommendation 5 refers)<br />
130 Neil Hilkene, Sustainability Manager – Supplementary evidence<br />
131 Dr Wayne Cranstone, Head of Onshore Development and Projects, RNRL ‐ written evidence<br />
81
7.4.2 KCC is a local planning authority with forward planning responsibility for minerals and<br />
waste as well as a development control function which also covers buildings and new<br />
development in the KCC estate. There is good potential to influence the take up of renewables<br />
through these responsibilities.<br />
7.5 Woking – C Plan<br />
7.5.1 In Woking, a system known as C‐Plan system has been developed in to assist developers<br />
to understand whether the <strong>energy</strong> efficiency measures and renewable <strong>energy</strong>/low carbon<br />
technologies in their proposed plans meet local targets and requirements for carbon<br />
reduction 132 . A system such as this would be helpful to both planning officers and developers in<br />
<strong>Kent</strong>, particularly since planning officers may not necessarily have expertise on sustainability<br />
issues 133 . This view was confirmed by Mr William White of the National Farmers’ Union who<br />
indicated that ‘planners and others involved in planning decisions appear largely unaware of<br />
the technology’. Mr Thorp, Director of Thameswey Limited, an Energy Services Company set up<br />
by Woking Borough <strong>Council</strong>, indicated that using such a tool could both speed up the<br />
application process for the developer, and by stipulating certain conditions, councils could also<br />
‘direct’ developers towards particular technologies that were preferred locally.<br />
7.5.2 The <strong>Kent</strong> Design Guide’s Technical Appendix on Planning and Designing for Sustainable<br />
Energy Use 134 gives guidance to developers on how to respond to planning policies requiring<br />
renewable <strong>energy</strong>, however, a more interactive format for guidance such as C‐Plan may be of<br />
more benefit in both bringing renewable <strong>energy</strong> developments forward, and ensuring they<br />
meet local requirements.<br />
7.6 Permitted Development<br />
‘We want to install a PV system on our roof, to go with the solar thermal<br />
collector installed last year. But because we are just inside a conservation area ‐ though<br />
really part of an estate which is outside the area ‐ we have to apply for full planning<br />
permission, which costs £150 and eight weeks, plus the risk of refusal.’<br />
7.6.1 A Statutory Instrument on Permitted development rights ‐ the General Permitted<br />
Development Order (GPDO) was introduced on 6th April 2008 in England 135 , with the intention<br />
of simplifying the installation of renewable <strong>energy</strong> microgeneration technologies in most<br />
domestic situations. It meant that planning permission was no longer needed for a wide range<br />
132 John Thorp, Director, Thameswey Energy – Hearing 14 th April 2010<br />
133 Simon Cole, Senior Planning Officer, Ashford Borough <strong>Council</strong> – Hearing 1 st June 2010<br />
134 <strong>Kent</strong> <strong>County</strong> <strong>Council</strong>, 2009 <strong>Kent</strong> Design Guide: Sustainable Construction Technical Appendix<br />
135 12 th March 2009 in Scotland<br />
82
of technologies, but within certain limits. 136 However, it was apparent from evidence received<br />
by the Select Committee that exceptions and omissions in the GDPO lead to confusion for<br />
people wishing to install technologies if they live in or close to a conservation area, or in a listed<br />
building. The technologies currently having Permitted Development status in England (and the<br />
exceptions) are shown below.<br />
Solar PV and solar thermal ‐ roof mounted: PERMITTED except where panels protrude<br />
more then 200mm when installed.<br />
Solar PV and solar thermal ‐ stand alone: PERMITTED up to 4m in height, minimum 5m<br />
from boundary, up to 9m 2 but NOT on a wall within the ‘curtilage of the dwelling house’<br />
which could be seen from the highway in a Conservation Area or World Heritage Site.<br />
Wood burning boilers and stoves, and CHP: PERMITTED (if the flue is less than 1m<br />
higher than the roof height), but NOT if it can be seen from the road in a Conservation<br />
Area or World Heritage Site.<br />
Ground source heat pumps: PERMITTED<br />
Water source heat pumps: PERMITTED<br />
Micro and small wind: (not covered, but expected to be allowable except in<br />
conservation areas)<br />
Air source heat pumps: (not covered, but expected to be allowable)<br />
7.7 Exceptions to permitted development<br />
7.7.1 As can be seen from the information above, there are a small number of<br />
technical/safety elements to the restrictions and the others related to aesthetic factors,<br />
particularly with regard to listed buildings (to which different building regulations apply) and<br />
conservation areas. With respect to Listed Buildings and Conservation Areas, there is a need to<br />
balance preservation of the local environment with the wish to enable residents to benefit<br />
from solar powered systems, in particular. For example, Listed Building and Conservation Area<br />
Consent is only granted where panels are not considered to detract from the character or<br />
appearance of the listed building or conservation area. However, the Select Committee would<br />
like the benefit to the wider environment of renewable <strong>energy</strong> systems to be given weight in<br />
such decisions except in very exceptional circumstances.<br />
136 In addition, different building regulations apply to Listed Buildings.<br />
83
7.8 <strong>Kent</strong> Downs Area of Outstanding Natural Beauty (AONB)<br />
7.8.1 The Select Committee learned that the <strong>Kent</strong> Downs AONB ‘usually oppose the use of<br />
wind turbines within and within sight of the AONB’, however work undertaken for them would<br />
indicate that mid‐sized turbines (between 10kW/25m in height to blade tip and 500kW/65m to<br />
tip) could in some cases be appropriate. 137<br />
7.8.2 <strong>Kent</strong> Downs AONB covers a quarter of the county and part of the High Weald AONB is<br />
also in <strong>Kent</strong>, so a significant proportion of the county is exempt from permitted development<br />
and Nick Johannsen, Director, informed the Select Committee that the Local Development<br />
Frameworks of all <strong>Kent</strong> Districts who fall within the designated area ‘must have regard to the<br />
purpose of the AONB’ which is primarily to conserve the natural beauty of the environment.<br />
7.8.3 While <strong>energy</strong> security is not a driver for the AONB, renewable <strong>energy</strong> is seen as an<br />
important aspect of climate change mitigation and a detailed assessment of the suitability of all<br />
types of technology within the protected areas, was undertaken on their behalf. Each<br />
technology was assessed for its appropriateness, noting constraints and opportunities and<br />
graded in traffic light format. The outcome is summarised on the next page and it can be seen<br />
that the majority of renewable technologies are felt to be suitable; small to medium scale wind<br />
turbines and large scale biomass may be suitable in some cases and the only technologies that<br />
are felt not to be in keeping with the purpose of the AONB are wind turbines a the extremes of<br />
the size‐spectrum, i.e. micro and large scale.<br />
137 Nick Johannsen, Director, <strong>Kent</strong> Downs Area of Outstanding Natural Beauty (AONB) – written evidence<br />
84
Figure 14: <strong>Kent</strong> Downs AONB – Appropriateness of <strong>Renewable</strong> Technologies 138<br />
LARGE SCALE WIND TURBINES<br />
(between 500kW/65m in height to blade tip and 3MW/125m to tip)<br />
RED<br />
SMALL ‐ MEDIUM SCALE WIND TURBINES<br />
(between 10kW/25m in height to blade tip and 500kW/65m to tip)<br />
AMBER<br />
MICRO WIND TURBINES<br />
(between 50W and 6kW and up to 20m to blade tip)<br />
RED<br />
GROUND SOURCE HEAT PUMPS<br />
SOLAR THERMAL (HOT WATER)<br />
SOLAR PV (ELECTRICITY)<br />
MICRO HYDRO<br />
(Power rating of 100kW or less, producing 100 standard units of electricity/hr)<br />
GREEN<br />
GREEN<br />
GREEN<br />
GREEN<br />
LARGE SCALE BIOMASS<br />
(typically 10‐40MW electricity or 5‐30MW Thermal CHP)<br />
AMBER<br />
MEDIUM SCALE BIOMASS<br />
(C. 100kw)<br />
GREEN<br />
SMALL SCALE (DOMESTIC) BIOMASS<br />
(C. 6‐12 kw stove or 15kw boiler)<br />
GREEN<br />
ANAEROBIC DIGESTION<br />
GREEN<br />
138 <strong>Kent</strong> Downs AONB, 2008 Climate Change Mitigation: <strong>Renewable</strong> Energy Technologies and Protected<br />
Landscapes, Identification of Key Constraints and Opportunities for <strong>Renewable</strong> Energy within The <strong>Kent</strong> Downs<br />
AONB. Internal Report<br />
85
RECOMMENDATION 14<br />
That KCC lobbies government, on planning issues, to:<br />
promote developments with a mixed heat demand suitable for district heating<br />
systems, which should be incorporated wherever possible.<br />
relax planning control for domestic renewable <strong>energy</strong> installations on listed buildings<br />
and properties affecting conservations areas where this does not detract from<br />
heritage objectives.<br />
RECOMMENDATION 15<br />
That KCC consults with District, Borough and other councils in <strong>Kent</strong> to determine what is<br />
needed to assist local authority planners and developers in making planning decisions<br />
relating to renewable <strong>energy</strong> applications, e.g. training, or an interactive planning tool.<br />
86
8 ELECTRICITY TRANSMISSION, DISTRIBUTION AND STORAGE<br />
8.1 National electricity transmission<br />
8.1.1 It is important to state at the outset, that the national electricity transmission grid<br />
system is not itself an electricity storage system. We have, over the years, come to take for<br />
granted that we can turn on a switch, and power will be there but that ‘luxury’ is in part due to<br />
the expertise and skill of grid managers who constantly balance the power being taken out of<br />
the grid, with that being put in as electricity is consumed at the same time as it is generated.<br />
8.1.2 The national grid system was established in the 1930’s and links main generating sites<br />
to areas where demand is greatest, connecting to the distribution network. The electricity<br />
network was privatised under the Electricity Act 1989 and as a result a number of <strong>energy</strong><br />
companies own and are licensed to operate the system in different areas 139 . It can be seen<br />
from Figure 15 below that at the time of gathering evidence, EDF Energy Networks were the<br />
Distribution Network Operator (DNO) for <strong>Kent</strong> and EDF informed the Select Committee that in<br />
total they cover an area of 29,165 km2, have 7.9 million end customers (2.2 million in <strong>Kent</strong>);<br />
with 125,300 km of underground network (30% of which is in <strong>Kent</strong>) and 47.647 km of<br />
overground network (27% of which is in <strong>Kent</strong>). 140 At the time of writing, however, an<br />
announcement has been made that the infrastructure part of EDF’s business (cabling and<br />
substations) will be taken over by Hong Kong businessman Li Ka‐Shing who has a large portfolio<br />
of business interests in the UK and elsewhere.<br />
Figure 15: Distribution Network Operators<br />
139 Electricity is supplied by numerous, not necessarily <strong>energy</strong>, companies on a competitive basis.<br />
140 EDF Energy Networks: ‘Keeping the Lights On’ Protect <strong>Kent</strong> Energy Conference presentation<br />
87
8.1.3 The grid system is well‐established but ageing, and the need for grid maintenance has<br />
inevitably increased. The development of renewables means that the system will require<br />
expansion and modernisation, however the Select Committee learned that network operators<br />
are confident they are able to meet the necessary infrastructure requirements. 141<br />
8.1.4 One of the key challenges to planning infrastructure is a clear understanding of required<br />
capacity given that in future, due to the development of renewable <strong>energy</strong> and the increase in<br />
distributed generation, rather than being a passive, one‐way system, the grid distribution<br />
network will become an active system capable of receiving electricity generated at numerous<br />
locations. Developments in electricity storage (including the planned increase in the number of<br />
electric vehicles, whose charged batteries will constitute storage) will mean that the process of<br />
expertly balancing supply and demand to the grid which has served us well over a number of<br />
years, will meet with new and complex challenges.<br />
8.1.5 In order that distributed generation can take place, enabling technologies such as ‘smart<br />
grids’ and ‘smart metering’ are two major developments that will be needed. The Feed‐in tariff<br />
support system requires, for example, a record of how much electricity is imported from the<br />
grid to a site, as well as how much is exported to it 142 , and a smart grid would employ a range<br />
of technologies (including digital) at the interface to provide ‘intelligent control’ and<br />
monitoring. In 2008, the government announced its intention that all 26 million homes in the<br />
UK would be fitted with smart metering devices by 2020.<br />
8.2 Intermittency of renewable sources<br />
8.2.1 As noted above, the grid requires the balancing of supply and demand and so the<br />
intermittency of solar and wind power needs to be managed. Solar power is more predictable<br />
in that we know it’s not there at night and we have a good idea of the range of generation that<br />
can be expected at different times of the year. Wind power is much less predictable at a given<br />
site since wind power density is proportional to the square of the wind speed. The Select<br />
Committee were told that currently wind power provides 3% of total consumption and until a<br />
level of 20% is reached there is little need for additional storage as procedures are in place to<br />
deal with variable input 143 .<br />
8.2.2 This was the finding of UK Energy Research <strong>Council</strong> research, based on 200 international<br />
studies, into the intermittency of renewable <strong>energy</strong>. Regarding the variability of wind <strong>energy</strong>,<br />
141 EDF Energy Networks – supplementary evidence<br />
142 While the necessary developments are taking place, for the Feed‐in Tariff, export generation will be deemed at<br />
a rate equivalent to 50% of system capacity.<br />
143 Paul Reynolds, Offshore Wind Development Manager, <strong>Renewable</strong>UK – Hearing 26th May 2010<br />
88
they concluded that while this cannot replace fossil fuelled generating capacity on a 1:1 basis,<br />
‘it is unambiguously the case that wind <strong>energy</strong> can displace fossil fuel‐based generation,<br />
reducing both fuel use and carbon dioxide emissions’.<br />
8.2.3 None of the 200 studies found that adding intermittent sources to the current system<br />
would compromise the reliability of supply during that period. Loss of Load Probability (LOLP) is<br />
used to measure how likely it is that demand will not be met, and for a successful electricity<br />
system, LOLP must be small. Some of the effects of intermittency require a more refined<br />
measure as they might be, for example, small losses of load over short periods, but occurring<br />
more often.<br />
8.2.4 When the penetration of intermittent sources reaches 20% the question of back‐up<br />
generation (in relation to the whole electricity system – not individual generating sites)<br />
becomes important and at the 20% level, additional conventional capacity to maintain system<br />
reliability during demand peaks is 15% ‐ 22% of installed intermittent capacity, i.e 15‐22% of<br />
20% which is 3‐4.4% of total capacity.<br />
8.2.5 So at the level of 20% electricity generating capacity from wind power, 3‐4.4%<br />
additional conventional generating capacity would be required, to maintain system reliability<br />
during peak demands. One of the main findings of the <strong>report</strong> is that the cost of renewable<br />
<strong>energy</strong> is not greatly affected by these factors.<br />
8.3 Managing demand<br />
‘UK company receives £4m investment for global expansion of online smart meters.’ 144<br />
8.3.1 It is intended that the grid system of the future, the ‘smart grid’ would be able to<br />
manage demand to an extent using a range of techniques such as switching power off (even<br />
down to individual appliances) to cope with troughs in electricity generation and while this<br />
sounds rather dramatic, it is really an extension of the concept of off‐peak electricity (such as<br />
Economy 7 being cheaper at night) so that appliances (including electric vehicles) could be<br />
used/charged on timers, which would become part of the smart grid management system. 145<br />
8.4 Managing supply<br />
8.4.1 Demand side management would not be enough to cope on its own and supply side<br />
solutions will also be needed.<br />
144 www.carbontrust.co.uk/news 25 June 2010<br />
145 EDF Energy Networks: ‘Keeping the Lights On’ Protect <strong>Kent</strong> Energy Conference presentation<br />
89
8.4.2 In Denmark, the intermittency of wind power is managed by using the hydroelectric<br />
plants in neighbouring countries as ‘storage’. Since most of the wind power is exported<br />
anyway, when there is oversupply, the hydroelectric power (which is more constant) can be<br />
‘turned down’ and the hydroelectric power can be bought back when there is undersupply of<br />
wind power. 146<br />
8.4.3 A range of other potential storage solutions are possible, including pumped storage;<br />
using electric vehicles as emergency ‘batteries’ – taking a small proportion of each plugged‐in<br />
vehicles’ charge (e.g. 10 million cars x 2kWh = 20 GWh); and even having two grids, one for the<br />
intermittent sources, supplying power to sites where constant demand is not essential. 147<br />
8.5 European Super Grid<br />
8.5.1 Another of the ways in which Europe is proposing to deal with the intermittency of<br />
renewable <strong>energy</strong> is to build a ‘super grid’ joining large renewable <strong>energy</strong> generating sites<br />
throughout the North Sea region. In this way, it is anticipated that supply and demand can be<br />
balanced with, for example, surplus demand from offshore wind farms in Northern Europe (100<br />
GW are currently planned) and surplus demand from solar arrays in Southern Europe balancing<br />
demand elsewhere. This is made feasible by new cabling technology which greatly reduces<br />
losses in transmission. 148 Building such a grid will be expensive to those countries concerned,<br />
but the future <strong>energy</strong> security of the region would be greatly enhanced and there would<br />
eventually be <strong>energy</strong> cost savings. The super grid would help the EU to achieve its 20/20/20<br />
goals: to increase renewable generation to 20%, cut greenhouse gas emissions by 20% at the<br />
same time as reducing <strong>energy</strong> use to 20% by 2020.<br />
8.5.2 The London Array, for example will feed into the Grid at Cleve Hill substation in <strong>Kent</strong><br />
and ultimately the existence of a super grid would enable excess power to be exported. High<br />
Voltage DC (HVDC) connections already exist between the national grid systems of the UK,<br />
France and a new connection to Netherlands is under construction. To date enough power for 3<br />
million homes has been imported via Cross‐Channel, a 73km 2000MW HVDC connection<br />
between Sellindge in <strong>Kent</strong> and Bonningues‐lès‐Calais in France and soon the BritNed HVDC, a<br />
new 260km, 1000MW connection linking the Isle of Grain and Maasvlakte, near Rotterdam will<br />
also be part of the new European grid system used to balance supply and demand in those<br />
countries 149 .<br />
146 MacKay, D.J.C. (2009) Sustainability without the hot air<br />
147 Ibid<br />
148 Jane Ollis, Head of Sustainable Business, Business Support <strong>Kent</strong> – Hearing 26 th May 2010<br />
149 Mark Willingale, Director, Metrotidal MB – written evidence<br />
90
8.5.3 Mark Willingale, Director of Metrotidal MB explained in his evidence to the Select<br />
Committee that this situation parallels that of the UK in the 1920’s when the national grid<br />
system we are familiar with joined together several individual power plants providing local<br />
supplies. As happened then, the most efficient (and now the most low‐carbon) sources of<br />
<strong>energy</strong> can be used to meet demand across a wider area.<br />
8.5.4 Members of the committee believe that in time, innovations will come forward and<br />
technological solutions will be put in place to cope with peak demand and balance intermittent<br />
renewable electricity sources sufficiently to avoid power cuts. However, they are concerned<br />
that, until this stage is reached, and to retain a level of national supply security, we cannot<br />
afford to lose significant capacity in conventional power generation, which is capable of being<br />
switched on and off to provide back up when necessary to meet demand.<br />
RECOMMENDATION 19<br />
That, in view of the need for the UK to have a long term, sustainable mix of power supplies<br />
and due to the intermittent nature of some renewable <strong>energy</strong> sources, KCC presses for the<br />
provision of new generation low carbon power stations so that there is adequate back up<br />
capacity to cope with demand peaks, providing security of supply.<br />
91
THIS PAGE IS INTENTIONALLY BLANK<br />
92
9 LOW‐CARBON TRANSPORT<br />
‘for the majority of people, electric vehicles are the winning solution’ 150<br />
9.1 Policies and targets for renewable transport <strong>energy</strong><br />
9.1.1 Government transport policy now focuses on the move away from liquid fossil fuels,<br />
which will become decreasingly available, and decarbonisation to reduce pollution. However<br />
transport has limited solutions, particularly due to the decreasing amount of arable land<br />
available for <strong>energy</strong> production as the population rises, and so eventually rationing or pricing<br />
solutions could be needed.<br />
9.1.2 The UK target of 15% <strong>energy</strong> from renewables will require 10% of transport <strong>energy</strong> to<br />
come from renewable sources. It is accepted that decarbonisation of air transport is ‘the<br />
hardest nut to crack’ and that road transport has to bear the brunt.<br />
9.2 Transport planning<br />
9.2.1 Globally, transport planning focuses on cities, since this is where 50% of the world<br />
population lives, and solutions for individual cities are dependent upon their population<br />
density. Public transport solutions are appropriate for the 6% of the world’s population who<br />
live in mega cities, but for the majority of people living in small towns and cities, tackling<br />
private car use is the key to carbon emissions reduction. 151<br />
9.3 The King Review<br />
9.3.1 In 2008 Julia King of Aston University conducted an in depth review into low‐carbon<br />
transport. 152 The review found that UK <strong>energy</strong> for transport had increased by 64% over the<br />
period from 1980 to 2004, largely due to the increase in road traffic which rose by 83% 153 , but<br />
remained optimistic about the decarbonisation of UK transport by 80%, forty years from now.<br />
The King Review concluded that in the short term, the focus should be on increasing vehicle<br />
efficiency and eventually, a combination of reduced vehicle emissions; cleaner fuels, consumer<br />
choices, research and development would help us to achieve targets for transport<br />
sustainability.<br />
150 Robin Haycock, Arup – Hearing 1 st June 2010<br />
151 Ibid<br />
152 The King Review ‐ http://webarchive.nationalarchives.gov.uk/+/http:/www.hmtreasury.gov.uk/d/bud08_king_1080.pdf<br />
153 Dr Howard Lee, Lecturer and Sustainability Champion, Hadlow College – oral evidence<br />
93
9.3.2 The review identified a number of key factors to ensure success including:<br />
‘bringing existing low emission technologies from ‘the shelf to the showroom’ as quickly<br />
as possible;<br />
ensuring a market for these low emission vehicles;<br />
moving the short‐term focus back from biofuels to automotive technology;<br />
making sure that further biofuel developments are based on our growing understanding<br />
of their indirect effects<br />
9.3.3 The King Review also found that ‘business as usual’ is not an option since it would lead<br />
to a doubling of emissions from transport globally by 2050.<br />
9.4 <strong>Renewable</strong> Transport Fuels<br />
9.4.1 An increasing proportion of the transport fuel routinely bought at the pump is<br />
renewable due to the <strong>Renewable</strong> Transport Fuels Obligation (RTFO) which obliges the suppliers<br />
of fossil fuels for road transport to ensure an increasing percentage comes from sustainable<br />
renewable sources. The RTFO (Amendment) Order 2009 sets out that from April 2008 the<br />
percentage required rises in yearly increments from 2.6% of volume to 5.3% from April 2013<br />
onwards. Prior to its introduction, contracts were issued in England under the Non Fossil Fuel<br />
Obligation (NFFO) which has now ended (but with some contracts still running to 2019).<br />
9.4.2 The requirement is met by adding blends of biofuels which, the Select Committee<br />
learned had provided farmers and growers with new business opportunities. Dr Jonathan<br />
Scurlock, of the National Farmers Union explained that previously, best quality wheat or oilseed<br />
rape would go into food products, the next quality would go into animal feed and the poorest<br />
quality would be used industrially to make starch. However, with the obligation for renewable<br />
transport fuels, in Dr Scurlock’s view, new investment is now needed for large facilities to<br />
convert wheat to ethanol and there are currently only three in the country, two of which are in<br />
the North East.<br />
9.5 Biofuels and <strong>Kent</strong><br />
9.5.1 A project run by the University of Greenwich in 2007‐9 looking at biofuels in <strong>Kent</strong> had<br />
two transport‐fuel‐related outcomes which were that:<br />
There is scope to use waste oils to manufacture biodiesel, albeit limited and small‐scale<br />
and<br />
the use of biofuels in internal combustion vehicle engines is only 25‐30% compared with<br />
up to 85% fuel use efficiency in combined heat and power (CHP) stationary engines.<br />
94
9.5.2 KCC, who were involved with the project, decided not to pursue plans to investigate<br />
opportunities for <strong>Kent</strong> Fleet vehicles to convert. The Select Committee was also told that<br />
following an experiment involving biofuel buses in Maidstone, bus companies are no longer<br />
pursuing biofuels trials. 154<br />
9.6 Food versus Fuel<br />
9.6.1 Members of the Select Committee were convinced by the arguments put forward<br />
against the large scale growing of biofuel crops in the UK, over the long term. The switch of<br />
emphasis away from biofuels, in the King Review, was made in the light of controversy over<br />
imported biofuels such as biodiesel from palm oil and bioethanol from maize and sugar cane<br />
which were shown to have contributed to the destruction of rainforests and threats to<br />
biodiversity. Ultimately, it is not viable to take up large swathes of arable land for growing<br />
biofuel crops, as land is needed for food production, both here and abroad, to sustain a<br />
growing world population.<br />
9.6.2 Currently, the UK is able to meet only around one third of domestic food requirements<br />
and though, for example, we can produce 100% of the wheat we need, this is dependent on<br />
high inputs from fossil‐fuel based fertilisers whose long‐term availability cannot be guaranteed.<br />
Farmers wish to benefit from the opportunities that exist but, for example, solar arrays on the<br />
roofs of farm buildings could provide a significant income as an alternative to growing <strong>energy</strong><br />
crops.<br />
9.6.3 In the shorter term there is some potential in <strong>Kent</strong> for growing oil seed rape for<br />
biodiesel (and the Select Committee heard that this had previously been ‘tried’ in <strong>Kent</strong>), but the<br />
greater potential is for woody biomass (which does not compete with food crops) and this is<br />
dealt with in more detail in Section 4 on page 53 with regard to heat, rather than transport.<br />
9.6.4 Other impacts, as well as competition with food supply, need to be taken into account<br />
such as the amount of water, fertilizer, pesticide and <strong>energy</strong> inputs into the whole process of<br />
growing, harvesting and refining. The particular pressures on resources in different areas<br />
should also dictate which options are viable in different locations. In <strong>Kent</strong>, for example, any<br />
crop which was dependant on high water inputs would be much less desirable due to the<br />
increased pressure on the county’s water supply.<br />
9.7 Methane‐powered vehicles<br />
9.7.1 In the shorter term, there could be a contribution to the decarbonisation of transport<br />
from natural gas (c. 97% methane) or biogas which could replace a proportion of the petrol and<br />
diesel used for transport. (Although it is a very reactive greenhouse gas, methane is less<br />
154 John Newington, Senior Pollution Officer, Maidstone Borough <strong>Council</strong> – Hearing 1 st June 2010<br />
95
damaging if burned.) The technology for gas‐driven cars is already available and there are a<br />
number of advantages over petrol or diesel in that there are lower emissions, minimal<br />
particulates and switching to upgraded biogas is from there, an easy, renewable, zero carbon<br />
option. 155<br />
9.7.2 Anaerobic Digestion (see page 47) is one method of obtaining biogas, from waste<br />
organic matter (typically farm slurries or other homogenous wastes). The biogas can be burned<br />
in a gas engine to provide electricity (and heat) or scrubbed and either injected into the gas<br />
grid, or used for transport having been stored in the same way as liquid propane gas (LPG) in<br />
cylinders. 156<br />
9.7.3 The RE‐thinking <strong>report</strong> 2050, which presents a scenario for 100% renewable <strong>energy</strong> sees<br />
both biogas and biofuels as essential if we are to ‘end oil dependence in the transport sector’<br />
but from the evidence the Select Committee has seen, both biogas and liquid biofuels are far<br />
more efficient when used in stationary engines than as vehicle fuel so it would seem that in an<br />
<strong>energy</strong> constrained world, using them as transport fuels would not be the first choice.<br />
9.8 Automotive Technology<br />
9.8.1 UK companies are releasing a number of different vehicle types, both public and<br />
commercial, including fully electric and hybrid models. As mentioned, vehicles can run on<br />
biomethane and for example in Leeds, biomethane waste vehicles are being piloted 157 . The<br />
industry view, according to the Office for Low Emission Vehicles, is that between now and 2040<br />
there will be a gradual development in automotive technology, beginning with continued<br />
reductions in vehicle weight and drag and innovations in internal combustion<br />
engines/transmission for vehicles using a range of fuel types: petrol, diesel, gas, renewable<br />
fuels and hydrogen.<br />
9.8.2 A gradual progression of hybrid cars is expected until developments in storage (for<br />
hydrogen and for electricity) lead to a full plug‐in hybrid vehicle anticipated in around 2020. By<br />
then, a considerable amount of investment will have to have been made in national<br />
infrastructure for both EV charging and hydrogen fuel cell vehicles.<br />
9.8.3 For 2020, European legislation being debated is for a limit of 95g per km CO 2 vehicle<br />
emissions. While this seems a stretching target, when the 2010 aim for 130g was proposed, it<br />
did not take long for cars with less than 120g emissions to emerge. 158<br />
155 Steve Plater, Transition Town Sevenoaks – Hearing 19 th May 2010<br />
156 Dr Howard Lee, Lecturer and Sustainability Champion, Hadlow College – Hearing 12 th May 2010<br />
157 John Newington, Senior Pollution Officer, Maidstone Borough <strong>Council</strong> – Hearing 1 st June 2010<br />
158 Robin Haycock, Arup – Hearing 1 st June 2010 (uncorrected evidence)<br />
96
9.8.4 It was the view of Mr Haycock that until 2020, vehicle efficiency will be the main factor<br />
influencing the decarbonisation of road transport but at that point he felt that electric vehicles<br />
would come to the fore and the balancing between electric vehicles (EVs) and peak use of the<br />
grid, would be key.<br />
9.9 Decarbonisation of electricity<br />
9.9.1 Figure 16 below shows that while electricity generation must rise by around 50% over<br />
the next 40 years due to the electrification of transport and heat, the ‘carbon impact’ of that<br />
electricity will fall dramatically over that same period due to the proportion of it that is<br />
generated renewably.<br />
Figure 16: Decarbonisation of electricity 159<br />
9.9.2 The Select Committee learned that that most of the <strong>energy</strong> requirement of a car is during<br />
its use rather than its manufacture so this means that fleets of electric vehicles would<br />
automatically be decarbonised, along with the electricity supply. 160<br />
9.10 <strong>Kent</strong> <strong>energy</strong> consumption from transport<br />
9.10.1 Government figures for <strong>energy</strong> consumption from transport in <strong>Kent</strong> in 2007 were<br />
15,238.3 GWh so reaching the 10% figure would involve 1,523.8 GWh to be from renewable<br />
sources. However, while most future scenarios for transport involve the electrification of all but<br />
the heaviest vehicles, the fine details for the interim period will be dependent on a number of<br />
factors and the relative speed of technological developments.<br />
159 E.on: ‘Keeping the Lights On’ Protect <strong>Kent</strong> Energy Conference presentation<br />
160 Robin Haycock, Arup – Hearing 1 st June 2010 (uncorrected evidence)<br />
97
9.11 <strong>Kent</strong> Integrated Transport Strategy<br />
9.11.1 <strong>Kent</strong>’s Growth without Gridlock Integrated Transport Strategy 161 , which was <strong>final</strong>ised<br />
after consultation last year, will inform the statutory Local Transport Plan 3, (LTP3) that KCC as<br />
Transport Authority is required to produce by March 2011. It will also guide transport plans<br />
within each of the <strong>Kent</strong> Districts’ and Borough’s Local Development Frameworks.<br />
9.11.2 The Select Committee learned that work between KCC and Maidstone Borough <strong>Council</strong><br />
in this regard had the challenge of evolving measures which would meet statutory<br />
requirements (including those for improvement of air quality), support the growth of the area<br />
and sustainability aims, but within the current financial constraints on the public and private<br />
sector. In this respect, Maidstone is a transport hub for <strong>Kent</strong>, and so solutions will inform the<br />
plans made by other districts and boroughs in the county. 162<br />
9.12 Air Quality and transport<br />
9.12.1 Air quality is a huge issue for local authorities, who are required to meet European<br />
objectives for Nitrogen Oxides and particulates and the UK faces fines of £300 million per<br />
annum if it fails to achieve them. District authorities have air quality management areas (where<br />
limits are exceeded) and data from 2006 showed that 20 of the 22 cases in <strong>Kent</strong> were linked to<br />
transport emissions which in turn have major implications for the health of residents as well as<br />
to local authorities’ own carbon emissions targets. 163<br />
9.13 Electric Vehicles<br />
9.13.1 An increase in the number of electric vehicles (EVs) is one of the ways in which air<br />
quality objectives can be met but as noted earlier, it will be essential that this takes place<br />
alongside an increase in the proportion of electricity that is generated from renewable sources.<br />
9.13.2 By 2020 it is expected that the number of electric vehicles in the UK will have risen from<br />
around 8000 to 1.7 million. The Mayor of London intends to make London the ‘electric car<br />
capital of Europe’ and to procure 1000 EVs for the Greater London Authority fleet by 2015,<br />
putting in 7,500 charging points by 2013. From next year a Plugged in Car Grant will be<br />
available with up to £5000 available to incentivise the purchase of ultra low carbon cars, to<br />
mitigate their current high cost, and in support of the Plugged in Places initiative which will<br />
create a network centred on London and extending initially via Milton Keynes to the North East.<br />
161 http://www.kent.gov.uk/static/transport/integrated‐transport‐strategy.pdf<br />
162 Peter Rosevear, Senior Transportation Engineer, <strong>Kent</strong> Highway Services – written evidence<br />
163 John Newington, Senior Pollution Officer – Maidstone Borough <strong>Council</strong> – Hearing 1 st June 2010<br />
98
9.13.3 The Select Committee learned of plans to begin putting in place in Maidstone a small<br />
number of EV charging points, with (it is hoped) funding from the £20 million Infrastructure<br />
Grant, starting with a two‐bay charging point in Mote Park (as part of the park’s redevelopment<br />
scheme funded by a Heritage Lottery Grant) as well as exploring options for three more<br />
charging points, each with two bays, at Park and Ride sites. The cost for charging bays, from the<br />
evidence received, is around £5,000 ‐ £8000 and in the case of Mote Park the total cost is<br />
£7500 plus an annual maintenance fee of £300. The existence of such ‘visible’ schemes will be<br />
an important way of addressing initial public fears about EVs running out of electricity.<br />
9.13.4 Mr Robin Haycock from Arup, informed the Select Committee that in the longer term it<br />
is likely that there will be a combination of car charging at home and at work, coupled with a<br />
change in the way we use our cars, such as using range extended hybrid cars (perhaps hired)<br />
for long journeys. In the short term though, the acceptance of electric vehicles is more about<br />
social change, and so it will be necessary at first to have visible charging points, to reduce<br />
drivers’ anxiety.<br />
9.13.5 A number of organisations including supermarkets are considering how charging<br />
infrastructure might fit in with their own aims for increasing sustainability and the Select<br />
Committee also learned that, for example, Network Rail are considering how this may fit in<br />
with their programme of improvements to car parking arrangements at <strong>Kent</strong> stations.<br />
9.13.6 The new draft Planning Policy Statement, expected early next year, is also likely to<br />
include that electric and plug‐in hybrid vehicles should be encouraged through a planning<br />
requirement for charging points in new developments.<br />
9.13.7 Given <strong>Kent</strong>’s proximity to London, and the role that electric vehicles are likely to play in<br />
the decarbonisation of transport, the Select Committee are keen to explore ways to work with<br />
others, including organisations like Streetcar, who provide a pay‐as‐you‐go service with bases in<br />
<strong>Kent</strong>, to help increase awareness about electric vehicles in <strong>Kent</strong>, and raise people’s confidence<br />
to try the technology. The existence of a government website showing all the charging bays in<br />
the country will also play a role in this.<br />
RECOMMENDATION 20<br />
That KCC works with others, including District and Borough <strong>Council</strong>s, Network Rail and<br />
supermarkets, to assess the viability of establishing a network of public electric vehicle<br />
charging points in <strong>Kent</strong>.<br />
9.13.8 A number of KCC vehicles carry out journeys ideally suited to electric vehicles and it is<br />
the view of the Select Committee that the council should be ready to use the technology when<br />
it becomes feasible to do so.<br />
99
RECOMMENDATION 21<br />
That KCC regularly surveys its own vehicles, and business journeys to: identify (and review)<br />
work patterns in order to minimise business mileage and to prepare for the availability and<br />
purchase of electric vehicles, where appropriate.<br />
9.14 Changing driver behaviour<br />
9.14.1 The South East Carbon Hub will engage with 150 businesses to help them develop<br />
sustainable mobility strategies and as part of the programme, businesses will be offered onsite<br />
travel audits to help them achieve reductions in carbon emissions by reducing travel.<br />
9.14.2 KCC encourages its own workforce to contribute to achieving sustainable transport aims<br />
by choosing smarter working options such as teleconferencing, car sharing, flexible hours,<br />
working at home and teleworking. The new ‘Journeyshare’ scheme replaces <strong>Kent</strong> Car Share and<br />
provides a ‘matching’ service free of charge to users all over the county enabling them to cut<br />
down on car journeys, reduce pollution and save money. The Select Committee feel it is also<br />
important that Directorates closely monitor the logistics of business journeys.<br />
9.14.3 The <strong>Kent</strong> Freedom Pass has benefited children and families across <strong>Kent</strong> by providing<br />
‘free at the point of access’ bus travel to young people for their journeys to school and in the<br />
holidays, reducing the number of parental car journeys considerably.<br />
9.14.4 The Select Committee learned that there are two other aspects of behaviour change<br />
which would have a big impact on the decarbonisation of transport. Firstly, there is a need to<br />
address ‘distance travelled’ and to help drivers get over fears that electric vehicles will not<br />
meet their needs, when in fact most car journeys undertaken are around 20km. Tackling ‘range<br />
anxiety’ is seen as being a hurdle to overcome in terms of public perception, rather than the<br />
practicalities of vehicle use and this is backed up by studies that found that once people had<br />
tried out electric vehicles, they were keen to carry on driving them.<br />
9.14.5 Secondly, in the period to 2020 when ‘efficiency’ is the more important factor, lowering<br />
driving speed could have a huge impact on fuel efficiency whichever vehicle type is driven.<br />
Since legislation to reduce speed limits would be universally unpopular (though, for example,<br />
lowering the national speed limit to 50 mph could cut carbon emissions from vehicles by 30%),<br />
the Select Committee feel that it is worth exploring the savings that could be achieved in the<br />
short term, if the county takes action with regard to the speed at which its own vehicles are<br />
driven. Taking action to influence both these aspects of behaviour change would also<br />
contribute strongly to the council’s community leadership role.<br />
RECOMMENDATION 22<br />
That KCC adopts a policy of limiting its vehicles, except those attending emergencies, to a<br />
maximum speed of 56mph (90kph) in order to achieve greater fuel efficiency, in line with<br />
100<br />
best commercial practice.
10 ECONOMIC OPPORTUNITIES FROM THE TRANSITION TO LOW CARBON ENERGY<br />
‘<strong>Kent</strong> is on the map for the offshore wind sector.’ 164<br />
10.1 National Strategy for Climate and Energy<br />
10.1.1 The UK Low Carbon Transition Plan: national strategy for climate and <strong>energy</strong>, plots the<br />
UK’s course in moving towards a low carbon economy from 2009 – 2020 and is concerned with<br />
‘cutting emissions, maintaining secure <strong>energy</strong> supplies, maximising economic opportunities, and<br />
protecting the most vulnerable’. The White Paper supports renewable <strong>energy</strong>, the testing of<br />
new technologies and sets standards to cut emissions from cars and other products. It outlines<br />
plans for the transition covering the <strong>energy</strong> sector; homes; workplaces; transport; farming, land<br />
and jobs. Also launched in 2009, The UK Low Carbon Industrial Strategy built upon earlier work<br />
highlighting the opportunities arising for businesses and individuals. 165<br />
10.1.2 The growth of low carbon sustainable and renewable <strong>energy</strong> industries is an essential<br />
component of government strategy to reduce environmental impact and strengthen the<br />
security of <strong>energy</strong> supply as well as to achieving the UK commitment to 15% <strong>energy</strong> generation<br />
from renewables by 2020.<br />
10.2 Economic Opportunities<br />
10.2.1 Growth of the sector is also seen as a key element in the future economic prosperity of<br />
the country: the global market for low‐carbon products and services is worth £3 trillion per<br />
year and rising, and in the UK will employ over a million people by 2015. In the South East, the<br />
renewable <strong>energy</strong> sector is expected to expand by £2‐4 billion over the next ten years. 166<br />
10.2.2 Development of the required infrastructure in the county will provide economic<br />
opportunities for both business and technology and the retrofitting of existing properties, an<br />
essential component in moving towards a low‐carbon economy in the county, will provide<br />
numerous opportunities to a wide range of businesses that can undertake insulation and other<br />
<strong>energy</strong> efficiency work, or supply and install micro‐generation technologies. Take up has<br />
already increased due to the Feed‐in tariff which incentivises renewable electricity generation<br />
up to 5MW and the <strong>Renewable</strong> Heat Incentive, due to take effect in April 2011, is likely to<br />
stimulate further activity. Businesses can also benefit by, for example, renting roofs from other<br />
164 Karl Jansa, Business Development Manager, Locate in <strong>Kent</strong> – written evidence<br />
165 Building Britain’s Future: New Industry, New Jobs; The Low Carbon Industrial Strategy: A Vision; and policies<br />
and plans outlined in Investing in a Low Carbon Britain.<br />
166 Tom Vosper, Head of Biomass Team, Creative Environmental Networks – written evidence<br />
101
people/organisations, installing their own technologies, or assisting others to create revenue<br />
streams.<br />
10.2.3 It should be acknowledged, however, that while net gains are expected in employment<br />
during the transition to a low‐carbon economy, there will be job losses but the impact of this<br />
can be lessened by taking action in advance, making use of transferrable skills and<br />
‘transforming businesses’. 167<br />
10.2.4 Having identified a gap in skills for the renewable <strong>energy</strong> sector, KCC’s 14‐24 Innovation<br />
Unit is working to develop Centres of Excellence in <strong>Kent</strong> informed by a wind‐<strong>energy</strong> related<br />
learning matrix. There are Skills Centres at Thanet and Swale and the latter ‘hub’ site will each<br />
year offer courses for 250 engineering students aged 14‐19 to include the choices of wind<br />
turbine installation and maintenance, specialist Health and Safety courses as well as waste<br />
management. The Centre will co‐ordinate with colleges, the provision of courses across the<br />
<strong>County</strong> and this, and other sector strategies will develop with input from businesses to ensure<br />
that skills gaps are addressed. 168<br />
10.2.5 In addition, KCC has worked with <strong>energy</strong> companies and colleges to facilitate the<br />
provision of short courses so that unemployed people competent in different aspects of work,<br />
such as marine, heights, confined spaces, as well as qualified electricians could acquire the<br />
other skills in the required ‘set’ and gain employment. In the future, KCC will be seeking to pilot<br />
apprenticeships leading to qualifications including those appropriate to working in the offshore<br />
wind industry. 169<br />
10.3 ‘Low Carbon Opportunities for Growth’<br />
10.3.1 KCC’s Report, Low Carbon Opportunities for growth builds on the UK Low Carbon<br />
Industrial Strategy 170 to identify how to maximise the benefits to <strong>Kent</strong> from growth of the<br />
sectors. It is vital that Small and Medium sized Enterprises (SMEs) and new businesses have the<br />
ability to fully understand and take advantage of the opportunities offered by the transition to<br />
low carbon and renewable <strong>energy</strong>, so that their business plans, forecasts and borrowing can be<br />
fully informed. It is equally important for investors to be confident that right infrastructure and<br />
planning policies are in place to allow development of renewables across the county, whether<br />
in new builds or through the retrofitting of existing properties. 171<br />
167 Ibid<br />
168 Dunn, S. and Styles, M. (2010) Developing Sector Based Skills Strategies. Internal Report<br />
169 Roger Gabriel, Employment and Skills Board Manager, <strong>Kent</strong> and Medway – Supplementary Evidence<br />
170 HM Government, 2009 The UK Low Carbon Industrial Strategy, London: BERR/DECC<br />
171 James Sweet, Commercial Director, C4Ci – written evidence<br />
102
10.4 Offshore wind development<br />
10.4.1 The Select Committee learned about the opportunities arising from large scale offshore<br />
wind farm development. <strong>Kent</strong> has benefited from £4.5 billion in capital investment to the<br />
offshore wind industry and there is a potential for a further £110 million per annum in<br />
operations and maintenance. The Carbon Trust estimate that there could be between 40,000<br />
and 70,000 jobs along the UK supply chain by 2020 172 by which time UK employees could<br />
account for half of wind farm service jobs globally. 173 These estimates are dependent on the<br />
success of the Phase 3 wind farms which have yet to gain the necessary agreement.<br />
10.4.2 In order for <strong>Kent</strong> and Medway to benefit from Phase 3, in addition to Ramsgate which is<br />
en route to becoming a base for Operations and Maintenance for the London Array and Thanet<br />
Offshore wind farms, and Whitstable, which is the established operations and maintenance<br />
base for the <strong>Kent</strong>ish Flats wind farm, considerably bigger sites will need to be identified,<br />
particularly for Tier 1 suppliers to the industry. 174<br />
10.4.3 RWE Npower <strong>Renewable</strong>s Ltd (RNRL), the UK subsidiary of RWE Innogy who develop<br />
and operate wind farms and other renewable electricity projects, informed the Select<br />
Committee that it would like to direct a large proportion of its €1.1 billion annual investment in<br />
renewables to the U.K. provided the regulatory framework is favourable. The risk of not<br />
creating the right planning and regulatory conditions, and of failing to identify appropriate sites<br />
in the county and in Medway will be ‘that <strong>Kent</strong> will miss out on a massive new industry sector<br />
which will create jobs.’ 175<br />
10.4.4 Wind farm development off the <strong>Kent</strong> coast is highlighted on the next page.<br />
172 (based on 29 GW of installed capacity)<br />
173 Global Climate Network (2009): Low‐Carbon Jobs in an Inter‐Connected World, London: GCN<br />
174 Karl Jansa, Business Development Manager, Locate in <strong>Kent</strong> – written evidence<br />
175 Ibid<br />
103
<strong>Kent</strong>ish Flats ‐ 90MW ‐ 30 turbines<br />
Built in 2005, <strong>Kent</strong>ish Flats wind farm has now been taken over by Vattenfall,<br />
It is located just outside the Thames shipping lanes, in shallows to the north<br />
of Herne Bay and Whitstable, on the North <strong>Kent</strong> coast. With an installed<br />
capacity of 90MW, it produces 280GWh electricity each year, supplying<br />
around 100,000 homes. The operation and maintenance base is at Whitstable<br />
Harbour.<br />
Thanet Offshore ‐ 300MW ‐ 100 turbines<br />
Thanet offshore wind farm, is being developed by Vattenfall and operated by<br />
Vesta, 12km from Foreness Point on the East <strong>Kent</strong> coast. It was completed on<br />
24 June 2010 and has 300MW installed capacity which will supply the<br />
electricity needs of around 240,000 homes.<br />
London Array ‐ 1000MW ‐ 271 turbines<br />
The London Array is being developed by a consortium of companies: Dong<br />
Energy, E.ON and Masdar. Located between the <strong>Kent</strong> and Essex coasts, in the<br />
outer Thames Estuary, Phase 1 comprises 175 wind turbines with a capacity<br />
of 630MW. This is roughly equivalent to the electricity supply for 472,500<br />
homes and offsets emissions by 1.2 million tonnes of CO2 per year. Once<br />
completed, it will be the world’s largest offshore wind farm, with a<br />
generating capacity of up to 1000 MW of electricity, enough for 750,000<br />
homes (all those in <strong>Kent</strong> and East Sussex).<br />
104
10.5 <strong>Kent</strong> Wind Energy Directory<br />
10.5.1 The Select Committee learned that KCC has invested in an online directory to support<br />
local businesses in meeting the needs of offshore wind developers. 176<br />
The <strong>Kent</strong> Wind Energy Directory<br />
On 1 st July 2010 Backing <strong>Kent</strong> Business 1 , in collaboration with London Array and Marine South<br />
East, launched <strong>Kent</strong>wind<strong>energy</strong>.co.uk; an interactive online business directory (the first of its<br />
kind) dedicated to supporting the growth of the offshore wind industry around the <strong>Kent</strong> coast.<br />
The directory provides information about development of the offshore wind industry in the UK<br />
and will enable businesses involved in the supply chain to plan for forthcoming opportunities,<br />
register their capability, and bid for contracts. Wind farm developers will have the benefit of a<br />
simple‐to‐use search facility, enabling them to identify companies who have the right skills and<br />
expertise to meet their requirements at every stage, from project development through to<br />
construction and operation.<br />
The online portal is designed to support <strong>Kent</strong> businesses, ensuring they can benefit from the<br />
wide range of opportunities as the industry develops.<br />
10.5.2 Jane Ollis, Business Support <strong>Kent</strong>, explained to the Select Committee that in order to<br />
support business in its response to a new challenge such as the opportunity provided by a<br />
switch to a low‐carbon economy, it is important to focus on the relatively small number of<br />
‘early adopters’ who are prepared to invest in new technology following the initial innovation,<br />
so that market creation can occur and suppliers are geared up to step into the market once the<br />
consumer demand is there.<br />
10.5.3 In addition to early adopters, there are also likely to be significant opportunities arising<br />
from low‐carbon industry development for tradesmen such as heating engineers, plumbers,<br />
builders, decorators, windows fitters and given that the pace of change is such that ‘every<br />
Londoner is going to be in 1 mile’s reach of an electric charging point within 5 years’,<br />
presumably electricians too.<br />
10.5.4 With regard to the supply chain for microgeneration the Select Committee learned that<br />
in <strong>Kent</strong> we are fortunate to have quite good capacity and this is due in part to the work of<br />
Creative Environmental Networks (CEN) who have been promoting renewables in <strong>Kent</strong> for<br />
some time through their own microgeneration supply chain network. 177 The introduction of the<br />
176 Neil Hilkene, Sustainability Manager – supplementary evidence<br />
177 Tom Vosper, Head of Biomass Team, Creative Environmental Networks – written evidence<br />
105
Feed‐in Tariff means that further development of the supply chain in this sector of the market<br />
will be necessary and will create opportunities for further jobs in the county.<br />
10.6 Microgeneration Certification Scheme Accreditation<br />
10.6.1 Both the Feed‐in Tariff and <strong>Renewable</strong> Heat Incentives will require small scale schemes<br />
to be installed by companies accredited to Microgeneration Certification Scheme (MCS)<br />
standards. For the Feed‐in Tariff, this applies to installations up to 50kW capacity (except in the<br />
case of anaerobic digestion where MCS accreditation is not required). For larger schemes of<br />
between 50kW and 5MW (and anaerobic digestion up to 5MW), generators can obtain<br />
accreditation through the ROO‐FIT process operated by Ofgem; an online registration scheme<br />
for renewable and Combined Heat and Power (CHP) generators which also facilitates the<br />
exchange of traded certificates and <strong>Renewable</strong> Electricity Guarantees of Origin.<br />
10.6.2 According to the Energy Saving Trust, at June 2010 there were 100 accredited MCS<br />
installers in the South East listed below according to the technology they specialise in:<br />
Biomass ‐ 6<br />
Heat pumps ‐ 30<br />
Hydro ‐ 1<br />
Solar PV ‐ 49<br />
Solar thermal ‐ 66<br />
Wind turbines – 9<br />
10.6.3 Following the introduction of the RHI next year, there may prove to be insufficient<br />
capacity of ‘installers, designers and architects’ for biomass, heat pumps and solar, and<br />
accreditation schemes for both equipment and installers may themselves need to be<br />
strengthened. 178<br />
10.7 Industry confidence<br />
10.7.1 Apart from the significant investment attracted to <strong>Kent</strong> by the development of offshore<br />
wind, the Select Committee learned that across the UK at least 13,000 jobs in the farming<br />
industry are expected to be dependent on the development of renewable <strong>energy</strong>; supported by<br />
income from on‐farm anaerobic digesters, small scale on farm generation, ground rents and<br />
electricity sales from wind farms plus the supply of biomass feedstocks. 179<br />
178 William White, SE Regional Director, National Farmer’s Union – written evidence<br />
179 Ibid<br />
106
10.7.2 To attract investors to <strong>Kent</strong>, it is vital that industry confidence is gained and that sites<br />
are identified for the types of scheme that are needed. The Select Committee were told that,<br />
for example, ‘every farmer should have the opportunity to become a net exporter of low‐carbon<br />
<strong>energy</strong> services’ but it is currently the case that few if any farmers in <strong>Kent</strong> have managed to<br />
participate in the way they would like and most are still reliant on fossil fuels for their own<br />
operation, hampered by such things as planning difficulties, grid connection charges and<br />
environmental regulation.<br />
10.7.3 Apart from being ideally placed to produce transport biofuels; wood, straw and <strong>energy</strong><br />
crops for electricity and heat, and anaerobic digestion for biogas; it is the view of the National<br />
Farmers Union that there is great potential to attract investment to <strong>Kent</strong> since agricultural<br />
buildings and land are well‐suited for the siting of solar PV technology, wind power and ground<br />
source heat. The different grades of land that are available mean that: ‘renewable <strong>energy</strong> can<br />
be embedded in the agricultural sector without any possibility of perceived conflict with the<br />
industry’s traditional role in food production’. 180 Furthermore, there is similarly an opportunity<br />
for the siting of solar PV technology on other commercial buildings, particularly those with<br />
large roofscapes across the county.<br />
RECOMMENDATION 1<br />
That KCC works with <strong>Kent</strong> District and Borough <strong>Council</strong>s and others to agree a Low Carbon<br />
and <strong>Renewable</strong> Energy Strategy for <strong>Kent</strong> to enable the uptake of the most appropriate low<br />
carbon technologies.<br />
RECOMMENDATION 2<br />
That a Member Champion for Low‐Carbon and <strong>Renewable</strong> Energy is appointed to promote<br />
the implementation of the Strategy and <strong>report</strong> back to Cabinet and the Cabinet Climate<br />
Change Working Group on progress.<br />
RECOMMENDATION 5<br />
That KCC capitalises on opportunities in its own estate, and works with local authorities,<br />
<strong>energy</strong> network companies, landowners and prospective investors to ensure that a proactive<br />
approach is taken to the identification of sites for renewable <strong>energy</strong> schemes in the county,<br />
in order to encourage and enable investment.<br />
180 William White, SE Regional Director, National Farmer’s Union – written evidence<br />
107
10.8 Sustainable Business Programme<br />
10.8.1 As well as providing support for businesses directly involved in the low‐carbon sector, a<br />
number of KCC workstreams provide support to SMEs to increase their sustainability since the<br />
environmental credentials of companies are important to customers. Having developed over a<br />
number of years, the KCC/Environment Agency (EA) Sustainable Business Programme works to<br />
influence businesses in <strong>Kent</strong>, decrease their impact on the environment and save them money.<br />
The main aspect of the programme is a free‐to‐business review service whereby an EA adviser<br />
audits businesses and provides advice on <strong>energy</strong>, water and waste.<br />
10.8.2 Reductions in carbon emissions and costs savings are achieved through take up of<br />
advice on efficiencies, as well as on transport issues. With around 30% of advice being followed<br />
up, there are demonstrable savings equating to an average of £1800 per annum for each<br />
business (6 tonnes of carbon per year) 181 .<br />
10.9 Low Carbon Futures Project<br />
10.9.1 Through its Low Carbon Futures Project, which is funded by the South East Regional<br />
Development Fund Competitiveness Programme and runs from 2007 – 2013, KCC is supporting<br />
small and medium sized enterprises in all sectors to address their carbon footprint and to<br />
improve their environmental credentials by working towards accreditation. 182 With further<br />
funding from the private or public sector, the project hopes to influence businesses beyond the<br />
lifetime of the project ensuring that reductions in carbon emissions are achieved throughout<br />
the South East.<br />
10.9.2 The project relates to National Indicators on carbon emissions reduction NI185 (KCC’s<br />
own estate) and NI186 (<strong>Kent</strong>‐wide) and to the strategic aims of adopting resource‐efficient<br />
business practices as well as sustainable consumption practices. The project is being delivered<br />
by KCC with support from Business Support <strong>Kent</strong>, the Environment Agency, <strong>Kent</strong> fire and<br />
Rescue, <strong>Kent</strong> Police and The Carbon Hub. The four elements of the project are sustainable<br />
transport (covered in the next section), accreditation, providing a service which could be<br />
replicated elsewhere, and the South East Business Carbon Hub, a website created by The<br />
Carbon Hub Limited; developed and tailored in conjunction with KCC. Key elements of the<br />
project are highlighted on the next page.<br />
181 Alex Green, Sustainable Business Manager – supplementary evidence<br />
182 Information provided by Viviane Walker, Carbon Hub Adviser and Jennie Colville – Low Carbon Futures Project<br />
Manager<br />
108
The South East Business Carbon Hub<br />
What – An online resource for businesses that allows them to measure their carbon footprint<br />
(including <strong>energy</strong>, water, waste, and transport); create action plans to reduce carbon emissions<br />
and costs; work towards implementing an environmental management system (EMS);<br />
communicate with other businesses and access resources in relation to sustainable business.<br />
Website https://southeastbusiness.carbon‐hub.com<br />
How ‐ Businesses can apply or be invited to the hub. Following checks for eligibility (SME based<br />
in the South East) the organisation can feature on the site. Service support will be provided via<br />
online seminars and by the Carbon Hub Adviser.<br />
When – The site is live with more than 70 businesses registered on a trial basis. After further<br />
development, more businesses are now being encouraged to sign up and the Hub aims to help<br />
1000 businesses by 2013.<br />
Why ‐ Businesses seeking to implement an Environmental Management System (EMS) will find<br />
useful tools on the website. A sophisticated but simple <strong>report</strong>ing mechanism became available<br />
in June to enable businesses to monitor their own progress. Through the Hub, businesses will<br />
be enabled to respond to increased pressure from clients, stakeholders and legislation to take<br />
effective, practical action to measure and reduce their carbon emission. They will also benefit<br />
from lower operational costs from improved efficiencies.<br />
Accreditation<br />
By promoting an accreditation scheme (BS 8555 EMS), the Hub will enable businesses to be<br />
recognised for the environmental work they have undertaken and having better environmental<br />
credentials could give them a competitive edge and lead to new business. Companies can<br />
obtain environmental accreditation much more cheaply and easily by using the Carbon Hub. 183<br />
10.9.3 A key way for KCC to promote sustainable business would be through its own<br />
procurement of goods and services which is in the region of £860 million annually. This would<br />
also support <strong>Kent</strong> Environment Strategy Priority 4 which is to reduce the ecological footprint of<br />
what we consume.<br />
10.9.4 While acknowledging that suppliers have ‘many hoops to jump through’, the Select<br />
Committee believe that KCC should seek to support those companies who are being proactive<br />
about their own environmental impact and the importance of companies’ carbon footprints<br />
could be flagged up through the tendering process.<br />
183 Jane Ollis, Business Support <strong>Kent</strong> – oral evidence 26 th May 2010<br />
109
10.9.5 The National Farmers Union are also of the opinion that KCC could send a strong<br />
message of support by ‘leading by example’ with regard to sustainable procurement policies.<br />
RECOMMENDATION 13<br />
That, provided currently agreed procurement criteria are met, KCC considers giving<br />
preference, for the procurement of goods and services, to businesses who obtain<br />
accreditation through the South East Carbon Hub.<br />
10.10 <strong>Kent</strong> Excellence in Business Awards<br />
10.10.1 The Awards run across a range of categories as shown below:<br />
Best Business from the Creative Industries<br />
Best Business in Adult Social Care<br />
Best Leisure and Tourism Business<br />
Business Commitment to the Community Award<br />
Customer Service and Commitment Award<br />
Employer of the Year<br />
Entrepreneur of the Year<br />
Large Business of the Year<br />
Outstanding Contribution to the Business Community of <strong>Kent</strong><br />
SME Business of the Year<br />
Start Up Business of the Year<br />
Young Entrepreneur of the Year<br />
10.10.2 The Select Committee were interested to learn how the Awards could prompt<br />
businesses to take action on carbon reduction. It was the view of Jane Ollis, Business Support<br />
<strong>Kent</strong>, that the importance of carbon reduction across the board could be emphasised by having<br />
an additional question such as ‘what are you doing to reduce the carbon impact of your<br />
business?’ in every category. Organisations that enter for the <strong>Kent</strong> Excellence in Business<br />
Awards are automatically shortlisted into the <strong>Kent</strong> Environment Awards, so there is a strong<br />
link across, on the importance of taking action on <strong>energy</strong> efficiency.<br />
10.11 <strong>Kent</strong> Environment Awards<br />
10.11.1 The Environment Awards which have been taking place for 22 years, reward <strong>Kent</strong><br />
businesses who show corporate responsibility and excellent environmental performance. It is<br />
the view of Karl Jansa, Locate in <strong>Kent</strong>, that the awards have also highlighted how companies<br />
can save money by being <strong>energy</strong> efficient.<br />
110
11 CONCLUSIONS<br />
Satisfying <strong>Kent</strong>’s future <strong>energy</strong> demands will present both challenges and opportunities and it is<br />
important that we minimise any threats and take advantage of the real opportunities that exist.<br />
The Select Committee has little doubt that the people of <strong>Kent</strong> would like to see the<br />
environmental impact of <strong>energy</strong> production and use minimised and it is also clear that there<br />
are significant financial savings to be made. Failure to change will result in substantial<br />
additional costs to the council, and to the county as a whole. The case for change is therefore<br />
very strong and it is good sense to secure a successful transition to a low carbon future for<br />
<strong>Kent</strong>.<br />
111
THIS PAGE IS INTENTIONALLY BLANK<br />
112
Appendix 1: Glossary<br />
AD<br />
ASHP<br />
Biomass<br />
Biofuels<br />
CERT<br />
CHP<br />
CO 2<br />
CoP<br />
Coppicing<br />
CRC<br />
DCLG<br />
DEC<br />
DECC<br />
DH<br />
Distribution<br />
(electricity)<br />
Distributed Energy<br />
DNO<br />
Embedded (or<br />
embodied) <strong>energy</strong><br />
EPC<br />
ESCO<br />
EST<br />
FC<br />
FIT<br />
Fossil Fuel<br />
Gigawatt (GW)<br />
Gigawatt hour (GWh)<br />
GPDO<br />
GSHP<br />
Anaerobic Digestion<br />
Air Source Heat Pump<br />
Plant material and animal waste that can be used as fuel<br />
Synthetic fuels made from biomass commonly bio‐ethanol and biodiesel<br />
Carbon Emissions Reduction Target Funding<br />
Combined Heat and Power<br />
Carbon Dioxide<br />
Coefficient of Performance – measure of <strong>energy</strong> efficiency usually<br />
applied to heating and cooling devices<br />
Cutting trees close to the ground so that they produce several small<br />
shoots which can be harvested every few years and used for a<br />
variety of purposes including fuel.<br />
Carbon Reduction Commitment<br />
Department of Communities and Local Government<br />
Display Energy Certificate<br />
Department of Energy and Climate Change<br />
District Heating<br />
Local wiring from substations to customers.<br />
Heat and power generated and used locally<br />
Distribution Network Operator<br />
Energy used in manufacturing, packaging and supplying a product.<br />
Energy Performance Certificate<br />
Energy Services Company<br />
Energy Saving Trust<br />
Forestry Commission ‐ government department responsible for all<br />
forestry matters in England plus executive forestry functions<br />
throughout Great Britain.<br />
Feed‐in Tariff<br />
Ancient biomass (e.g. petroleum, coal, natural gas)<br />
Unit of power equivalent to 1 billion watts or 1000 megawatts<br />
Unit of <strong>energy</strong> equivalent to 1 hour of electricity consumed at a rate<br />
of 1 GW<br />
General Permitted Development Order<br />
Ground Source Heat Pump ‐ transfers heat from the ground to a<br />
building via a heat exchanger, for space heating and hot water. Can<br />
113
ha<br />
Joule<br />
kilowatt (kW)<br />
kWh<br />
LASER<br />
Load factor<br />
LCBP<br />
Megawatt (MW)<br />
Miscanthus<br />
Ofgem<br />
Peak Oil<br />
Retrofitting<br />
RHI<br />
RO<br />
ROCs<br />
SAP<br />
SME<br />
TOE<br />
Transmission<br />
(electricity)<br />
be used in reverse for cooling.<br />
hectare – unit of land measurement equal to 2.471 acres<br />
Unit of <strong>energy</strong><br />
Unit of power equivalent to 1000 watts<br />
Unit of <strong>energy</strong> equivalent to 1kW of power expended for one hour<br />
of time.<br />
Group within KCC Commercial Services responsible for <strong>energy</strong><br />
matters.<br />
Ratio of average <strong>energy</strong> demand (load) to the maximum demand<br />
(peak load) during a period.<br />
Low Carbon Buildings Programme (renewable <strong>energy</strong> grant scheme<br />
which closed to new applications on 24 th May 2010)<br />
Unit of power equal to 1000 kilowatts<br />
Woody, perennial grass – biomass/biofuel source<br />
The Office for Gas and Electricity Markets<br />
Global peak in oil production<br />
Installing or adding features/measures to a building which has<br />
already been constructed.<br />
<strong>Renewable</strong> Heat Incentive<br />
<strong>Renewable</strong>s Obligation ‐ the main support scheme for UK renewable<br />
electricity projects, whereby UK electricity suppliers must source an<br />
increasing proportion of electricity from renewable sources.<br />
<strong>Renewable</strong> Obligation Certificates ‐ issued to an accredited<br />
generator for eligible renewable electricity generated, and supplied<br />
to customers, within UK by a licensed electricity supplier.<br />
Standard Assessment Procedure ‐ government system for calculating<br />
the <strong>energy</strong> rating of residential buildings. (Includes lighting, space<br />
heating, water heating and CO 2 emissions.)<br />
Small and Medium Sized Enterprises are businesses which employ<br />
fewer than 250 people; with an annual turnover of up to 50 million<br />
euro, and/or an annual balance sheet of up to 43 million euro.<br />
Tonnes of Oil Equivalent = unit of <strong>energy</strong> equal to that derived from<br />
burning 1 tonne of oil = to 11.63 GWh<br />
Transfer of very high voltage electrical <strong>energy</strong> from generating<br />
plants to local substations. In the UK this is mostly via overhead<br />
cables supported by towers (usually referred to as pylons) or<br />
insulated cables buried underground. National Grid is the main<br />
transmission company in the UK.<br />
114
Appendix 2: Written Evidence<br />
Organisation Name Position Format<br />
British Gas Niall Thorburn Community Energy Email/comment<br />
C4Ci James Sweet Commercial Director<br />
(Chairman of KEB Task &<br />
Finish Group on<br />
Maximising Green<br />
Opportunities)<br />
Document<br />
Canterbury City<br />
<strong>Council</strong><br />
Charlotte<br />
Hammersley<br />
Senior Scrutiny and<br />
Improvement Officer<br />
Documents<br />
Carbon Free Group Jay Mather Director of Sustainability Documents<br />
Carbon Trust Matthew Spencer Head of Government<br />
Affairs<br />
Email/<br />
comment<br />
Creative<br />
Environmental<br />
Networks (CEN)<br />
Jeff Slade<br />
Director, Technical<br />
Services Team<br />
Document<br />
Creative<br />
Environmental<br />
Networks (CEN)<br />
Tom Vosper Head of Biomass Team Document<br />
CPRE Sean Furey Deputy Director Document<br />
Energy Saving Trust<br />
Advice Centre (ESTAC)<br />
Matthew Morris Senior Project Manager Document<br />
E.ON Climate and<br />
<strong>Renewable</strong>s<br />
Brian Tilley<br />
Strategy and Stakeholder<br />
Coordination Manager<br />
Document<br />
Environment Agency Jennie Donovan Planning and<br />
Communications<br />
Manager – <strong>Kent</strong> and East<br />
Sussex<br />
Document<br />
Fintry Development<br />
Trust<br />
Fintry Development<br />
Trust<br />
Bill Acton Founder Email/<br />
comment<br />
Martin Turner Founder Email/<br />
comment<br />
Forestry Commission Ian Tubby Head of Biomass Energy<br />
Centre<br />
Document<br />
115
Forestry Commission Matthew Woodcock Programmes Manager,<br />
South East Region<br />
Greenwich University Dr Jeff Pedley Business Development<br />
Manager,<br />
School of Science ‐<br />
Low Carbon Projects<br />
Document<br />
Document<br />
<strong>Kent</strong> Community<br />
Foundation<br />
John Jackson Funds Manager Document*<br />
<strong>Kent</strong> Downs AONB Nick Johannsen Director Documents<br />
<strong>Kent</strong> Enviropower<br />
(WRG)<br />
Paul Andrews Managing Director Document<br />
<strong>Kent</strong> Highway Services Peter Rosevear Senior Transportation<br />
Engineer<br />
Locate in <strong>Kent</strong> Karl Jansa Business Development<br />
Manager<br />
Medway <strong>Council</strong> Steve Long Senior Research and<br />
Review Officer<br />
Document<br />
Document<br />
Email/Comment<br />
National Farmers<br />
Union<br />
William White SE Regional Director Document<br />
Natural England Nigel Jennings Environmental Planning<br />
Adviser<br />
Document<br />
RWE npower<br />
renewables (RNRL)<br />
Katy Woodington<br />
Community Investment<br />
Officer<br />
Document*<br />
RWE npower<br />
renewables (RNRL)<br />
Dr Wayne Cranstone<br />
Head of Onshore<br />
Development and<br />
Projects<br />
Document<br />
South East England<br />
Partnership Board<br />
David Payne Planning Manager Document<br />
University of<br />
Greenwich (Bio<strong>energy</strong><br />
Research Group)<br />
Jeff Pedley<br />
Business Development<br />
Manager<br />
Document<br />
Community Groups<br />
and Members of the<br />
public<br />
Email/comment<br />
116
Appendix 3: Hearings<br />
14th April 2010<br />
• Peter Binnie, Head of Operations (Property Group)<br />
• Andy Morgan, Head of Energy Management<br />
• Rebecca Spore, Head of Public, Private Partnerships and PFI (CFE)<br />
• John Thorp, Director, Thameswey Energy<br />
21st April 2010<br />
• Rob Asquith, Director of Land and Planning, New Earth Solutions<br />
• Sue Barton, Strategic Projects and Business Development Manager (Waste<br />
Management)<br />
• Dan Gillert, Commercial Manager, Living Fuels<br />
12th May 2010<br />
• Ian Tubby, Head of Biomass Energy Centre, Forestry Commission<br />
• Matthew Woodcock, Programme Manager – SE Region, Forestry Commission<br />
• Dr Howard Lee, Lecturer and Sustainability Champion, Hadlow College<br />
• Jonathan Scurlock, Chief Adviser, <strong>Renewable</strong> Energy and Climate Change, National<br />
Farmers’ Union<br />
• William White, SE Regional Director, National Farmers’ Union<br />
19th May 2010<br />
• Janey Bray, Research and Project Manager, Amicus Horizon<br />
• Richard Hurford, Head of SE Region, Energy Saving Trust<br />
• Steve Plater, Core Group Member, Sevenoaks Transition Town<br />
• Ian Smith, Core Group Member, Sevenoaks Transition Town<br />
26th May 2010<br />
• Jane Ollis, Head of Sustainable Business, Business Support <strong>Kent</strong><br />
• Howard Johns, Director, OVESCO<br />
• Chris Rowlands, Director, OVESCO<br />
• Paul Reynolds, Offshore Wind Development Manager, <strong>Renewable</strong>UK<br />
117
27th May 2010<br />
• Mike Dixon, Engineering Projects Manager, EDF Energy Networks<br />
• John Park, Infrastructure Planning Engineer, EDF Energy Networks<br />
• Dick Polley, Planning Manager (South), EDF Energy Networks<br />
• David Cook, Metrotidal NB<br />
• Matthias Hamm, Metrotidal NB<br />
• Mark Willingale, Metrotidal NB<br />
1st June 2010<br />
• Simon Cole, Senior Planning Officer, Ashford Borough <strong>Council</strong><br />
• Robin Haycock, Associate, Arup<br />
• Jennifer Hunt, EMS Project Manager, Maidstone Borough <strong>Council</strong><br />
• John Newington, Senior Pollution Officer, Maidstone Borough <strong>Council</strong><br />
• Peter Rosevear, Senior Transportation Engineer, <strong>Kent</strong> Highway Services<br />
• Laurienne Tibbles, Sustainability Manager, Ashford’s Future<br />
118
Appendix 4: Visits undertaken as part of select committee review<br />
3 rd March 2010<br />
Ecobuild Conference, Earl’s Court<br />
16 th March 2010<br />
Beaufort House, Headquarters of <strong>Renewable</strong> Energy Systems Limited, Kings Langley,<br />
Hertfordshire<br />
20 th April 2010<br />
‘Keeping the Lights on’, Protect <strong>Kent</strong> Energy Conference at Pines Calyx, St Margaret’s at Cliffe<br />
17 th May 2010<br />
South East England Partnership Board – Consultation Event (Sessions House)<br />
6 th July 2010<br />
St Peter’s Church of England Primary School, Aylesford<br />
119
Appendix 5: Summary of questionnaire survey results<br />
1. Number of responses = 47<br />
2. Breakdown of responses by District and school type:<br />
District Primary Secondary Special Total<br />
Ashford 5 0 0 5<br />
Canterbury 2 0 0 2<br />
Dartford 4 1 0 5<br />
Dover 0 3 0 3<br />
Gravesham 0 2 1 3<br />
Maidstone 3 1 0 4<br />
Sevenoaks 3 0 1 4<br />
Shepway 1 0 0 1<br />
Swale 5 1 0 6<br />
Thanet 4 1 0 5<br />
Tonbridge & Malling 7 2 0 9<br />
Tunbridge Wells 0 0 0 0<br />
TOTAL 34 11 2 47<br />
3. Schools’ current <strong>energy</strong> rating (where stated):<br />
Not stated/<br />
A<br />
B<br />
C<br />
D<br />
E<br />
F<br />
G<br />
Not applicable<br />
0‐25<br />
26‐50<br />
51‐75<br />
76‐100<br />
101‐125<br />
126‐150<br />
150+<br />
13 0 0 6 15 10 3 0<br />
120
4. Main heating fuel:<br />
Gas Oil Calor<br />
Gas<br />
Gas/Oil Oil/Elec Woodchip/<br />
Gas<br />
26 15 1 3 1 1<br />
5. Eco Schools status:<br />
Yes No Not<br />
Stated<br />
28 18 1<br />
6. Energy saving measures in place:<br />
Notes:<br />
i) There was a problem filling in the questionnaire in some cases.<br />
ii) No definition of <strong>energy</strong> saving measures was given and the perception of an <strong>energy</strong><br />
saving measure varied e.g. some responses related to water efficiency measures (these<br />
are not noted below).<br />
iii) 20 schools did not respond to this question or said none were in place.<br />
Energy saving measures noted:<br />
Lighting sensors, new light fittings<br />
Double glazing<br />
Boiler controls<br />
Improved programmer on boiler and lower <strong>energy</strong> electric tube fittings and some roof<br />
insulation<br />
Energy saving light bulbs, <strong>energy</strong> saving reminders about the school<br />
Movement sensors, sun tubes, timed switches<br />
Switching off lights, standby on computer, closing doors to keep heat in, low <strong>energy</strong> bulbs<br />
One boiler renewed since DEC survey, educating children, eco warriors<br />
Lighting controls, boiler controls<br />
Eco monitors, monitoring of electric and gas, renewal of heating parts<br />
Heating controls, lagging to pipes, light sensors in classrooms<br />
121
Currently we are educating pupils, having the green gang we have attained our second<br />
Green Flag, two walking buses, meter readings, fabric collections. Power Busters are<br />
nominated pupils who turn off lights close doors etc<br />
ICT suite closedown checks each night, lights, power etc<br />
Power sources turned off when rooms not used<br />
Insulated all roofs and walls (where possible), eco plan in place to reduce, reuse, recycle<br />
Energy efficiency notices<br />
7. Energy saving measures planned:<br />
16 schools did not respond to this question or said none were planned.<br />
Comments included:<br />
No <strong>energy</strong> efficiency work due to budget implications for school. Haven’t been able to obtain<br />
100% funding.<br />
Undecided<br />
Planned <strong>energy</strong> saving measures noted:<br />
Double glazed windows and door<br />
Planning to become an Eco school<br />
Planned Eco status<br />
Next level of Eco Schools status<br />
LED lighting<br />
Replacement of old radiators, adding thermostatic valves.<br />
Power Rangers<br />
Monitoring – we are open to ideas to cut our <strong>energy</strong> bills!<br />
Expecting BSF to significantly improve <strong>energy</strong> efficiency and make substantial savings<br />
through a variety of <strong>energy</strong> efficiency measures<br />
Voltage optimisation being installed summer 2010<br />
Changing light fittings for more efficient ones, cutting down on food waste<br />
Energy Meter<br />
To complete double glazing<br />
Radiator thermostats being fitted August 10<br />
Recycling<br />
7. <strong>Renewable</strong> technologies in place:<br />
Yes No Not<br />
Stated<br />
10 36 1<br />
122
Technologies at the 10 schools:<br />
i) photovoltaic panels<br />
ii) photovoltaic panels<br />
iii) not stated<br />
iv) ground source heat pump (greenhouse only)<br />
v) photovoltaic panels<br />
vi) photovoltaic panels<br />
vii) photovoltaic panels and wind turbine<br />
viii) photovoltaic panels, solar thermal panels and wind turbine<br />
ix) air source heat pumps<br />
x) biomass heating<br />
8. Schools with south‐facing roof space<br />
Yes<br />
No<br />
40 7<br />
9. Amount of south‐facing roof space (n=40)<br />
Not<br />
stated<br />
>30m 2 30‐<br />
99m 2 100‐<br />
499m 2 500<br />
m 2 +<br />
18 1 3 12 6<br />
10. Currently considering renewable <strong>energy</strong> systems:<br />
Yes No Not<br />
Stated<br />
20 25 2<br />
The technologies being considered included photovoltaic panels (which in one case were<br />
currently being fitted), solar thermal panels and wind turbine.<br />
123
11. Reasons for not considering renewable <strong>energy</strong> systems (in some cases these are reasons<br />
for not yet taking plans further, even though systems have been considered:<br />
Lack of funding/costs<br />
Flat roofs, very old building, densely populated residential area<br />
Strict planning permission<br />
Time (to consider options)<br />
(Not considering but would like to)<br />
Other comments included:<br />
PV installed in 2009 with grants, further initiatives too expensive.<br />
Our boiler is very old and KCC hope to replace this in the next financial year.<br />
Would like to investigate possibility of funding /support for panels on south facing<br />
school roof pv/st and also need to investigate KCC planning dept attitude to school<br />
installation in AONB/sensitive area<br />
We would be an ideal site for the location of wind turbines and solar panels, which<br />
we have previously considered but as part of BSF Wave 5 with a prospective new<br />
build on a relocated site, were not able to pursue further. However, now BSF is<br />
cancelled, it would be timely to look at this again but funding is an issue however as<br />
the school has no available funds to contribute to the cost of renewable <strong>energy</strong><br />
schemes.<br />
Unsure what is available<br />
Registered with British Gas for free solar panels<br />
Wind turbine to be installed at off‐site engineering centre summer 2010<br />
Would like to purchase mini wind turbine<br />
Grants in place. Planning permission for PV, still trying to get planning permission for<br />
wind turbine but at risk of losing grants.<br />
12. Information or support that would assist schools in making decisions about <strong>energy</strong><br />
efficiency work or the installation of renewable technologies:<br />
The original questionnaires distributed via the schools’ e‐bulletin allowed one choice<br />
from a list of options. Following comments, the version sent out with a ‘reminder’<br />
enabled selection of more than one option. The options given were:<br />
Access to online resources<br />
Access to case studies<br />
An <strong>energy</strong> checklist<br />
124
Information about KCC Energy and Water Loan Fund<br />
Site visit by <strong>energy</strong> assessor<br />
Training Course<br />
Visits to/meet with other schools<br />
Of those questionnaires sent back with only the top selection possible, the most<br />
popular choices (evenly split) were an <strong>energy</strong> checklist and information about the<br />
Energy and Water Loan Fund. Respondents who could choose more than one option<br />
frequently chose all, or most of the options given.<br />
13. Respondents were asked whether they would, in principle, be interested in a scheme<br />
(which could be brokered by KCC) whereby their school could benefit from <strong>energy</strong><br />
efficiency work and the installation of appropriate renewable <strong>energy</strong> systems, enabling<br />
immediate financial savings and reducing carbon emissions by accessing funding at a<br />
cost less than the value of savings to be made (and whether they would like more<br />
information about such a scheme should it become available).<br />
98% (46/47) respondents indicated their interest in such a scheme<br />
(The remaining respondent had already obtained grant funding for renewable<br />
technologies but had not yet been given planning permission to proceed.)<br />
125
References<br />
Please note documents referred to are included, where possible, as links<br />
BERR, 2009 New Industry, New Jobs, London<br />
Bertoldi P., Atansiu B., 2007 Electricity consumption and efficiency trends in the enlarged<br />
European Union. European Communities:Luxembourg.<br />
BP plc, 2010 Statistical Review of World Energy. London<br />
Breeze, L., 2009 Supporting Low Carbon Communities in <strong>Kent</strong>: An appraisal of initiatives and<br />
opportunities. KCC Internal Report<br />
CEN, 2009 Ashford Energy and Water Retrofit: Baseline Survey. Internal Report<br />
Climate Change Act 2008. London:HMSO<br />
Consumer Focus, 2010 Fuel Poverty Charter. London<br />
DCSF, 2010 Climate Change: A Carbon Management Strategy for the Schools Sector<br />
DECC, 2010 A Strategy for Household Energy Management: Warm Homes Greener Homes.<br />
London<br />
DECC, 2009 The UK <strong>Renewable</strong> Energy Strategy, London<br />
DECC, 2010 CRC Energy Efficiency Scheme User Guide<br />
DECC, 2010 Energy Trends Special Report: <strong>Renewable</strong> Energy in 2009<br />
Department for Transport , 2009 The RTFO (Amendment) Order 2009<br />
Global Climate Network, 2009 Low‐Carbon Jobs in an Inter‐Connected World. London: GCN<br />
HM Government, 2008 The King Review of Low Carbon Cars: Part II Recommendations for<br />
Action. London<br />
HM Government, 2009 Investing in a Low Carbon Britain. London: BERR/DECC/IUS<br />
HM Government, 2009 The UK Low Carbon Industrial Strategy, London: BERR/DECC<br />
Institute of Civil Engineers (ICE), 2009 Why Waste Heat?<br />
<strong>Kent</strong> <strong>County</strong> <strong>Council</strong> (undated) Supporting <strong>Kent</strong> Schools to become Sustainable Schools<br />
<strong>Kent</strong> <strong>County</strong> <strong>Council</strong>, 2008 Environment Policy<br />
<strong>Kent</strong> <strong>County</strong> <strong>Council</strong>, 2009 Integrated Transport Strategy for <strong>Kent</strong><br />
<strong>Kent</strong> <strong>County</strong> <strong>Council</strong>, 2009 <strong>Kent</strong> Design Guide: Sustainable Construction Technical Appendix<br />
<strong>Kent</strong> <strong>County</strong> <strong>Council</strong>, 2009 Regeneration Framework: Unlocking <strong>Kent</strong>’s Potential<br />
<strong>Kent</strong> <strong>County</strong> <strong>Council</strong>, 2009 Sustainable Construction Policy Statement<br />
<strong>Kent</strong> <strong>County</strong> <strong>Council</strong>, 2009 Towards 2010 Progress Report<br />
126
<strong>Kent</strong> <strong>County</strong> <strong>Council</strong>, 2009 Towards a Low Carbon <strong>Kent</strong> – Making a world of difference to<br />
<strong>energy</strong> saving!<br />
<strong>Kent</strong> <strong>County</strong> <strong>Council</strong>, 2010 Low Carbon Opportunities for Growth<br />
<strong>Kent</strong> <strong>County</strong> <strong>Council</strong>, 2010 Medium Term Plan 2010‐2013<br />
<strong>Kent</strong> Downs AONB, 2008 Climate Change Mitigation: <strong>Renewable</strong> Energy Technologies and<br />
Protected Landscapes, Identification of Key Constraints and Opportunities for <strong>Renewable</strong><br />
Energy within The <strong>Kent</strong> Downs AONB. Internal Report<br />
Land Use Consultants and TV Energy (2010) Review of <strong>Renewable</strong> and Decentralised Energy<br />
Potential in South East England, online at <br />
MacKay, D. J. C. 2007 Enhancing electrical supply by pumped storage in tidal lagoons, online at<br />
<br />
MacKay, D.J.C. 2009 Sustainable Energy ‐ Without the Hot Air, online at<br />
.<br />
Morgan, A., 2010 Wood Fuel Heating in <strong>Kent</strong> Schools. Internal <strong>report</strong><br />
Parliamentary Office of Science and Technology, 2010 Postnote: <strong>Renewable</strong> Heating<br />
Simpson‐Jones, R., 2009 Introduction to the Building Energy Efficiency Programme, online at <<br />
http://www.london.gov.uk/rp/events/20090210/LCSG‐buildings‐retrofit‐presentation‐<br />
100209.pdf><br />
SDC, 2010 Sustainable Neighbourhood Infrastructure: Evidence Base. London<br />
Tesla, N., ‘The Problem of Increasing Human Energy,’ The Century Illustrated Magazine, pp.<br />
175‐211<br />
The Carbon Trust, 2009 Innovations Case Study CS153<br />
Other websites referred to in <strong>report</strong>:<br />
http://www.distgen.com/projects/castle‐farm<br />
http://www.fitariffs.co.uk<br />
http://www.generationgreen.co.uk/solarpanels/<br />
127
THIS PAGE IS INTENTIONALLY BLANK<br />
128
ACKNOWLEDGEMENTS<br />
The Select Committee would like to thank the KCC Officers, individuals and organisations who<br />
gave up their time to assist with this review. This includes those who have attended hearings,<br />
submitted written evidence, provided informal advice, hosted visits or completed<br />
questionnaire surveys. Thanks are also due to individuals whose offers to host visits could not<br />
be taken up due to time constraints.<br />
All the information received, whether or not it has been included in the <strong>final</strong> <strong>report</strong>, has<br />
contributed to the Select Committee’s knowledge and appreciation of the issues.<br />
Particular thanks are due to Neil Hilkene and Carolyn McKenzie who acted as Lead Officers for<br />
the Review and to Mr David Brazier who provided a <strong>report</strong> on his Study Tour to Austria.<br />
129