Tonbridge & Malling - Kent County Council
Tonbridge & Malling - Kent County Council
Tonbridge & Malling - Kent County Council

You also want an ePaper? Increase the reach of your titles
YUMPU automatically turns print PDFs into web optimized ePapers that Google loves.
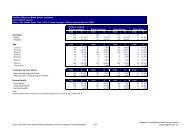
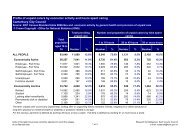
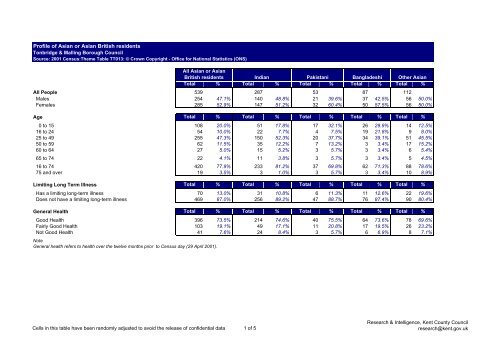
Profile of Asian or Asian British residents<br />
<strong>Tonbridge</strong> & <strong>Malling</strong> Borough <strong>Council</strong><br />
Source: 2001 Census:Theme Table TT013: © Crown Copyright - Office for National Statistics (ONS)<br />
All Asian or Asian<br />
British residents Indian Pakistani Bangladeshi Other Asian<br />
Total % Total % Total % Total % Total %<br />
All People 539 287 53 87 112<br />
Males 254 47.1% 140 48.8% 21 39.6% 37 42.5% 56 50.0%<br />
Females 285 52.9% 147 51.2% 32 60.4% 50 57.5% 56 50.0%<br />
Age Total % Total % Total % Total % Total %<br />
0 to 15 108 20.0% 51 17.8% 17 32.1% 26 29.9% 14 12.5%<br />
16 to 24 54 10.0% 22 7.7% 4 7.5% 19 21.8% 9 8.0%<br />
25 to 49 255 47.3% 150 52.3% 20 37.7% 34 39.1% 51 45.5%<br />
50 to 59 62 11.5% 35 12.2% 7 13.2% 3 3.4% 17 15.2%<br />
60 to 64 27 5.0% 15 5.2% 3 5.7% 3 3.4% 6 5.4%<br />
65 to 74 22 4.1% 11 3.8% 3 5.7% 3 3.4% 5 4.5%<br />
16 to 74 420 77.9% 233 81.2% 37 69.8% 62 71.3% 88 78.6%<br />
75 and over 19 3.5% 3 1.0% 3 5.7% 3 3.4% 10 8.9%<br />
Limiting Long Term Illness Total % Total % Total % Total % Total %<br />
Has a limiting long-term illness 70 13.0% 31 10.8% 6 11.3% 11 12.6% 22 19.6%<br />
Does not have a limiting long-term illness 469 87.0% 256 89.2% 47 88.7% 76 87.4% 90 80.4%<br />
General Health Total % Total % Total % Total % Total %<br />
Good Health 396 73.5% 214 74.6% 40 75.5% 64 73.6% 78 69.6%<br />
Fairly Good Health 103 19.1% 49 17.1% 11 20.8% 17 19.5% 26 23.2%<br />
Not Good Health 41 7.6% 24 8.4% 3 5.7% 6 6.9% 8 7.1%<br />
Note<br />
General health refers to health over the twelve months prior to Census day (29 April 2001).<br />
Cells in this table have been randomly adjusted to avoid the release of confidential data 1 of 5<br />
Research & Intelligence, <strong>Kent</strong> <strong>County</strong> <strong>Council</strong><br />
research@kent.gov.uk
Profile of Asian or Asian British residents<br />
<strong>Tonbridge</strong> & <strong>Malling</strong> Borough <strong>Council</strong><br />
Source: 2001 Census:Theme Table TT013: © Crown Copyright - Office for National Statistics (ONS)<br />
All Asian or Asian<br />
British residents Indian Pakistani Bangladeshi Other Asian<br />
Tenure Total % Total % Total % Total % Total %<br />
Owns outright 124 23.0% 71 24.7% 24 45.3% 7 8.0% 22 19.6%<br />
Owns with a mortgage or loan 288 53.4% 178 62.0% 21 39.6% 28 32.2% 61 54.5%<br />
Shared ownership 4 0.7% 0 0.0% 4 7.5% 0 0.0% 0 0.0%<br />
Rented from council 13 2.4% 5 1.7% 0 0.0% 8 9.2% 0 0.0%<br />
Other social rented 43 8.0% 3 1.0% 3 5.7% 30 34.5% 7 6.3%<br />
Private rented 41 7.6% 19 6.6% 3 5.7% 11 12.6% 8 7.1%<br />
Living rent free 13 2.4% 7 2.4% 0 0.0% 3 3.4% 3 2.7%<br />
Living in a Communal Establishment 17 3.2% 4 1.4% 0 0.0% 0 0.0% 13 11.6%<br />
Note<br />
the terms used to describe tenure are defined as:<br />
Other social rented includes rented from Registered Social Landlords; Housing Association; Housing Co-operative and Charitable Trust.<br />
Private rented: renting from a private landlord or letting agency; employer of a household member; or relative or friend of a<br />
household member or other person<br />
Accomodation Type Total % Total % Total % Total % Total %<br />
Household in unshared accommodation 513 95.2% 277 96.5% 52 98.1% 86 98.9% 98 87.5%<br />
House or bungalow 463 85.9% 250 87.1% 52 98.1% 73 83.9% 88 78.6%<br />
Flat; maisonette or apartment 50 9.3% 27 9.4% 0 0.0% 13 14.9% 10 8.9%<br />
Caravan or other mobile or temporary structure 0 0.0% 0 0.0% 0 0.0% 0 0.0% 0 0.0%<br />
Household in shared accommodation 6 1.1% 6 2.1% 0 0.0% 0 0.0% 0 0.0%<br />
Communal Establishment 17 3.2% 0 0.0% 0 0.0% 3 3.4% 14 12.5%<br />
Medical and care establishment 11 2.0% 0 0.0% 0 0.0% 0 0.0% 11 9.8%<br />
Other type of establishment 6 1.1% 0 0.0% 0 0.0% 3 3.4% 3 2.7%<br />
Cells in this table have been randomly adjusted to avoid the release of confidential data 2 of 5<br />
Research & Intelligence, <strong>Kent</strong> <strong>County</strong> <strong>Council</strong><br />
research@kent.gov.uk
Profile of Asian or Asian British residents<br />
<strong>Tonbridge</strong> & <strong>Malling</strong> Borough <strong>Council</strong><br />
Source: 2001 Census:Theme Table TT013: © Crown Copyright - Office for National Statistics (ONS)<br />
All Asian or Asian<br />
British residents Indian Pakistani Bangladeshi Other Asian<br />
Qualifications Total % Total % Total % Total % Total %<br />
Population aged 16 to 74 420 233 37 62 88<br />
No qualifications or level unknown 81 19.3% 43 18.5% 0 0.0% 28 45.2% 10 11.4%<br />
Lower level qualifications 132 31.4% 72 30.9% 11 29.7% 17 27.4% 32 36.4%<br />
Higher level qualifications 201 47.9% 118 50.6% 22 59.5% 15 24.2% 46 52.3%<br />
Not aged 16 to 74 123 22.8% 54 18.8% 18 34.0% 27 31.0% 24 21.4%<br />
Note<br />
The term 'no qualifications' describes people without any academic; vocational or professional qualifications.<br />
The term 'lower level' qualifications is used to describe qualifications equivilent to levels 1 to 3 of the National Key Learning Targets<br />
i.e. GCSE's ; 'O' levels; NVQ levels 1-3).<br />
The term 'Higher level' refers to qualifications of levels 4 and above (i.e. first degrees; higher degrees; NVQ levels 4 and 5;<br />
HND; HNC; and certain professional qualifications).<br />
Economic Activity Total % Total % Total % Total % Total %<br />
Population aged 16 to 74 420 233 37 62 88<br />
Economically active 310 73.8% 180 77.3% 25 67.6% 38 61.3% 67 76.1%<br />
Employee/Full-time 161 51.9% 99 55.0% 14 56.0% 13 34.2% 35 52.2%<br />
Employee/Part-time 53 17.1% 28 15.6% 3 12.0% 11 28.9% 11 16.4%<br />
Self-employed/Full-time 67 21.6% 42 23.3% 5 20.0% 8 21.1% 12 17.9%<br />
Self-employed/Part-time 8 2.6% 5 2.8% 0 0.0% 0 0.0% 3 4.5%<br />
Unemployed 12 3.9% 3 1.7% 3 12.0% 3 7.9% 3 4.5%<br />
Full-time student 9 2.9% 3 1.7% 0 0.0% 3 7.9% 3 4.5%<br />
Economically inactive 113 26.9% 54 23.2% 14 37.8% 22 35.5% 23 26.1%<br />
Retired 21 18.6% 14 25.9% 3 21.4% 0 0.0% 4 17.4%<br />
Student 26 23.0% 13 24.1% 3 21.4% 4 18.2% 6 26.1%<br />
Looking after home/family 31 27.4% 12 22.2% 5 35.7% 9 40.9% 5 21.7%<br />
Permanently sick or disabled 13 11.5% 7 13.0% 0 0.0% 3 13.6% 3 13.0%<br />
Other 22 19.5% 8 14.8% 3 21.4% 6 27.3% 5 21.7%<br />
Not aged 16 to 74 123 22.8% 54 18.8% 18 34.0% 27 31.0% 24 21.4%<br />
Cells in this table have been randomly adjusted to avoid the release of confidential data 3 of 5<br />
Research & Intelligence, <strong>Kent</strong> <strong>County</strong> <strong>Council</strong><br />
research@kent.gov.uk
Profile of Asian or Asian British residents<br />
<strong>Tonbridge</strong> & <strong>Malling</strong> Borough <strong>Council</strong><br />
Source: 2001 Census:Theme Table TT013: © Crown Copyright - Office for National Statistics (ONS)<br />
All Asian or Asian<br />
British residents Indian Pakistani Bangladeshi Other Asian<br />
NS-SeC Total % Total % Total % Total % Total %<br />
Population aged 16 to 74 420 233 37 62 88<br />
1. Higher managerial & professional occupations 102 24.3% 61 26.2% 15 40.5% 7 11.3% 19 21.6%<br />
1.1 Large employers and higher managerial occupations 33 7.9% 19 8.2% 4 10.8% 3 4.8% 7 8.0%<br />
1.2 Higher professional occupations 69 16.4% 42 18.0% 11 29.7% 4 6.5% 12 13.6%<br />
2. Lower managerial & professional occupations 90 21.4% 54 23.2% 8 21.6% 6 9.7% 22 25.0%<br />
3. Intermediate occupations 36 8.6% 19 8.2% 3 8.1% 4 6.5% 10 11.4%<br />
4. Small employers and own account workers 51 12.1% 35 15.0% 0 0.0% 8 12.9% 8 9.1%<br />
5. Lower supervisory and technical occupations 11 2.6% 5 2.1% 0 0.0% 3 4.8% 3 3.4%<br />
6. Semi-routine occupations 33 7.9% 18 7.7% 0 0.0% 9 14.5% 6 6.8%<br />
7. Routine occupations 9 2.1% 5 2.1% 0 0.0% 4 6.5% 0 0.0%<br />
8. Never worked or long-term unemployed 21 5.0% 4 1.7% 3 8.1% 11 17.7% 3 3.4%<br />
L14.1 Never worked 21 5.0% 4 1.7% 3 8.1% 11 17.7% 3 3.4%<br />
L14.2 Long-term unemployed 0 0.0% 0 0.0% 0 0.0% 0 0.0% 0 0.0%<br />
Not classified 82 19.5% 35 15.0% 8 21.6% 10 16.1% 29 33.0%<br />
L15. Full-time student 36 8.6% 17 7.3% 3 8.1% 7 11.3% 9 10.2%<br />
L17. Not classifiable for other reasons 46 11.0% 18 7.7% 5 13.5% 3 4.8% 20 22.7%<br />
Under 16 108 20.0% 51 17.8% 17 32.1% 26 29.9% 14 12.5%<br />
Note<br />
In the NS-SeC classification; all full-time students are recorded in the full-time student category regardless of if they are<br />
economically active or not.<br />
Not classifiable for other reasons includes people who have not been coded and those who cannot be allocated to an NS-SeC category.<br />
Cells in this table have been randomly adjusted to avoid the release of confidential data 4 of 5<br />
Research & Intelligence, <strong>Kent</strong> <strong>County</strong> <strong>Council</strong><br />
research@kent.gov.uk
Profile of Asian or Asian British residents<br />
<strong>Tonbridge</strong> & <strong>Malling</strong> Borough <strong>Council</strong><br />
Source: 2001 Census:Theme Table TT013: © Crown Copyright - Office for National Statistics (ONS)<br />
All Asian or Asian<br />
British residents Indian Pakistani Bangladeshi Other Asian<br />
Occupation Total % Total % Total % Total % Total %<br />
Population aged 16 to 74 420 233 37 62 88<br />
1. Managers and Senior Officials 76 18.1% 47 20.2% 3 8.1% 9 14.5% 17 19.3%<br />
2. Professional Occupations 69 16.4% 41 17.6% 11 29.7% 4 6.5% 13 14.8%<br />
3. Associate Professionals and Technical Occupations 50 11.9% 31 13.3% 4 10.8% 3 4.8% 12 13.6%<br />
4. Administrative and Secretarial Occupations 36 8.6% 20 8.6% 5 13.5% 4 6.5% 7 8.0%<br />
5. Skilled Trades Occupations 10 2.4% 6 2.6% 0 0.0% 4 6.5% 0 0.0%<br />
6. Personal Service Occupations 10 2.4% 3 1.3% 0 0.0% 0 0.0% 7 8.0%<br />
7. Sales and Customer Service Occupations 17 4.0% 13 5.6% 0 0.0% 4 6.5% 0 0.0%<br />
8. Process; Plant and Machine Operatives 6 1.4% 6 2.6% 0 0.0% 0 0.0% 0 0.0%<br />
9. Elementary Occupations 22 5.2% 11 4.7% 0 0.0% 7 11.3% 4 4.5%<br />
Not currently working 119 28.3% 56 24.0% 13 35.1% 24 38.7% 26 29.5%<br />
Not aged 16 to 74 123 22.8% 54 18.8% 18 34.0% 27 31.0% 24 21.4%<br />
Industry Total % Total % Total % Total % Total %<br />
A. Agriculture; Hunting and Forestry 3 0.7% 3 1.3% 0 0.0% 0 0.0% 0 0.0%<br />
B. Fishing 0 0.0% 0 0.0% 0 0.0% 0 0.0% 0 0.0%<br />
C. Mining and Quarrying 0 0.0% 0 0.0% 0 0.0% 0 0.0% 0 0.0%<br />
D. Manufacturing 31 7.4% 18 7.7% 6 16.2% 3 4.8% 4 4.5%<br />
E. Electricity; Gas and Water Supply 0 0.0% 0 0.0% 0 0.0% 0 0.0% 0 0.0%<br />
F. Construction 14 3.3% 8 3.4% 0 0.0% 3 4.8% 3 3.4%<br />
G. Wholesale and Retail Trade 58 13.8% 37 15.9% 3 8.1% 8 12.9% 10 11.4%<br />
H. Hotels and Catering; Repairs 13 3.1% 0 0.0% 0 0.0% 10 16.1% 3 3.4%<br />
I. Transport; Storage and Communication 17 4.0% 11 4.7% 0 0.0% 3 4.8% 3 3.4%<br />
J. Financial Intermediation 31 7.4% 21 9.0% 3 8.1% 3 4.8% 4 4.5%<br />
K. Real Estate; Renting and Business Activities 50 11.9% 30 12.9% 8 21.6% 7 11.3% 5 5.7%<br />
L. Public Administration and Defence; Social Security 17 4.0% 11 4.7% 0 0.0% 0 0.0% 6 6.8%<br />
M. Education 9 2.1% 3 1.3% 3 8.1% 0 0.0% 3 3.4%<br />
N. Health and Social Work 59 14.0% 30 12.9% 4 10.8% 3 4.8% 22 25.0%<br />
O; P; Q Other 6 1.4% 6 2.6% 0 0.0% 0 0.0% 0 0.0%<br />
Not currently working 119 28.3% 56 24.0% 13 35.1% 24 38.7% 26 29.5%<br />
Not aged 16 to 74 123 22.8% 54 18.8% 18 34.0% 27 31.0% 24 21.4%<br />
Note<br />
Other* in industry includes other community; social and personal service activities; private households with employed persons;<br />
extra territorial organisations and bodies.<br />
Cells in this table have been randomly adjusted to avoid the release of confidential data 5 of 5<br />
Research & Intelligence, <strong>Kent</strong> <strong>County</strong> <strong>Council</strong><br />
research@kent.gov.uk