canterbury-profile - Kent County Council
canterbury-profile - Kent County Council
canterbury-profile - Kent County Council

Create successful ePaper yourself
Turn your PDF publications into a flip-book with our unique Google optimized e-Paper software.
<strong>Kent</strong> <strong>County</strong> <strong>Council</strong><br />
Supporting Independence Programme<br />
Area Profile 2008<br />
Canterbury
Introduction & contents<br />
This document is an update of <strong>Kent</strong> <strong>County</strong> <strong>Council</strong>’s Supporting<br />
Independence Programme Area Profile for Canterbury. It presents the<br />
most recently available data and analysis for the Canterbury City <strong>Council</strong><br />
area at ward and lower super output area (LSOA) level. It is designed to<br />
highlight the main issues in the areas within this district that are<br />
experiencing the most complex, multiple disadvantage.<br />
The report looks at data which underpins the ten groups or archetypes<br />
highlighted by the Supporting Independence Programme in order to focus<br />
the work of KCC and its partners onto those groups and locations which<br />
require the most concentrated effort. By looking holistically at particularly<br />
disadvantaged areas and taking into account a variety of factors it is hoped<br />
that the issues that are particular to these areas can be tackled more<br />
effectively. Indeed research commissioned by KCC, Her Majesty’s Treasury<br />
and the Department of Work & Pensions carried out by Oxford University<br />
suggests that people who live in those disadvantaged wards that have a SIP<br />
focus are up to 30% more likely to exit benefit dependency than those who<br />
live in other disadvantaged wards in the South East.<br />
The ten groups are:<br />
1. Young people with low attainment and aspiration<br />
2. Young people in care or leaving care<br />
3. Adult and young offenders<br />
4. Lone parents and teenage pregnancy<br />
5. Working age welfare benefit recipients<br />
6. Adults with low qualifications and skills<br />
7. Alcohol and other drug misusers<br />
8. Adults with physical and learning disabilities<br />
9. Transient or seasonal groups<br />
10. Vulnerable older people<br />
Not all the data for these groups is available at ward level or lower. Those<br />
groups which do not have low‐level data are omitted from this report.<br />
Also, some data providers have been unable to update the data they<br />
provide in time, so we have presented the last datasets available to us at<br />
the time of writing (August 2008).<br />
In Canterbury, there are a number of wards which this report concentrates<br />
on, as the data shows that people living in these areas are generally more<br />
likely to experience a range of complex and multiple disadvantages than<br />
elsewhere. This report focuses on these wards and presents information<br />
for Canterbury CC area and <strong>Kent</strong> as a whole, for comparison purposes. The<br />
wards this report focuses on are:<br />
• Heron<br />
• Northgate<br />
• Seasalter<br />
All figures are rounded to the nearest 5 and counts under 3 are suppressed<br />
to zero (0). Figures marked ~ are zero counts. Percentage figures are<br />
calculated using unrounded numbers. Rankings are based on all 283 wards<br />
in the <strong>Kent</strong> <strong>County</strong> <strong>Council</strong> area. Where LSOA data is presented, rankings<br />
are based on all 883 LSOAs in the KCC area. A ranking of 1 signifies the<br />
most disadvantaged ward or LSOA. Note that for some indicators numbers<br />
are small, so should be used with caution.<br />
Data is available for all Canterbury wards, but is not included in this report.<br />
For data for other wards, or any other queries, please contact :<br />
<strong>Kent</strong> <strong>County</strong> <strong>Council</strong> Supporting Independence Programme<br />
Tel: 01622 696932, Email: sip@kent.gov.uk
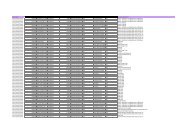
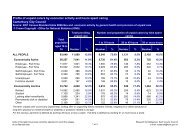
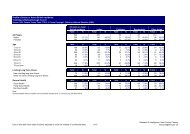
The matrix to the left shows the wards which appear in the top 10% most<br />
disadvantaged wards in <strong>Kent</strong> for each of the different indicators at ward<br />
level (i.e. the top 28 wards). A blue square represents that ward’s<br />
appearance in the top 10%, and the number inside the square represents<br />
the ranking out of 283. The wards along the left hand side are those wards<br />
which would be expected to appear towards the top of the rankings for<br />
most indicators of disadvantage in <strong>Kent</strong>. It shows that the Canterbury<br />
wards outlined above appear in the top 10% most disadvantaged wards in<br />
the county in several indicators.<br />
Northgate is ranked in the top 10% for five of the fourteen indicators. It is<br />
ranked ninth in the county for two indicators (hospital admissions due to<br />
drugs/alcohol, and Incapacity Benefits claimants). Heron appears in the top<br />
10% wards in six indicators also, it’s highest ranking for limiting long term<br />
illness and poor health (12 th and 11 th respectively). This represents<br />
multiple, complex disadvantage in these two wards in particular.<br />
The rest of this report is laid out according to the archetypes, and presents<br />
the data for each of the four featured wards in this district for the<br />
indicators used to underpin these archetypes.<br />
Please bear in mind that if an individual finds themselves represented in<br />
one of the archetypes, it can be that they may find themselves in others –<br />
they are not exclusive. In fact, it is expected that these who live in<br />
disadvantaged areas are more likely to experience a range of<br />
disadvantages, so may well find themselves in several of these groups.
1. Young people with low attainment<br />
& aspiration<br />
This archetype uses two indicators: 16 – 18 year olds who are not in<br />
education, employment or training (NEET), and young people who leave<br />
school with less than 5 A* to G GCSEs.<br />
Young people not in education, employment or training (NEET)<br />
Selected Canterbury wards, March 2008. Source: Connexions<br />
Ward Pop 16‐18 Count NEET Rate (per<br />
100)<br />
Rank from 283<br />
Heron 287 15 4.9 93<br />
Northgate 231 15 6.5 61<br />
Seasalter 240 5 2.9 150<br />
Canterbury CC 5,411 205 3.8 8<br />
KCC AREA 49,816 2,224 4.5<br />
None of the three wards rank in the top 10% most disadvantaged wards in<br />
this indicator. The highest ranking ward in Canterbury is actually Barton<br />
ward, at 31 st with a rate of 8.9 young people NEET per all 16‐18 year olds.<br />
The highest ranking ward for this indicator in <strong>Kent</strong> is Folkestone Harvey<br />
Central, with 21.3% of 16‐18 year olds NEET. Of the three wards in this<br />
report, Northgate has the highest rate, at 6.5.<br />
For Canterbury as a whole, 205 young people are NEET, around 4 per cent<br />
of the total target population. This means that Canterbury has the eighth<br />
highest rate of NEETs in the county by district. 4.5% of all 16 – 18 year olds<br />
in <strong>Kent</strong> are NEET. There has been a decrease in NEET figures across <strong>Kent</strong><br />
and for Canterbury – down from 4.8% in April 2006. Rates have decreased<br />
in all four wards.<br />
School leavers with less than five A* to G GCSEs<br />
Selected Canterbury wards, summer 2007. Source: <strong>Kent</strong> <strong>County</strong> <strong>Council</strong> CFE<br />
Ward<br />
All school<br />
leavers<br />
Count
is the third highest number of looked‐after children in <strong>Kent</strong> – only fewer<br />
than Thanet and Swale. Thanet has by far the highest number with 445.<br />
Of the 238 looked‐after children in Canterbury, 64% were placed by other<br />
local authorities outside <strong>Kent</strong>, the remaining 34 individuals were placed by<br />
KCC.<br />
3. Adult & young offenders<br />
This archetype uses two indicators: the number of young people aged<br />
between 10 and 17 known to the Youth Offending Service (YOS), and<br />
crimes that are recorded by <strong>Kent</strong> Police. YOS data is from August 2008, and<br />
the police data is for the financial year 2007‐08.<br />
Number of 10 to 17 year olds known to <strong>Kent</strong> Youth Offending Service<br />
Selected Canterbury wards, August 2008. Source: <strong>Kent</strong> YOS<br />
Ward Pop 10‐17 Count<br />
known to<br />
YOS<br />
Rate (per<br />
100)<br />
Rank from<br />
283<br />
Heron 758 15 1.8 39<br />
Northgate 535 10 2.1 32<br />
Seasalter 674 10 1.3 70<br />
Canterbury CC 13,767 135 1.0 7<br />
KCC AREA 140,700 1,416 1.0<br />
None of the three wards rank in the top 10% for this indicator, although<br />
West Bay ward ranks 16 th , with 2.6% of the 10‐17 year old population<br />
being known to YOS (although this is only around 15 people so a small<br />
number). The highest rate is in Cliftonville West (Thanet) where the rate is<br />
6.0%. Northgate ward has the highest rate for this indicator of the featured<br />
wards in this report, at 32 nd with 2.1%.<br />
Canterbury BC area has the seventh highest rate of all the twelve KCC<br />
districts, Canterbury’s rate (1.0%) being the same as the <strong>Kent</strong> overall rate.<br />
135 young people in Canterbury are known to YOS. Thanet has the highest<br />
rate, at 1.5.<br />
The rate for Canterbury has decreased since the last SIP report with data<br />
from YOS presented at April 06. The district rate has gone down from 1.2%<br />
whereas the county rate has remained the same. Rankings for all featured<br />
wards have improved apart from Seasalter, which has seen no change. This<br />
represents a relative improvement of the rate in Heron and Northgate<br />
compared to other <strong>Kent</strong> wards.<br />
Police recorded crimes<br />
Selected Canterbury wards, April 2007 – March 2008. Source: <strong>Kent</strong> Police<br />
Ward Pop (total) Count recorded<br />
crimes<br />
Rate (per<br />
100)<br />
Rank<br />
from 283<br />
Heron 8,900 1,045 11.8 31<br />
Northgate 5,700 910 16.0 15<br />
Seasalter 8,200 335 4.1 217<br />
Canterbury CC 146,000 10,310 7.1 7<br />
KCC AREA 1,383,600 107,530 7.8<br />
Northgate ward ranks fifteenth in the county for total recorded crimes,<br />
with 16 crimes being recorded per 100 people resident in the ward in one<br />
financial year. Note, however, that this is a town centre ward and this will<br />
have a major impact on the types of crimes recorded. Margate Central has<br />
the highest recorded crime rate in <strong>Kent</strong>, with 44.2 crimes being recorded<br />
per 100 people. That’s more than five times higher than the <strong>Kent</strong> rate of<br />
7.8 per 100. The Canterbury CC area is the seventh highest ranking district<br />
from the 12 in <strong>Kent</strong>, with just over 7 recorded crimes per 100 people. The<br />
highest ranking districts are Dartford (10.9%) and Thanet (10.1%).<br />
For Northgate, the most common crimes recorded were:
• Criminal Damage: 22% of all recorded crimes<br />
• Violence against the person: 21%<br />
• Theft offences: 15%<br />
• Shoplifting: 13%<br />
These crimes are commonly found in town centres, and are linked to the<br />
night‐time economy and retail outlets. Most of the other highest‐ranking<br />
wards in <strong>Kent</strong> are found in town centre locations.<br />
Other than Northgate, Westgate and Barton wards also appear in the top<br />
10% (Westgate 11 th with 22 crimes per 100 people and Barton 25 th with<br />
13).<br />
Total recorded crime rates in <strong>Kent</strong> have fallen since the previous financial<br />
year – down from 8.6% to 7.8%. Canterbury’s rate has also decreased from<br />
7.8%.<br />
4. Lone parents & teenage pregnancy<br />
The publishing of teenage pregnancy data is considered sensitive and is<br />
therefore not released at a local level, and it is also released two years<br />
retrospectively. We know that the rate and number of conceptions among<br />
under 18s in Canterbury in 2006 was 79 conceptions per 1,000 females<br />
aged 15‐17, and ranks ninth out of the twelve districts in <strong>Kent</strong>: this<br />
represents 79 teenage conceptions. The county rate is 37.1, which is<br />
slightly lower than the national rate of 40.7 per 1,000. However, the<br />
Canterbury rate has shown the second greatest percentage decrease since<br />
1998 – at 31% it is significantly higher than the rest of <strong>Kent</strong>’s districts.<br />
England & Wales saw an average increase of 13.7% in teenage conception<br />
rate between 1998 and 2006.<br />
The data from <strong>Kent</strong> Teenage Pregnancy Unit also tells us that Heron ward<br />
had the highest teenage conception rate in Canterbury in 2004, with rates<br />
of between 50 and 74 conceptions per 1,000 15‐17 year old females. This<br />
rate represents the 22 nd highest rate at ward level in <strong>Kent</strong>.<br />
For lone parents, we use an indicator showing the number of lone parents<br />
claiming Income Support. This data is provided by the Department of Work<br />
and Pensions, and can be analysed at LSOA level too. Of the 883 LSOAs in<br />
<strong>Kent</strong>, one LSOA in Gorrell (E01024061) ranks 33 rd highest in the county,<br />
with 50 lone parents claiming Income Support – that’s 7% of the total<br />
working age population of that particular neighbourhood (16‐59 for<br />
women, 16‐64 for men).<br />
Lone parents claiming Income Support<br />
Selected Canterbury, May 2007. Source: Dept of Work & Pensions<br />
Ward<br />
Pop<br />
(WA)<br />
Count lone<br />
parents on IS<br />
Rate (per<br />
100)<br />
Rank<br />
from 283<br />
Heron 4,754 125 2.6 64<br />
Northgate 3,759 130 3.5 37<br />
Seasalter 3,797 70 1.8 102<br />
Canterbury CC 80,812 1320 1.6 8<br />
KCC AREA 795,039 15,480 1.9<br />
The table above shows that none of the featured wards appear in the top<br />
10 wards in <strong>Kent</strong>, Northgate ranking highest at 37 th with 3.5% of the<br />
working age population being lone parents dependent on Income Support.<br />
This is more than double the rate for Canterbury as a whole, which is the<br />
eighth highest rate of the twelve districts in <strong>Kent</strong> – that’s 1,320 lone<br />
parents within the city council area.<br />
The rate for Canterbury has decreased by 1.5% since May 2006, and the<br />
rates for all four featured wards have remained virtually unchanged.<br />
No other wards in Canterbury rank in the top ten per cent – indeed, most<br />
of the Canterbury wards are low‐ranking for this indicator. The highest<br />
ranking ward in <strong>Kent</strong> for this indicator was Stanhope in Ashford, with a rate<br />
of 8% of all working age people being lone parents dependent on IS.
The following section presents data on other individuals who are<br />
dependent on other working age out‐of‐work benefits.<br />
5. Working age welfare benefit<br />
recipients<br />
For this archetype, we can look at Jobseekers Allowance claimants and the<br />
total number of working age people on out of work benefits (Incapacity<br />
Benefits, Jobseekers Allowance and Lone Parents on Income Support).<br />
Figures on Incapacity Benefits claimants specifically are presented in<br />
section 8 below.<br />
All working age people on out‐of‐work benefits (IB, JSA, Lone parents on<br />
IS)<br />
Selected Canterbury wards, May 2007. Source: Dept of Work & Pensions<br />
Ward Pop (WA) Count total<br />
WA benefit<br />
claims<br />
Rate (per<br />
100)<br />
Rank from<br />
283<br />
Heron 4,754 895 18.8 34<br />
Northgate 3,759 835 22.2 21<br />
Seasalter 3,797 510 13.4 94<br />
Canterbury CC 80,812 4,990 6.2 5<br />
KCC AREA 795,039 78030 9.8<br />
Northgate ward ranks in the top 10% for the county and has the highest<br />
rate in Canterbury. 22 per cent of all people of working age in Northgate<br />
are dependent on welfare benefits. Cliftonville West in Thanet ranks<br />
highest for this indicator, with nearly 40% of the working age population<br />
dependent on welfare benefits.<br />
Canterbury ranks fifth of the twelve districts in <strong>Kent</strong> for this indicator. The<br />
figure of 6.2% represents a decrease of 2.5% from May 2006.<br />
Jobseekers’ Allowance claimants<br />
Selected Canterbury wards, May 2007. Source: Dept of Work & Pensions<br />
Ward<br />
Pop<br />
(WA)<br />
JSA claimants<br />
Rate (per<br />
100)<br />
Rank<br />
from 283<br />
Heron 4,754 170 3.6 25<br />
Northgate 3,759 115 3.1 40<br />
Seasalter 3,797 50 1.3 150<br />
Canterbury CC 80,812 1,325 1.6 7<br />
KCC AREA 795,039 14,935 1.9<br />
One of the featured wards in this report is in the top 10% wards in the<br />
county for this indicator, although relatively low‐ranking: Heron having the<br />
25 th highest rate of Jobseekers’ Allowance claimants for all wards in <strong>Kent</strong>,<br />
with a rate of 3.6%. Folkestone Harvey Central ranks highest, with a rate<br />
more than five times higher than the <strong>Kent</strong> average (10.8%).<br />
Canterbury’s rate is the seventh highest in the county, at 1.6% of the<br />
working age population. This represents a decrease of 17% from May<br />
2006. The rate for <strong>Kent</strong> as a whole has also seen a fall, by 15% from 2.2 to<br />
1.9.<br />
The same LSOAs which rank first and second in the county in Cliftonville<br />
West and Margate Central for total welfare benefit claimants (E01024657<br />
and E01024678) rank second and third for Jobseekers Allowance claimants,<br />
with 14% and 12% respectively.
6. Adults with low qualifications &<br />
skills<br />
We have to rely on Census data from 2001 for this indicator to present<br />
data at a neighbourhood level.<br />
Adults with no academic or vocational qualifications<br />
Selected Canterbury wards, Census 2001. Source: ONS<br />
Ward Pop (16‐<br />
74)<br />
Count – no<br />
qualifications<br />
Rate (per<br />
100)<br />
Rank from<br />
283<br />
Heron 5,730 1,877 32.8 72<br />
Northgate 4,179 1,183 28.3 125<br />
Seasalter 4,930 1,660 33.7 59<br />
Canterbury CC 96,766 25,198 26.0 8<br />
KCC AREA 947,830 268,478 28.3<br />
None of the wards in Canterbury rank in the top 10% for this indicator.<br />
Leysdown & Warden in Swale has the highest rate in the county, with<br />
51.2%, so is significantly higher than the highest rate in Canterbury, which<br />
was 36.7 in West Bay ward. Canterbury CC has the eighth highest rate of<br />
adults with no qualifications, Swale the highest.<br />
More recent estimates from the ONS suggest that for 2006 there were<br />
8,303 19 – 64 year olds with no qualifications in Canterbury – 10.5% of all<br />
19 – 64 year olds in the district. Note the difference in the population<br />
range – hence the difference in rate. This is the seventh highest rate in the<br />
county, and is slightly lower than the 11.4% of all 19 – 64 year olds in <strong>Kent</strong>.<br />
7. Alcohol & other drug misusers<br />
There is a shortage of data at a local level for this archetype, but we can<br />
use hospital admissions for mental and behavioural disorders due to<br />
psychoactive substance misuse as a proxy.<br />
Hospital admissions for mental & behavioural disorders due to<br />
psychoactive substance misuse<br />
Selected Canterbury wards, 2007 – 2008. Source: K&M SHA<br />
Pop (total) Count – no Rate (per Rank<br />
Ward<br />
qualifications 100) from 283<br />
Heron 8,478 20 0.24 48<br />
Northgate 5,713 20 0.35 9<br />
Seasalter 6,899 20 0.29 17<br />
Canterbury CC 135,278 280 0.21 1<br />
KCC AREA 1,329,710 2,075 0.16<br />
Clearly the numbers are very low so this data should be used with caution,<br />
but the data shows that Canterbury CC area had the highest rate of<br />
hospital admissions in the county last year. Northgate and Seasalter both<br />
rank in the top 10% wards in the county (9 th , with 0.35 admissions per 100<br />
people resident in the ward and 17 th /0.29 respectively), but Wincheap<br />
(ranked 5 th ), Westgate (6 th ) and Harbour (8 th ) all appear in the top 10% too.<br />
This represents a significant issue for Canterbury compared to the rest of<br />
<strong>Kent</strong>.
8. Adults with physical & learning<br />
disabilities<br />
For this archetype we use claimants of Incapacity Benefits and Disability<br />
Living Allowance as the most appropriate indicators available at a local<br />
level. Incapacity Benefits (IB) are paid to people who are sick and/or<br />
disabled who cannot work, whereas Disability Living Allowance (DLA) is<br />
payable to anybody with a long‐term illness or disability whether they are<br />
capable of work or not.<br />
Incapacity Benefit claimants<br />
Selected Canterbury wards, May 2007. Source: DWP<br />
Pop (WA) Count – IB Rate (per Rank<br />
Ward<br />
claimants 100) from 283<br />
Heron 4,754 460 9.7 27<br />
Northgate 3,759 460 12.2 9<br />
Seasalter 3,797 245 6.5 98<br />
Canterbury CC 80,812 4,990 6.2 5<br />
KCC AREA 795,039 47615 6.0<br />
Northgate and Heron rank 9 th and 27 th in the county for the rate of<br />
Incapacity Benefit claimants – both in the top 10% wards in the county. No<br />
other ward in the Canterbury area ranks in the top 10% wards for the<br />
county.<br />
The city council area ranks fifth in <strong>Kent</strong>, and has seen a small decrease of<br />
0.2% over the previous year’s figure.<br />
The vast majority of IB claimants are dependent on benefits for a long<br />
time. Around 78% are dependent on benefits for more than 2 years, over<br />
half for more than five. Research suggests that if an individual has claimed<br />
IB for more than two years, they are more likely to die or retire than return<br />
to work. As the table shows, the rankings are not particularly high (at least<br />
relative to other indicators), but there are still significant numbers of<br />
claimants in these four wards.<br />
Disability Living Allowance (DLA) is payable to people who become<br />
disabled before the age of 65, and is payable to claimants whether they<br />
work or not. However, there will be some people with a disability who are<br />
not eligible for DLA (e.g. their disability is not severe enough) or who may<br />
choose not to claim DLA or are unaware of their eligibility, but it is thought<br />
that this is a more comprehensive proxy than IB claimant counts, as those<br />
who are disabled but are in work cannot claim IB.<br />
Disability Living Allowance claimants<br />
Selected Canterbury wards, May 2007. Source: DWP<br />
Ward<br />
Pop (total)<br />
Count – DLA<br />
claimants<br />
Rate (per<br />
100)<br />
Rank from<br />
283<br />
Heron 8,478 460 5.4 58<br />
Northgate 5,713 405 7.1 15<br />
Seasalter 6,899 360 5.2 66<br />
Canterbury CC 135,278 5,910 4.4 5<br />
KCC AREA 1,329,710 55,830 4.2<br />
Just one ward – Northgate – appears in the top 10% wards in the county,<br />
at 15 th with 405 DLA claimants, or 7.1% of the total population having a<br />
severe enough disability to be eligible for this benefit, and who are<br />
claiming it. The highest ranking ward in <strong>Kent</strong> is Leysdown & Warden in<br />
Swale, with 10% of the population claiming DLA.<br />
Canterbury has the fifth highest rate of DLA claimants at 4.4%, Thanet the<br />
highest of the 12 districts in <strong>Kent</strong> at 6.1%, this compares to 4.2% for <strong>Kent</strong><br />
as a whole.
9. Transient or seasonal groups<br />
There is no known data available for this archetype at ward level, but we<br />
do have data on homeless households that are accepted as<br />
“unintentionally homeless by the local authority and are eligible for<br />
assistance and in priority need”.<br />
Canterbury ranks eighth from twelve in <strong>Kent</strong> with 76 households accepted<br />
as homeless. This compares with the highest ranking district, which is<br />
Gravesham, with 258 homeless households, and 45 in Swale, which is the<br />
lowest number.<br />
At district level, we can also present data on the number of migrant<br />
workers from outside the UK who were issued with National Insurance<br />
numbers by the Department of Work and Pensions. The figures cover all<br />
foreign nationals registered with a NI number for whatever reason – for<br />
example the figures cover benefit/tax credit recipients as well as those<br />
who are in work. All foreign nationals issued with a NI number are<br />
included, regardless of their length of stay in the UK.<br />
In 2007/08, 1,340 migrant workers were issued with a National Insurance<br />
number in the Canterbury CC area. This represents 1.4 per cent of the<br />
working age population within the BC area. This is the fourth highest rate<br />
in the county, after Gravesham, Maidstone and Tunbridge Wells. The<br />
number of NI number issues in the Canterbury area has risen from 510 in<br />
2002/03. Just over 43 per cent of those migrant workers came from the<br />
twelve EU accession states 1 .<br />
Note that these are not snapshot figures, so they do not show the number<br />
of migrants in <strong>Kent</strong> at any given time – it is the number of NI numbers<br />
issued to migrants within a given year.<br />
10. Vulnerable older people<br />
This archetype is best represented by using the number of older people<br />
claiming Pension Credit as its indicator. Pension Credit is a benefit payable<br />
to people aged over 60 to guarantee a minimum income of £124.05 per<br />
week for single people and £189.35 for people in a partnership. It would<br />
normally be paid to those people who suffer from financial stress due to<br />
insufficient pension payments from elsewhere or lack of savings, so this is<br />
a good proxy measure for those older people who are vulnerable to<br />
poverty.<br />
Pension Credit claimants<br />
Selected Canterbury wards, November 2007. Source: DWP<br />
Ward<br />
Pop (60+)<br />
Count – PC<br />
claimants<br />
Rate (per<br />
100)<br />
Rank from<br />
283<br />
Heron 2,305 755 32.8 18<br />
Northgate 984 300 30.5 28<br />
Seasalter 2,182 345 15.8 179<br />
Canterbury CC 32,868 6,380 19.4 6<br />
KCC AREA 296,816 58,090 19.6<br />
This table shows that two wards rank in the top 10% for the county –<br />
Heron, with 755 people aged over 60 who claim Pension Credit, or 32.8%,<br />
and Northgate with 300 people, or 30.5%. This compares with the highest<br />
ranking ward in <strong>Kent</strong>, which is Margate Central at 46%.<br />
There’s been a 0.5% increase in Pension Credit claims in <strong>Kent</strong> since 2006,<br />
but Canterbury has seen no change in the same time period. The CC area<br />
ranks sixth out of the twelve districts in <strong>Kent</strong> with 19.4% of those aged 60+<br />
claiming Pension Credit, compared to 19.6% for <strong>Kent</strong> as a whole.<br />
1<br />
EU Accession countries are: Poland, Czech Republic, Slovakia, Hungary, Slovenia, Latvia,<br />
Lithuania, Estonia, Malta, (Greek) Cyprus, Bulgaria and Romania