The Lower Thames Crossing - Kent County Council
The Lower Thames Crossing - Kent County Council
The Lower Thames Crossing - Kent County Council

You also want an ePaper? Increase the reach of your titles
YUMPU automatically turns print PDFs into web optimized ePapers that Google loves.
<strong>The</strong> <strong>Lower</strong><br />
<strong>Thames</strong> <strong>Crossing</strong><br />
<strong>Kent</strong> <strong>County</strong> <strong>Council</strong><br />
KPMG Regeneration and Funding Report<br />
Final Version<br />
August 2010
Important notice<br />
<strong>The</strong> information in this report is based upon information provided by or on behalf of <strong>Kent</strong> <strong>County</strong> <strong>Council</strong> and reflects<br />
prevailing conditions and our views as of this date, all of which are accordingly subject to change. In preparing this<br />
report, we have relied upon and assumed, without independent verification, the accuracy and completeness of all<br />
information provided to us.<br />
<strong>The</strong> quantitative economic analysis contained in this report is related to three alternative <strong>Lower</strong> <strong>Thames</strong> crossing options:<br />
from east of Gravesham to Stanford-le-Hope; from east of Gravesham to Chadwell and close to or at the existing<br />
Dartford crossing. Analysis of funding and procurement approaches relates to the proposed Gravesham to Stanford-le-<br />
Hope crossing. Although we endeavour to provide accurate and timely information, there can be no guarantee that such<br />
information is accurate as of the date it is received or that it will continue to be accurate in the future. No one should act<br />
upon such information without appropriate professional advice after a thorough examination of the particular situation.<br />
This report was prepared for <strong>Kent</strong> <strong>County</strong> <strong>Council</strong> and can only be circulated within the terms of the engagement<br />
contract signed between the <strong>Council</strong> and KPMG LLP. Any party who obtains access to and chooses to rely on this report<br />
(or any part of it) will do so at its own risk. Whilst the information presented and views expressed in this report and<br />
related discussions have been prepared in good faith, <strong>Kent</strong> <strong>County</strong> <strong>Council</strong> and KPMG LLP accept no responsibility or<br />
liability to any party in connection with such information or views.<br />
<strong>The</strong> <strong>Lower</strong> <strong>Thames</strong> <strong>Crossing</strong> <strong>Kent</strong> <strong>County</strong> <strong>Council</strong><br />
@ 2010 KPMG LLP, a UK limited liability partnership, is a subsidiary of KPMG Europe LLP and a member firm of the KPMG<br />
network of independent member firms affiliated with KPMG International Cooperative, a Swiss entity. All rights reserved.
Contents<br />
1 Executive Summary ___________________________________________________________ 1<br />
1.1 Likely regeneration impacts 1<br />
1.2 Funding 2<br />
1.3 Financing and procurement approaches 5<br />
1.4 Conclusions 5<br />
2 Introduction __________________________________________________________________ 7<br />
2.1 Background 7<br />
2.2 Purpose of this report 7<br />
3 Economic assessment framework ________________________________________________ 9<br />
3.1 Introduction 9<br />
3.2 Overview of methodology 9<br />
3.3 Measuring connectivity 10<br />
3.4 Data sources 13<br />
3.5 Assessing business location choice 18<br />
3.6 Considering relative connectivity and business mobility 19<br />
3.7 Assessing agglomeration and productivity 20<br />
3.8 Testing scenarios 21<br />
4 Strategic economic and regeneration impacts ______________________________________ 22<br />
4.1 <strong>The</strong> scenarios tested 22<br />
4.2 Changes in business location 23<br />
4.3 Changes in productivity 23<br />
4.4 Implications for economic output 24<br />
5 Costs _____________________________________________________________________ 25<br />
5.1 Capital costs 25<br />
5.2 Maintenance costs 25<br />
5.3 Unitary charge under a PPP 26<br />
6 Toll revenues _______________________________________________________________ 27<br />
6.1 Toll revenues from a Stanford-le-Hope to Gravesham crossing 27<br />
6.2 Relationship with the existing Dartford crossing 28<br />
7 Funding ____________________________________________________________________ 30<br />
7.1 Distinguishing funding from finance 30<br />
7.2 Funding from Department for Transport 30<br />
7.3 European support 30<br />
7.4 Lorry road user charging 31<br />
7.5 Capturing economic benefits 31<br />
8 Procurement and financing options ______________________________________________ 33<br />
<strong>The</strong> <strong>Lower</strong> <strong>Thames</strong> <strong>Crossing</strong> <strong>Kent</strong> <strong>County</strong> <strong>Council</strong><br />
@ 2010 KPMG LLP, a UK limited liability partnership, is a subsidiary of KPMG Europe LLP and a member firm of the KPMG<br />
network of independent member firms affiliated with KPMG International Cooperative, a Swiss entity. All rights reserved.
8.1 Introduction 33<br />
8.2 Review of the project from a procurement perspective 34<br />
8.3 Conventional procurement and delivery partner approaches 36<br />
8.4 Public Private Partnership 36<br />
<strong>The</strong> <strong>Lower</strong> <strong>Thames</strong> <strong>Crossing</strong> <strong>Kent</strong> <strong>County</strong> <strong>Council</strong><br />
@ 2010 KPMG LLP, a UK limited liability partnership, is a subsidiary of KPMG Europe LLP and a member firm of the KPMG<br />
network of independent member firms affiliated with KPMG International Cooperative, a Swiss entity. All rights reserved.
1 Executive Summary<br />
KPMG has been commissioned by <strong>Kent</strong> <strong>County</strong> <strong>Council</strong> to undertake a high level assessment of the wider<br />
economic and regeneration impacts of a new <strong>Lower</strong> <strong>Thames</strong> crossing and potential funding, financing and<br />
procurement options for delivering this. <strong>The</strong> analysis of wider economic and regeneration impacts on local areas<br />
in North <strong>Kent</strong> and South Essex has considered three crossing options: new capacity at or near to the existing<br />
crossing location; a new crossing between Chadwell and Gravesham and a new crossing from Eastern<br />
Gravesham to Stanford-le-Hope. Assessments of how a new river crossing could be funded and financed as well<br />
as high level procurement options are based on a proposed crossing from Eastern Gravesham to Stanford-le-<br />
Hope.<br />
1.1 Likely regeneration impacts<br />
<strong>The</strong> proposed new crossing sits within the wider context of the <strong>Thames</strong> Gateway Growth Area, the UK’s largest<br />
regeneration project. <strong>The</strong> <strong>Thames</strong> Gateway growth area stretches from East London to North <strong>Kent</strong> and South<br />
Essex. <strong>The</strong> <strong>Thames</strong> Gateway delivery plan outlines an expected growth in jobs of 225,000, and 110,000 new<br />
homes by 2016 1 although these projections however were produced before the recession of the recent years,<br />
and may not now be achievable.<br />
Improving connections between the north and south of the river in the <strong>Thames</strong> Gateway would make travel<br />
between them easier, expanding the size and depth of local labour markets on both sides of the river and<br />
enabling easier trade and business to business communication across the river. <strong>The</strong> economic evidence<br />
suggests that improvements in connectivity could lead to improvements in productivity and in attracting increased<br />
economic activity to the area.<br />
Three scenarios have been considered in the quantitative analysis of regeneration impacts:<br />
■ A scenario where capacity is increased at or close to the existing crossing;<br />
■ A new crossing from Stanford-le-Hope to Eastern Gravesham; and<br />
■ A new crossing from Chadwell to Gravesham.<br />
See Figure 8 on page 22 for a map of crossing options considered. Relieving congestion at the existing Dartford<br />
crossing would improve the experience of users of the existing crossing. However, this would not offer new<br />
journey opportunities or connections between businesses in local areas on different sides of the <strong>Thames</strong> estuary.<br />
<strong>The</strong> new crossing options that we have examined downstream of the existing bridge would provide decongestion<br />
benefits on the existing crossing and a new range of journey opportunities offering larger journey time savings for<br />
some trips. For example, both the Stanford-le-Hope to Eastern Gravesham and the Chadwell to Gravesham<br />
options would improve connections from the Medway towns to the North and from Southend and Chelmsford to<br />
areas in <strong>Kent</strong> and to Dover.<br />
Analysis suggests that the productivity benefits through agglomeration of economic activity could be around:<br />
■ £2m 2 per annum from reducing congestion on the existing crossing;<br />
■ £15m per annum from a new crossing from Chadwell to Gravesham; and<br />
■ £11m per annum from a new crossing from Stanford-le-Hope to Eastern Gravesham.<br />
1 <strong>The</strong> <strong>Thames</strong> Gateway Delivery Plan, HM Government, 2007<br />
2 Expressed as an annual benefit in 2021 in 2002 prices<br />
<strong>The</strong> <strong>Lower</strong> <strong>Thames</strong> <strong>Crossing</strong> <strong>Kent</strong> <strong>County</strong> <strong>Council</strong> ⏐ 1<br />
@ 2010 KPMG LLP, a UK limited liability partnership, is a subsidiary of KPMG Europe LLP and a member firm of the KPMG<br />
network of independent member firms affiliated with KPMG International Cooperative, a Swiss entity. All rights reserved.
Note that these are annual figures and do not represent a discounted flow of benefits as is common in transport<br />
appraisal. <strong>The</strong>se results assume no changes in land use and have been estimated using parameters drawn from<br />
the DfT’s WebTAG appraisal guidance.<br />
<strong>The</strong>re is evidence that the connectivity offered to businesses by the road network is related to business location<br />
choice, although the economic evidence to quantify such relationships is unclear in the data that has been<br />
available to us. While there is some uncertainty over the appropriate parameters for forecasting local employment<br />
outcomes, assumptions consistent with the best fit statistical equations suggest that the increase in employment<br />
in the areas of North <strong>Kent</strong> and South Essex could be around:<br />
■ 1,000 from reducing congestion at the existing crossing;<br />
■ 4,000 from a new crossing from Stanford-le-Hope to Eastern Gravesham; and<br />
■ 6,000 from a new crossing from Chadwell to Gravesham.<br />
Within this local geography, such employment impacts would have a larger influence on local economic output<br />
than changes in business productivity. <strong>The</strong> overall GVA impacts of the Chadwell to Gravesham crossing could be<br />
around £334m per annum in 2021 at 2002 prices. This implies that the discounted value of additional growth in<br />
economic activity in the study area as a result of this scheme could be £12.7bn, although this should be treated<br />
with caution as future changes in additional employment and productivity have been treated as constant over<br />
time. Changes in these benefits over time will therefore affect this analysis.<br />
<strong>The</strong> changes in connectivity brought about by the different crossing options indicates that a crossing to the east<br />
of the existing Dartford crossing would have a significantly larger impact on the connectivity of the areas in North<br />
<strong>Kent</strong> and South Essex where aspirations for future economic growth are high. If access to potential employees<br />
and access to other businesses does affect the attractiveness of locations as places to do business, then the<br />
impacts on employment in North <strong>Kent</strong> and South Essex could be up to eight times larger if new crossing capacity<br />
is provided to the east of the existing crossing rather than simply relieving capacity at the current crossing<br />
location.<br />
<strong>The</strong> local economic growth implications of a proposed new crossing fit in well with the context of the new<br />
government’s spending review and focus on economic outcomes for funding infrastructure schemes.<br />
<strong>The</strong> modelling has not taken into account resilience and reliability impacts of a new <strong>Thames</strong> crossing.<br />
Reassignment of traffic from the Dartford <strong>Crossing</strong> will enable bifurcation of traffic on an already very congested<br />
part of the road network. This in turn will generate congestion relief benefits, and reduce variability in journey<br />
times. <strong>The</strong> benefits of network resilience will not only be captured by local traffic, but also at a regional and<br />
national level, and is in line with the recent London to Dover DaSTS study.<br />
1.2 Funding<br />
<strong>The</strong> total capital costs of the <strong>Lower</strong> <strong>Thames</strong> crossing have been estimated by MVA Gifford and Capita as being<br />
in the region of £1.0bn in 2008 prices, including an allowance for risk and optimism bias of £0.4bn. <strong>The</strong>se costs<br />
have been used throughout the report but KPMG makes no comment as to their accuracy.<br />
Our analysis of funding options has considered:<br />
■ <strong>The</strong> role of toll revenues;<br />
■ Alternative central government funding sources such as national networks capital budgets, the Regional<br />
Funding Allocation or PFI credits; and<br />
■ Alternative sources of funding such as lorry road user charging and mechanisms for capturing the economic<br />
benefits that could be brought to the local area.<br />
<strong>The</strong> <strong>Lower</strong> <strong>Thames</strong> <strong>Crossing</strong> <strong>Kent</strong> <strong>County</strong> <strong>Council</strong> ⏐ 2<br />
@ 2010 KPMG LLP, a UK limited liability partnership, is a subsidiary of KPMG Europe LLP and a member firm of the KPMG<br />
network of independent member firms affiliated with KPMG International Cooperative, a Swiss entity. All rights reserved.
<strong>The</strong> new crossing would work in tandem with the existing Queen Elizabeth II Bridge and Dartford tunnel, offering<br />
a substitute route and relieving capacity constraints on the current crossings. <strong>The</strong> Thurrock-Dartford crossing is<br />
currently tolled so we have assumed that the new crossing would also be tolled in order to avoid creating<br />
incentives for people to make longer journeys. Tolling strategy for the two crossings must therefore be<br />
considered together.<br />
Toll income could contribute different amounts to the capital costs of the project depending on tolling policy and<br />
which tolls are available to support the scheme costs.<br />
<strong>The</strong> interrelationship with tolls on the existing crossing creates some complexity in determining the funding and<br />
financing approach. If considered together, the combined crossing revenue could represent the single most<br />
important potential source of funding for the scheme. <strong>The</strong> existing crossing currently generates a net operating<br />
surplus of over £40m from its operations now that the capital costs of the crossing have been paid off.<br />
Tolls on the existing crossing act as a tax on movement across the river which make these journeys less<br />
attractive and could restrict the regeneration potential of the study area. Economic modelling of a scenario<br />
without tolls on the existing bridge indicated a potential increase in local employment by around 2,000, and<br />
additional annual economic output of over £115m if these tolls were taken away. As the capital cost of the bridge<br />
has been paid for, an argument could be made that the net operating surplus of the existing bridge should accrue<br />
to the local economic area that currently feels the impact of the toll and which could be used to fund additional<br />
local economic development, for example to fund a new <strong>Lower</strong> <strong>Thames</strong> <strong>Crossing</strong>. In this case, the revenues from<br />
the existing crossing could support around half of the debt required to pay for the capital costs of a new bridge.<br />
However, the existing toll revenues accrue to the DfT and can be deployed for other uses. Hence, a case for the<br />
crossing needs to be prepared that demonstrates both value for money and meets wider DfT objectives. More<br />
broadly, the case must demonstrate that the proposed crossing is of national importance and warrants<br />
redeployment of the revenue from the Dartford crossing or other sources to enable it.<br />
If net revenues from the existing crossing are not made available to fund the new crossing, revenues on the new<br />
crossing represent no more than perhaps 20% of the overall scheme costs, subject to the rate of growth of traffic<br />
after completion. This figure assumes that current toll levels are maintained, and is based on current traffic and<br />
revenue estimates provided to us. It is net of operating costs. Information about long term changes in toll incomes<br />
associated with demand growth has not been available to us. <strong>The</strong> new crossing would provide relief for the<br />
existing crossing which is effectively full, so demand growth for cross river traffic is likely to be accommodated by<br />
the new crossing. This may imply faster than usual demand growth which could result in relatively high traffic<br />
growth on the new crossing. This growth could increase the share of capital costs that could be supported by toll<br />
income from the new bridge. If tolls on the new bridge are considered net of abstraction from the existing<br />
crossing, then the ability of this funding stream to support the capital expenditure becomes very limited.<br />
Potential revenue generation from tolling of the New <strong>Lower</strong> <strong>Thames</strong> crossing is limited by the current low tolls on<br />
the existing Dartford crossing and the high level of substitutability of the crossings. A commercial toll on both<br />
bridges could generate substantial additional income to support the cost of the new crossing. Demand for travel<br />
across the crossing is thought to be relatively inelastic, so changes in tolls are likely to have only a small adverse<br />
impact on traffic levels, although this could be significant for some user groups. Further work on tolling levels and<br />
their impact on demand and the affordability of the new crossing is recommended.<br />
Other central government funding is likely to be limited over the coming years. <strong>The</strong> existing indicative 10 year<br />
RFA budget is already subscribed and is likely to come under pressure in the spending review in the autumn,<br />
with expected cutbacks, the abolition of the regional tier and new prioritisation techniques. National networks<br />
capital budgets are likely to come under similar pressure. Indeed, transport is not one of the departments that has<br />
been protected from expenditure cuts and transport projects have already been targets of emergency cuts. In the<br />
short term, it cannot be assumed that either direct capital grants or PPP credits will be available, although over a<br />
longer timeframe, the growing capacity constraint and national significance of the crossing may make it a priority<br />
for central government investment.<br />
<strong>The</strong> <strong>Lower</strong> <strong>Thames</strong> <strong>Crossing</strong> <strong>Kent</strong> <strong>County</strong> <strong>Council</strong> ⏐ 3<br />
@ 2010 KPMG LLP, a UK limited liability partnership, is a subsidiary of KPMG Europe LLP and a member firm of the KPMG<br />
network of independent member firms affiliated with KPMG International Cooperative, a Swiss entity. All rights reserved.
Our indicative analysis suggests that other sources of possible funding towards meeting the costs of the New<br />
<strong>Lower</strong> <strong>Thames</strong> crossing are not likely to be material to the scheme’s overall affordability unless the funding gap is<br />
already narrowed by a material change to tolls or a substantial other funding source. One exception to this is lorry<br />
road user charging. <strong>The</strong> new government’s coalition agreement 3 commits it to introduce this if elected. If<br />
implemented, it could provide additional income for central government and, if improvements to key freight routes<br />
were part of a combined investment initiative, then a case could be made for some of this income to support the<br />
<strong>Lower</strong> <strong>Thames</strong> crossing as a strategic national priority. If taken forward, a national initiative would overtake other<br />
options to implement a local scheme. To deliver transport investment, innovative forms of local funding are<br />
therefore likely to play a larger role. Transport for London, for example, is investigating tax increment financing<br />
approaches from expected development to fund the Northern Line Extension.<br />
Recent work by the Department for Transport indicates that the <strong>Lower</strong> <strong>Thames</strong> crossing is a strategic national<br />
priority and that central government is actively considering options for it. In April 2009 the DfT published a study<br />
outlining possible proposals to improve traffic flow at the Dartford crossing, and assessing possible options for a<br />
new crossing in the longer-term. Following the Budget in March 2010, the Dartford crossing has been identified<br />
as one of a number of assets within the Operational Efficiency Programme for which government is considering<br />
ways of changing the ownership or management through the sale of a concession to operate for example, in<br />
order to extract maximum value. This has given additional impetus to consideration of new crossing options and<br />
how they could be accommodated within a revised framework for the existing crossing.<br />
Other sources of possible funds could capture some of the local economic benefits that the scheme may deliver.<br />
Using assumptions on employment densities set out in the English Partnerships guide to employment densities,<br />
the additional employment numbers would require up to 170,000 sqm of new development to be built implying<br />
developer contributions could be between £1.7 and £5m. This is insignificant compared to the capital cost of the<br />
new bridge.<br />
Overall impacts on economic output will also have implications for tax revenues. A tentative assumption would be<br />
that 35% of the GVA impacts are captured in taxation and could thus contribute up to £117m per annum (35% of<br />
£334m) in new tax income from local businesses within the study area implying additional business rate income<br />
of around £6m per annum. This could represent a more significant funding stream if it can be captured. Tax<br />
increment financing or supplementary business rate approaches could both be used to appropriate some of these<br />
benefits. However, imposing any general business levy is likely to be seen as unacceptable because of its<br />
negative impact on the local and regional economy. <strong>The</strong>se will need to be explored more fully once the scheme<br />
reaches a full business case development stage.<br />
<strong>The</strong> Medway towns are expected to be some of the most significant beneficiaries of the enhanced connectivity<br />
provided by the two new crossing options, with areas local to the new crossings also benefitting. Dispersion of<br />
the potential regeneration benefits over a wider area suggests that potential financial mechanisms to capture<br />
benefits (such as for example, Section 106 or Community Infrastructure Levy contributions, tax increment<br />
financing approaches or local supplementary business rates) must target a wider area rather than the immediate<br />
vicinity of new bridge infrastructure.<br />
In parallel, <strong>Kent</strong> <strong>County</strong> <strong>Council</strong> should enter into dialogue with the EU to ascertain whether a case could be built<br />
for TEN-T funding. EU grant support, equal to up to 10% (or exceptionally 20%) of total eligible costs, represents<br />
a substantial building block to the affordability package. EIB funding of up to 50% of eligible borrowing, while it is<br />
a loan and not a grant, could assist in the scheme’s affordability by helping to minimise cost of finance.<br />
3 <strong>The</strong> Coalition: our programme for government, Cabinet Office, May 2010, Page 31<br />
<strong>The</strong> <strong>Lower</strong> <strong>Thames</strong> <strong>Crossing</strong> <strong>Kent</strong> <strong>County</strong> <strong>Council</strong> ⏐ 4<br />
@ 2010 KPMG LLP, a UK limited liability partnership, is a subsidiary of KPMG Europe LLP and a member firm of the KPMG<br />
network of independent member firms affiliated with KPMG International Cooperative, a Swiss entity. All rights reserved.
1.3 Financing and procurement approaches<br />
Two broad approaches towards procurement were considered, with different implications for the management of<br />
risk and approach to whole life cost. <strong>The</strong>se are:<br />
1. conventional procurement (which, for the purposes of this review, means that <strong>Kent</strong> <strong>County</strong> <strong>Council</strong> and its<br />
delivery partners take the majority of the asset specific risks); and<br />
2. an approach which includes a greater involvement by the private sector in the whole life risks and project<br />
costs through a Public Private Partnership (PPP) structure.<br />
We are aware that the new government has made some adverse comments about the Private Finance Initiative<br />
but they are understood to wish to encourage the use of third party revenues in infrastructure development. In<br />
general, the features of undertaking a PPP are that the private sector will take the majority of the cost based risks<br />
and will use more complex financing tools to fund the project than are available to the public sector. By<br />
comparison, a conventional procurement approach involves a more selective approach to risk sharing and enjoys<br />
lower costs of borrowing but with a less sophisticated range of financing arrangements.<br />
<strong>The</strong>re is a prima facie case for the formation of a PPP. <strong>The</strong> promoter could also consider the payment of<br />
substantial milestone capital contributions, funded through PWLB borrowing, to further improve affordability. This<br />
procurement approach should be reinvestigated once government transport policy and the project revenues and<br />
costs are better understood. However, the cost of PPP borrowing remains high and any procurement analysis<br />
should be undertaken under a twin-track of PPP and a conventional (possibly delivery partner based) approach<br />
up to the point of development which allows and informed value for money choice to be made.<br />
Although the requirement to manage considerable finance and construction risks suggest that PPP may be a<br />
preferred option, any formal appraisal should however actively consider both approaches in tandem, focused on<br />
the objective of securing best value for money.<br />
1.4 Conclusions<br />
<strong>The</strong> proposed New <strong>Lower</strong> <strong>Thames</strong> crossing project is a significant piece of infrastructure to reduce congestion at<br />
one of the busiest parts of the national transport system. It is expected to provide alterative routes for long<br />
distance traffic of national importance as well as offering enhanced local connectivity to support the economic<br />
and social development of the region. <strong>The</strong> proposed crossing could also contribute to improved public transport<br />
links between <strong>Kent</strong> <strong>Thames</strong>ide and South Essex Growth Areas. It is the aspiration of both <strong>Kent</strong> and Essex<br />
<strong>County</strong> <strong>Council</strong>s to connect the Fastrack and South Essex Rapid Transit (SERT) BRT schemes via the Dartford<br />
and <strong>Lower</strong> <strong>Thames</strong> <strong>Crossing</strong>s to provide a public transport link between the <strong>Kent</strong> <strong>Thames</strong>ide and South Essex<br />
Growth Areas.<br />
Initial quantitative assessment of regeneration impacts suggest that a new crossing from Chadwell to Gravesham<br />
could support up to an additional 6,000 jobs within the study area of North <strong>Kent</strong> and South Essex and productivity<br />
benefits from agglomeration of around £15m per annum in 2021. Within this local geography, such employment<br />
impacts would have a far larger influence on local economic output than changes in business productivity. <strong>The</strong><br />
overall GVA impacts of the Chadwell to Gravesham crossing could be around £334m in 2021 at 2002 prices, if<br />
accounting for the GVA impacts of additional employment moving into the study area. Note that this is an annual<br />
number and not a discounted value as is common in transport appraisal.<br />
Given the traffic forecasts we have had access to and under current tolling arrangements, toll income is unlikely<br />
to cover the capital cost of the project. If toll revenues on the existing crossing form part of the funding package,<br />
then these could support around half of the debt required. However, new toll income generated by the crossing is<br />
unlikely to meet a significant proportion of the capital costs of a new crossing. <strong>The</strong> Department for Transport is<br />
likely to consider toll income, net of abstraction from the existing crossing and net of operating costs in the<br />
business case for the project. A strong economic case is therefore required to demonstrate the case for use of<br />
<strong>The</strong> <strong>Lower</strong> <strong>Thames</strong> <strong>Crossing</strong> <strong>Kent</strong> <strong>County</strong> <strong>Council</strong> ⏐ 5<br />
@ 2010 KPMG LLP, a UK limited liability partnership, is a subsidiary of KPMG Europe LLP and a member firm of the KPMG<br />
network of independent member firms affiliated with KPMG International Cooperative, a Swiss entity. All rights reserved.
existing tolls or other public funds. <strong>The</strong> strategic nature of the crossing, potential links to lorry road user charging<br />
and potentially significant forecast growth from future suppressed demand indicate that there may be a case for<br />
allocating national investment funds. In order to progress this, we recommend that a cost benefit analysis and<br />
business case is developed.<br />
<strong>The</strong> funding contribution from tolls could rise significantly if long term traffic growth projections net of changes in<br />
the existing crossing on the new crossing are high. However, even in this case there is likely to be a significant<br />
funding gap. It therefore seems likely that the majority of the shortfall would have to be met through changes to<br />
tolling arrangement, cross subsidy from the existing crossing or from other central government sources.<br />
<strong>The</strong> substitutability between the existing and new crossings argues for an integrated approach to tolling. <strong>The</strong><br />
extent of the funding shortfall will be driven by the user charging regime (if any) that is put in place. It is our view<br />
that the option that may derive the largest income, and therefore make the largest contribution to the project cost,<br />
is the development of a joint “<strong>Lower</strong> <strong>Thames</strong> crossing corridor” approach with user charges linked to the concept<br />
of providing a high standard motorway route between <strong>Kent</strong> and the Channel ports, and the rest of the UK. Tolls<br />
on both routes would need to be similar to avoid potentially biasing traffic towards longer and less efficient routes.<br />
Differential tolls could also undermine the aspiration to introduce a system of bifurcation for traffic heading from<br />
the North and East of London to the Channel Ports (via the LTC/M2/A2 and QEII/M20/A20 corridors<br />
respectively). Under a joint crossing concept, tolling of the <strong>Lower</strong> <strong>Thames</strong> crossing could be enhanced by a share<br />
of income from the existing crossing, potentially including some extra-inflationary toll increases to assist<br />
affordability.<br />
<strong>The</strong> resulting change in local economic activity and development may also provide opportunities for alternative<br />
funding sources to contribute to the construction of a new crossing provided suitable mechanisms for capturing<br />
them can be implemented.<br />
<strong>The</strong> <strong>Lower</strong> <strong>Thames</strong> <strong>Crossing</strong> <strong>Kent</strong> <strong>County</strong> <strong>Council</strong> ⏐ 6<br />
@ 2010 KPMG LLP, a UK limited liability partnership, is a subsidiary of KPMG Europe LLP and a member firm of the KPMG<br />
network of independent member firms affiliated with KPMG International Cooperative, a Swiss entity. All rights reserved.
2 Introduction<br />
2.1 Background<br />
<strong>The</strong> proposed <strong>Lower</strong> <strong>Thames</strong> crossing is a strategically critical scheme, to meet current and future demand and<br />
to reduce the high level of congestion currently affecting the Dartford crossing.<br />
<strong>The</strong> current Dartford crossing is a highly congested arterial route, providing access between the main channel<br />
crossings and areas north of the <strong>Thames</strong>, and for regional traffic between Essex and <strong>Kent</strong>. In response to the<br />
high level of congestion on the route, <strong>The</strong> Department for Transport commissioned a report from Parsons<br />
Brinckerhoff Ltd to identify options for adding capacity and outlining the technical issues relating to them. This<br />
study, issued in January 2009, drew up a series of options ranging from operational improvements to the existing<br />
Dartford crossing, to the development of an additional crossing. In 2009, the government also published the<br />
Operational Efficiency Programme Asset Portfolio which highlighted the Dartford crossing as one of a number of<br />
strategic national assets for which new delivery arrangements are being considered. This presented options for<br />
alternative asset options taking into account the need for future capacity increases. Together, these documents<br />
imply that the government considers the Dartford crossing to be of national significance and demonstrate their<br />
active consideration of policy options for a new <strong>Lower</strong> <strong>Thames</strong> crossing.<br />
Separately to the DfT commissioned report, in 2008, <strong>Kent</strong> and Essex <strong>County</strong> <strong>Council</strong>s jointly commissioned a<br />
study from Gifford, MVA Consultancy and Capita (henceforth referred to in this report as the MVA study) to<br />
evaluate similar options. This report builds on that study, and in particular takes the cost and traffic forecasts set<br />
out in the MVA study as being correct.<br />
<strong>Kent</strong> <strong>County</strong> <strong>Council</strong> has concluded that the so-called ‘Option C’ (a crossing between Stanford-le-Hope and East<br />
of Gravesham) is the preferred crossing location. <strong>The</strong> funding and finance analysis in this report focuses on that<br />
option and assumes that the crossing will be a bridge and not a tunnel.<br />
<strong>The</strong> scheme is a major capital project. No dedicated budget for the New <strong>Lower</strong> <strong>Thames</strong> crossing Project has<br />
been identified by local or Central Government, although we are aware that the Department for Transport is<br />
considering the potential development of a new crossing as part of its assessment of the Dartford crossing. We<br />
understand that current revenue budgets going forward are fully accounted for, and that the current capital<br />
programme exceeds budgets. <strong>The</strong>refore it is essential to determine from which sources the project might<br />
ultimately be funded if it is to proceed to the procurement stages.<br />
<strong>The</strong> project will have to compete against other projects for the allocation of public resources. As such, the<br />
business case for funding will need to be compelling, demonstrating that:<br />
■ <strong>The</strong>re is a robust value for money case for government funding;<br />
■ <strong>The</strong> crossing is of strategic national importance and importance in securing local development objectives; and<br />
■ All of the viable options to secure external income have been fully explored.<br />
This report considers the strategic economic benefits of supporting development in the <strong>Thames</strong> Gateway and<br />
possible sources of revenue, such as toll charges, and considers the extent to which such sources might meet<br />
the estimated costs of the project. As a part of the development of this paper we have considered recent revenue<br />
generating schemes and funding alternatives from UK and worldwide experience.<br />
2.2 Purpose of this report<br />
<strong>Kent</strong> <strong>County</strong> <strong>Council</strong> has commissioned KPMG to appraise the scheme’s potential to support local economic<br />
development and to provide an initial high level review of options for funding, financing and procurement.<br />
<strong>The</strong> <strong>Lower</strong> <strong>Thames</strong> <strong>Crossing</strong> <strong>Kent</strong> <strong>County</strong> <strong>Council</strong> ⏐ 7<br />
@ 2010 KPMG LLP, a UK limited liability partnership, is a subsidiary of KPMG Europe LLP and a member firm of the KPMG<br />
network of independent member firms affiliated with KPMG International Cooperative, a Swiss entity. All rights reserved.
This report provides a high level assessment of:<br />
■ Likely regeneration outcomes using a model of regeneration potential developed by KPMG; and<br />
■ Options for funding, financing and procuring a new crossing based on indicative cost and revenue estimates<br />
from early studies of engineering feasibility and traffic impacts.<br />
Applying information currently available to <strong>Kent</strong> <strong>County</strong> <strong>Council</strong>, the funding, financing and procurement<br />
evaluation is developed as follows:<br />
a) Review of the estimated costs and revenues attributable to the New <strong>Lower</strong> <strong>Thames</strong> crossing Project;<br />
b) Consideration of the potential funding sources may be available to fund the scheme; and<br />
c) Consideration of the merits of conventional procurement against a PPP scheme are and what the issues that<br />
will affect that decision will bring.<br />
At the date of this report, the future availability of government funding for transport is uncertain. For the purpose<br />
of this report however, it is assumed that the environment is considered to be similar to that currently in<br />
existence, excepting that it is highly unlikely that significant new sources of grant funding will be available from<br />
UK Central Government for the foreseeable future. However, once the estimated costs of the New <strong>Lower</strong><br />
<strong>Thames</strong> crossing project are fully understood and the political landscape clarified, options for funding may be reexamined<br />
as a part of the Project Business Case. It is important that funding choices reflect a degree of realism<br />
with regard to their potential future availability.<br />
This study has been undertaken as a desk review, with additional information sourced from recent transactions in<br />
the sector that have been advised on by KPMG. It is recommended that this report is updated once transport<br />
policy has been confirmed by the new government, and that KPMG should commence a dialogue with each of<br />
the parties named to extend our mutual understanding of the project and to clarify the opportunities that each<br />
option may offer. As a precursor to formal discussions, however, <strong>Kent</strong> <strong>County</strong> <strong>Council</strong> should develop its<br />
understanding of the costs and revenues associated with the project, leading ultimately the formation of a<br />
Business Case.<br />
<strong>The</strong> <strong>Lower</strong> <strong>Thames</strong> <strong>Crossing</strong> <strong>Kent</strong> <strong>County</strong> <strong>Council</strong> ⏐ 8<br />
@ 2010 KPMG LLP, a UK limited liability partnership, is a subsidiary of KPMG Europe LLP and a member firm of the KPMG<br />
network of independent member firms affiliated with KPMG International Cooperative, a Swiss entity. All rights reserved.
3 Economic assessment framework<br />
3.1 Introduction<br />
This section describes the methodology employed to assess the potential economic impact of crossing options<br />
and data sources used for the economic assessment, including the South Essex Transport and Land use Model<br />
(SETLUM) and the <strong>Kent</strong> <strong>Thames</strong>ide model (KTS). Data from the SETLUM model has been kindly provided by<br />
Essex <strong>County</strong> <strong>Council</strong>.<br />
3.2 Overview of methodology<br />
Transport is one of a number of factors that can affect business location decisions and the competitiveness of<br />
places. <strong>The</strong> transport network makes possible journeys to different kinds of economic opportunities and<br />
determines the ease or difficulty of accessing these opportunities.<br />
To better understand the impacts that the construction of a second <strong>Thames</strong> crossing could have on local<br />
communities and development, <strong>Kent</strong> <strong>County</strong> <strong>Council</strong> and its advisors have developed a methodology for<br />
assessing the impacts of transport interventions on economic output as measured by Gross Value Added (GVA).<br />
This methodology is based on how changes in connectivity to businesses and labour are related to productivity<br />
and business location decisions.<br />
<strong>The</strong> economic approach is based on the identity:<br />
■ GVA (Gross Value Added) = employment * labour productivity<br />
<strong>The</strong> analysis is therefore based on separately modelling impacts of changes in connectivity on employment and<br />
on productivity.<br />
<strong>The</strong> hypothesis that underlies the economic modelling work is that transport connectivity can affect the<br />
attractiveness of different locations as places to do business. This hypothesis has been investigated using data<br />
on transport supply and observed patterns of economic activity. Figure 1 on the next page shows some of the<br />
links between transport change and economic outcomes within an area when transport can affect land use.<br />
<strong>The</strong> <strong>Lower</strong> <strong>Thames</strong> <strong>Crossing</strong> <strong>Kent</strong> <strong>County</strong> <strong>Council</strong> ⏐ 9<br />
@ 2010 KPMG LLP, a UK limited liability partnership, is a subsidiary of KPMG Europe LLP and a member firm of the KPMG<br />
network of independent member firms affiliated with KPMG International Cooperative, a Swiss entity. All rights reserved.
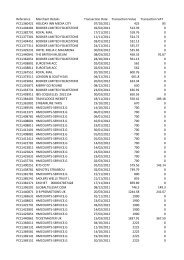
Figure 1: Flow chart of impacts of transport change on GVA<br />
Change in journey<br />
times<br />
Change in<br />
connectivity<br />
Agglomeration<br />
Move to more (or<br />
less) productive<br />
business locations<br />
within study area<br />
Jobs and workers<br />
attracted from<br />
outside study area<br />
Change in<br />
productivity<br />
Change in workplace<br />
employment<br />
Change in GVA<br />
<strong>The</strong> modelling approach deduces changes in business location decisions and agglomeration based on changes<br />
in measures of connectivity. Figure 1 above shows that changes in productivity can come about from changes in<br />
business location decisions as businesses move between areas which support different levels of productivity.<br />
<strong>The</strong> key relationships used for forecasting have been derived from a cross-sectional statistical analysis of the<br />
links between measures of connectivity and the economic outcomes found in different local areas across the<br />
study area.<br />
3.3 Measuring connectivity<br />
Much of the approach to linking transport supply and economic performance is based on measures of<br />
connectivity. For a particular area, a measure of connectivity captures how many economic opportunities there<br />
are within a reasonable journey time of that area. This presents a number of challenges:<br />
■ What represents an ‘opportunity’?<br />
■ How should journey time and different journey opportunities (for example by different modes) be captured?<br />
■ What represents a reasonable journey time? For example, how important is it for a business to be able to<br />
access employees with 20 minutes of commuting time, or 40 minutes, or an hour?<br />
<strong>The</strong> <strong>Lower</strong> <strong>Thames</strong> <strong>Crossing</strong> <strong>Kent</strong> <strong>County</strong> <strong>Council</strong> ⏐ 10<br />
@ 2010 KPMG LLP, a UK limited liability partnership, is a subsidiary of KPMG Europe LLP and a member firm of the KPMG<br />
network of independent member firms affiliated with KPMG International Cooperative, a Swiss entity. All rights reserved.
3.3.1 Opportunities and transport modes<br />
<strong>The</strong> model has been developed to assess how different levels of connectivity affect businesses. Opportunities<br />
have therefore been divided into two groups: access to labour and access to other businesses. <strong>The</strong> segmentation<br />
enables the analysis to separately appraise connectivity to labour and to other businesses.<br />
Socio-economic data has been used to provide the measures of ‘opportunities’ as follows:<br />
■ Labour markets: measured by working age population in origin zone; and<br />
■ Business to business markets: measured by workplace jobs in origin zone<br />
3.3.2 Measuring the difficulty of travel<br />
To capture the combined barriers of journey time and fare/cost, the difficulty of making a journey is captured<br />
using a generalised cost including both of these elements. Generalised times are measured in minutes and<br />
include financial costs by converting them into minutes using values of time taken from WebTAG.<br />
Generalised time (including financial costs) has been sourced from the KTS and SETLUM models. Commuting<br />
journeys are represented as journeys in the AM peak (7am – 10am). Business to business journeys are assumed<br />
to take place during the inter-peak hours of 10am and 4pm.<br />
3.3.3 Assessing reasonable journey times<br />
Market sizes reflect the number of people willing to make a journey to a particular place for a particular purpose.<br />
As the difficulty of a journey increases, the number of people willing to make the journey declines.<br />
<strong>The</strong>re are a number of options available for representing this relationship: a simple boundary (e.g. how many<br />
people within one hour?); a simple linear decay function; a mathematically defined decay function such as an<br />
exponential decay function; or a relationship based on observed travel behaviour. In this analysis a relationship<br />
has been developed for each market segment which reflects the behaviour embodied in the demand data held<br />
within the transport models which is based on observed travel patterns.<br />
Demand and generalised cost data in the model has been used to generate generalised time decay curves or<br />
deterrence functions. For car commuting for example, this represents the share of people that currently accept a<br />
commute of different levels of generalised cost (e.g. Y% of people currently accept a commute of less than or<br />
equal to X minutes). A similar decay curve has been calculated for the business to business market segment for<br />
all journeys destinating within the core study area.<br />
Demand data for Public Transport was insufficient in both SETLUM and KTS to provide a smooth function<br />
describing how travel demand changes with generalised cost of travel. <strong>The</strong>refore a simple linear function was<br />
developed to assess Public Transport labour and business market catchments.<br />
Higher demand for car traffic enabled decay curves to be created based on car travel behaviour. <strong>The</strong> KTS model<br />
has a more finely grained zoning system and data that is more disaggregate than the SETLUM model, which<br />
means demand for different lengths of trips is well represented. Car decay curves were therefore produced using<br />
KTS generalised cost and demand data. <strong>The</strong> KTS and linear deterrence functions for car and Public Transport<br />
are outlined in Figure 2 overleaf.<br />
<strong>The</strong> <strong>Lower</strong> <strong>Thames</strong> <strong>Crossing</strong> <strong>Kent</strong> <strong>County</strong> <strong>Council</strong> ⏐ 11<br />
@ 2010 KPMG LLP, a UK limited liability partnership, is a subsidiary of KPMG Europe LLP and a member firm of the KPMG<br />
network of independent member firms affiliated with KPMG International Cooperative, a Swiss entity. All rights reserved.
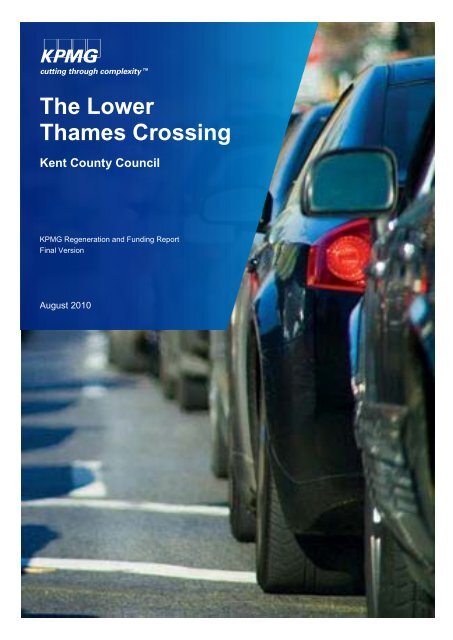
Figure 2: Willingness to travel by mode and journey purpose<br />
Percentage willing to travel<br />
100%<br />
90%<br />
80%<br />
70%<br />
60%<br />
50%<br />
40%<br />
30%<br />
20%<br />
10%<br />
0%<br />
0<br />
50<br />
100<br />
150<br />
200<br />
250<br />
300<br />
350<br />
<strong>The</strong> deterrence functions represent the pattern of behaviour of car commuters and car business travellers, using<br />
KTS for car travel and a linear function for public transport travel. It was assumed that willingness to travel of<br />
public transport users gradually falls as generalised travel time increases, to reach 0% for 1,000 minutes of<br />
generalised time. For car commute the decay curve shows that approximately 60% of car commuters accept a<br />
total daily commute of up to 150 generalised minutes. This reduces to just 10% for a daily commute of 350<br />
generalised minutes. For car business to business trips willingness to travel drops off at around 200 minutes to<br />
reach 0% at around 450 generalised minutes of travel.<br />
It has been assumed that the deterrence functions remain constant over time. If fuel, vehicle operating costs and<br />
fares rise in line with average income, this would be consistent with people spending the same share of their time<br />
and money on travel in future years.<br />
3.3.4 Calculating overall market sizes<br />
400<br />
Generalised cost (minutes)<br />
450<br />
500<br />
550<br />
600<br />
650<br />
700<br />
750<br />
800<br />
850<br />
900<br />
950<br />
1,000<br />
Car commute Car b2b PT commute and B2B<br />
<strong>The</strong> effective labour market for any of core study areas zone is calculated as the sum of people of working age in<br />
all origin zones willing to travel to that destination for work. <strong>The</strong> effective business to business markets are<br />
similarly calculated as the sum of all workplace jobs that can be reached from an origin using a deterrence<br />
function and value of time derived from observed business travel pattern.<br />
<strong>The</strong> <strong>Lower</strong> <strong>Thames</strong> <strong>Crossing</strong> <strong>Kent</strong> <strong>County</strong> <strong>Council</strong> ⏐ 12<br />
@ 2010 KPMG LLP, a UK limited liability partnership, is a subsidiary of KPMG Europe LLP and a member firm of the KPMG<br />
network of independent member firms affiliated with KPMG International Cooperative, a Swiss entity. All rights reserved.
Figure 3: Illustrative example of contribution of origin zone to effective labour market in destination zone<br />
B<br />
A<br />
y% willing<br />
to travel<br />
z working<br />
age<br />
residents<br />
x mins<br />
y * z people in effective<br />
labour market for zone A<br />
from zone B<br />
From the generalised cost of a journey to a particular zone it was then possible to use the corresponding decay<br />
curve to assess the share of people willing to travel to that location from every other zone. Summing the share of<br />
all people willing to travel from all other zones to the destination provides the measure of connectivity for that<br />
market segment.<br />
More formally:<br />
j<br />
MarketSize<br />
=<br />
∑<br />
i<br />
Π<br />
ij<br />
Ο<br />
i<br />
Where i represents the origin and j the destination and where:<br />
∏ij =<br />
Oi =<br />
Share of people willing to accept generalised cost based on the journey time between i and j; and<br />
Opportunities in the origin zone i<br />
3.4 Data sources<br />
<strong>The</strong> economic analysis requires a detailed examination of the levels of connectivity offered to local areas in North<br />
<strong>Kent</strong> and South Essex. This requires geographically disaggregate representations of journey options and the<br />
difficulty of travel for journeys north of the river, south of the river and across the river. <strong>The</strong>re are various<br />
transport models covering the areas to the north and the south of the existing Dartford crossing and potential new<br />
crossing points nearby. However none of them adequately capture local travel options on both sides of the river.<br />
This is mainly because the river currently represents a significant barrier to movement and the transport models<br />
developed have focussed on one side and only captured a limited representation of the other side.<br />
<strong>The</strong> analysis undertaken for this project has therefore been based on combining datasets from different transport<br />
models with different characteristics and should therefore be treated with caution.<br />
<strong>The</strong> <strong>Lower</strong> <strong>Thames</strong> <strong>Crossing</strong> <strong>Kent</strong> <strong>County</strong> <strong>Council</strong> ⏐ 13<br />
@ 2010 KPMG LLP, a UK limited liability partnership, is a subsidiary of KPMG Europe LLP and a member firm of the KPMG<br />
network of independent member firms affiliated with KPMG International Cooperative, a Swiss entity. All rights reserved.
3.4.1 Generalised cost<br />
Generalised costs have been sourced from the South Essex Transport and Land Use Model (SETLUM) and from<br />
the <strong>Kent</strong> <strong>Thames</strong>ide Model (KTS). Data and assistance on transport models was provided by Essex and <strong>Kent</strong><br />
<strong>County</strong> <strong>Council</strong>s.<br />
SETLUM contains 163 model zones. 110 of these are in Basildon, Thurrock, Castle Point, Rochford and<br />
Southend-on-Sea in Essex, 6 of these are in <strong>Kent</strong> and the remaining 47 are further afield. Matrices of generalised<br />
cost have been sourced from SETLUM for the 2001 base year for car and public transport trips for AM peak<br />
commute trips and interpeak business to business trips. <strong>The</strong> generalised costs include time costs, perceived<br />
inconvenience (for example public transport interchanges) and financial elements of costs such as vehicle<br />
operating costs, tolls and public transport fares. Where more than one public transport mode offers a viable<br />
alternative, the lowest generalised cost or ‘best path’ option has been selected.<br />
Figure 4: SETLUM model zone centroids in <strong>Thames</strong> Gateway area<br />
Romford<br />
Essex<br />
London<br />
Woolwich<br />
Grays<br />
Dartford<br />
Gravesend<br />
<strong>Kent</strong><br />
Gllingham<br />
KTS contains 590 model zones. <strong>The</strong> vast majority of these zones represent areas in <strong>Kent</strong> <strong>Thames</strong>ide with only a<br />
few model zones representing local areas in Essex. This is shown in Figure 5 overleaf.<br />
<strong>The</strong> <strong>Lower</strong> <strong>Thames</strong> <strong>Crossing</strong> <strong>Kent</strong> <strong>County</strong> <strong>Council</strong> ⏐ 14<br />
@ 2010 KPMG LLP, a UK limited liability partnership, is a subsidiary of KPMG Europe LLP and a member firm of the KPMG<br />
network of independent member firms affiliated with KPMG International Cooperative, a Swiss entity. All rights reserved.
Figure 5: KTS model zone centroids in <strong>Thames</strong> Gateway area<br />
Romford<br />
Essex<br />
London<br />
Woolwich<br />
Grays<br />
Dartford<br />
Gravesend<br />
<strong>Kent</strong><br />
Gllingham<br />
Cost data from these two models has been merged to create a representation of a disaggregate matrix of<br />
journeys with origins and destinations represented at ward level on both sides of the <strong>Thames</strong> in the districts of<br />
Basildon, Brentwood, Castle Point, Dartford, Gravesham, Medway, Rochford, Southend-on-Sea, Swale and<br />
Thurrock. Further afield, zones are represented using larger administrative areas such as districts/unitary<br />
authorities (e.g. London boroughs), counties (e.g. Suffolk) and regions (e.g. the South West). <strong>The</strong> zoning system<br />
is therefore consistent with UK administrative geography. This zoning system is shown in Figure 6 overleaf.<br />
<strong>The</strong> <strong>Lower</strong> <strong>Thames</strong> <strong>Crossing</strong> <strong>Kent</strong> <strong>County</strong> <strong>Council</strong> ⏐ 15<br />
@ 2010 KPMG LLP, a UK limited liability partnership, is a subsidiary of KPMG Europe LLP and a member firm of the KPMG<br />
network of independent member firms affiliated with KPMG International Cooperative, a Swiss entity. All rights reserved.
Figure 6: Centroids of geographical zoning system used for analysis<br />
Romford<br />
Essex<br />
London<br />
Woolwich<br />
Grays<br />
Dartford<br />
Gravesend<br />
<strong>Kent</strong><br />
Gllingham<br />
<strong>The</strong> core model areas consist of the districts of Medway, Dartford, Gravesham and Swale within <strong>Kent</strong> and of the<br />
districts of Southend-on-Sea, Thurrock, Basildon, Brentwood, Castle Point and Rochford in Essex. This area is<br />
covered at ward level in the modelling. A hinterland of zones has also been defined to enable the different labour<br />
markets and business to business trip catchments of these core zones to be estimated.<br />
To create the generalised journey time dataset for this model zoning, the following process was applied:<br />
1. Calculate the closest zone centroid in KTS to each model zone centroid used in the analysis;<br />
2. Create model zone to zone generalised cost matrices based on the closest KTS zone centroid to the model<br />
origin centroid and the closest KTS zone centroid to the model destination centroid;<br />
3. Repeat for SETLUM data to create the model zone matrices derived from the SETLUM model;<br />
4. Identify flows which use the existing bridge;<br />
5. For flows that are south of the river and do not use the bridge, use the KTS data as the best proxy for<br />
generalised cost;<br />
6. For flows that are north of the river and do not use the bridge, use the SETLUM data as the best proxy for<br />
generalised cost;<br />
7. For flows that travel south across the bridge, use the SETLUM cost from origin to the bridge plus the KTS<br />
cost from the bridge to the destination, plus a representation of bridge tolls; and<br />
8. For flows that travel north across the bridge, use the KTS cost from origin to the bridge plus the SETLUM cost<br />
from the bridge to the destination, plus a representation of bridge tolls.<br />
This approach provides a matrix of costs for travel on the north side of the river, the south side of the river and for<br />
cross river trips. However, for cross river trips the cost data is a hybrid from different sources and data for trips on<br />
the south side of the river is from a different source from trips in the north. <strong>The</strong> key similarities and differences<br />
between the models are as follows:<br />
<strong>The</strong> <strong>Lower</strong> <strong>Thames</strong> <strong>Crossing</strong> <strong>Kent</strong> <strong>County</strong> <strong>Council</strong> ⏐ 16<br />
@ 2010 KPMG LLP, a UK limited liability partnership, is a subsidiary of KPMG Europe LLP and a member firm of the KPMG<br />
network of independent member firms affiliated with KPMG International Cooperative, a Swiss entity. All rights reserved.
■ Both models share definitions of time periods, so for example, peak journeys represent the average hour<br />
between 7AM and 10AM.<br />
■ <strong>The</strong> SETLUM data represents 2001 while the KTS data represents 2005<br />
■ All times and costs have been expressed in 2001 prices and values<br />
Using this hybrid approach is unavoidable given the study timescales and budgets. <strong>The</strong> time and cost<br />
components of generalised cost have been made consistent as far as possible but nevertheless represent<br />
different underlying model assumptions. Figure 7 below shows the relationships between the car commuting<br />
generalised costs in KTS and SETLUM for comparable origins and destinations.<br />
Figure 7: Comparison of KTS and SETLUM car generalised costs, 2001 prices<br />
Generalised cost (pence)<br />
2,000<br />
1,800<br />
y = 1.7679x<br />
KTS<br />
1,600<br />
1,400<br />
1,200<br />
1,000<br />
800<br />
600<br />
400<br />
200<br />
Source: SETLUM and KTS models<br />
0<br />
0 200 400 600 800 1,000 1,200<br />
<strong>The</strong> comparable origins and destinations selected are based on cross river origin to destination trips where the<br />
centroids of both zones lie within 1km of each other. For these trips KTS shows consistently higher generalised<br />
costs than SETLUM. <strong>The</strong> best fit line shows that the KTS generalised costs is some 1.8 times higher than the<br />
SETLUM cost, although the two are closely related. More detailed analysis of differences between the models is<br />
presented in Appendix A. We recommend that a suitable transport model with suitable geographical<br />
representation to the north and south of the <strong>Thames</strong> is developed if the analysis of <strong>Lower</strong> <strong>Thames</strong> crossing<br />
options is to be progressed further.<br />
Journey times and costs have all been measured in pence using values of time from WebTAG to represent<br />
commuting and business to business travellers. <strong>The</strong> costs are taken to be the best available representation of<br />
generalised costs consistent with the most recent socioeconomic data available given the journey time and cost<br />
data available.<br />
3.4.2 Socioeconomic data<br />
SETLUM<br />
Population data has been sourced for each model zone from the Office for National Statistics experimental local<br />
area population statistics by quinary group. To represent labour markets, working age population data has been<br />
constructed using the quinary groups between 20-24 and 60-64 years old plus four fifths of the quinary age group<br />
15-19. <strong>The</strong> latest available data from the Office for National Statistics is for 2007.<br />
Workplace employment data by business sector has been collected from the Annual Business Inquiry. <strong>The</strong> latest<br />
available data is for 2008.<br />
<strong>The</strong> <strong>Lower</strong> <strong>Thames</strong> <strong>Crossing</strong> <strong>Kent</strong> <strong>County</strong> <strong>Council</strong> ⏐ 17<br />
@ 2010 KPMG LLP, a UK limited liability partnership, is a subsidiary of KPMG Europe LLP and a member firm of the KPMG<br />
network of independent member firms affiliated with KPMG International Cooperative, a Swiss entity. All rights reserved.
Data for 2010 has been constructed by applying the growth rates for the appropriate local authority sourced from<br />
the DfT’s National Trip End Model (NTEM) version 5.4 which provides forecast data for transport planning<br />
purposes. Data for the 2026 forecast year has been similarly constructed based on the NTEM datasets extracted<br />
using the TEMPRO software.<br />
3.4.3 Demand<br />
Demand data has been sourced from both the <strong>Kent</strong> <strong>Thames</strong>ide Model and the SETLUM model. <strong>The</strong>se data sets<br />
have been collected for commuting in the AM peak and business travel in the interpeak. For both models, this<br />
data was split by mode and by journey purpose. SETLUM data was collected for 2001 (the model base year) and<br />
for 2021, and KTS data for 2005 (again, the model base year) and 2025.<br />
<strong>The</strong> demand data has only been used to determine the relationship between demand and the generalised cost of<br />
travel for the different model segments and for assessing the generalised cost deterrence functions used in the<br />
modelling (see for example Figure 2).<br />
3.5 Assessing business location choice<br />
<strong>The</strong> relationship between employment density and connectivity was assessed using econometric techniques and<br />
other evidence for business location decision making.<br />
<strong>The</strong> relationships between connectivity and employment density have been investigated using linear regression<br />
formulations. This analysis has taken the form:<br />
Log(employment density) = f (ln(connectivity measures), ln(other variables))<br />
Where zones both north and south of the river have been considered in the same equation, a flag has been<br />
introduced in the regression analysis to distinguish between these. This allows the differences in connectivity due<br />
to model differences to be mitigated to some extent. However, given that the data has been drawn from two<br />
separate models, we have also considered equations that look separately at zones to the north of the river and<br />
zones to the south of the river.<br />
Two connectivity measures were tested: access to labour by road, and access to other business by road. Access<br />
to labour by public transport and access to other businesses by public transport were excluded from the analysis<br />
due to the dominance of car travel which makes understanding the importance of public transport connectivity<br />
more complex. <strong>The</strong> complexity of integrating public transport data from the KTS and SETLUM models also<br />
makes the analysis of public transport catchments less reliable.<br />
<strong>The</strong> only other variable considered as a driver of business location choice was proximity to the <strong>Thames</strong> ports<br />
(and historic <strong>Thames</strong> ports). This reflects the current and historic importance of the <strong>Thames</strong> in providing<br />
connectivity to markets by river and sea.<br />
Cross sectional analysis alone cannot determine causation. To determine the extent to which any links are causal<br />
requires analysis of time series data and analysis of lead and lag relationships. Such data is not available.<br />
Without a time series analysis causation must be judged based on the underlying theory. <strong>The</strong>re are reasons why<br />
one would expect causation to run in both directions. Businesses are likely to move to places where they have<br />
locational advantages which could come from better transport connectivity. However, high levels of employment<br />
are also likely to lead to higher levels of transport connectivity as infrastructure provision follows demand. In this<br />
analysis we present the results of what would occur if the statistical relationships did represent a causal<br />
relationship between changes in transport connectivity and changes in employment density. This is the same as<br />
the approach taken to measuring agglomeration by the Department for Transport.<br />
<strong>The</strong> relationships between car connectivity to businesses and labour and employment density were assessed.<br />
<strong>The</strong> model draws data from both the KTS and SETLUM models to estimate hybrid journey times. However, as<br />
there are differences between these models, we have separately conducted statistical analysis for zones north of<br />
<strong>The</strong> <strong>Lower</strong> <strong>Thames</strong> <strong>Crossing</strong> <strong>Kent</strong> <strong>County</strong> <strong>Council</strong> ⏐ 18<br />
@ 2010 KPMG LLP, a UK limited liability partnership, is a subsidiary of KPMG Europe LLP and a member firm of the KPMG<br />
network of independent member firms affiliated with KPMG International Cooperative, a Swiss entity. All rights reserved.
the river, zones south of the river and for all of the hybrid model zones taken together. <strong>The</strong>se different model<br />
formulations and datasets provide different findings for the strength of relationships between business location<br />
and car connectivity.<br />
Initial statistical tests found that business to business connectivity dominated the relationship, therefore labour<br />
market/commute connectivity was taken out of subsequent regressions tests. <strong>The</strong> results of the statistical<br />
analysis showed a coefficient of 0.76 for zones north of the river and 0.65 when assessing all zones together<br />
using the hybrid model . However, no statistically significant results were obtained for zones to the south of the<br />
river.<br />
In order to take into account variations in generalised time between KTS and SETLUM, an alternative model<br />
formulation was designed to treat connectivity levels on different sides of the river in a different way. <strong>The</strong><br />
alternative formulation returns an analogous coefficient of 0.46. It therefore does appear that some positive<br />
relationships exist between car connectivity and employment density, although a range of values have been used<br />
for forecasting. Further information on the regression analysis is provided in Appendix B.<br />
Different scenarios have been considered, according to the regression results explained above. <strong>The</strong> fixed land<br />
use estimate reflects the fact that in some model formulations, car connectivity does not show a statistically<br />
significant relationship with employment density. For this scenario it is assumed the distribution and quantum of<br />
employment remains unchanged. GVA impacts will therefore only be attributable to changes in productivity levels<br />
arising from agglomeration economies. <strong>The</strong> parameters used in modelling are shown in Table 1 below.<br />
Table 1: Model parameters<br />
Car connectivity to labour<br />
Car business to business connectivity<br />
markets<br />
Fixed land-use formulation 0.00 0.00<br />
Hybrid model formulation 0.65 0.00<br />
Alternative model formulation 0.46 0.00<br />
Note:<br />
In all model formulations, access to labour markets has been assumed to have a parameter of zero and hence not to play a role. This is because the statistical<br />
analysis has been unable to detect such a relationship. This may be partly because the business to business connectivity measures and the labour market<br />
connectivity measures are closely related and the statistical analysis has been unable to separate their impact.<br />
3.6 Considering relative connectivity and business mobility<br />
<strong>The</strong> cross sectional quantitative analysis provides evidence of the correlation between business location and<br />
connectivity. However, it is not true to say that a change in connectivity will simply result in a change in the<br />
number of workplace jobs or employment density.<br />
<strong>The</strong> analysis shows how connectivity affects the relative attractiveness of the different sites studied. Hence,<br />
changes in connectivity could either lead to redistribution of existing businesses or could result in businesses<br />
being attracted to the study area or discouraged from moving there. Hence applying the equation described<br />
above to forecast employment will tend to produce unconstrained employment forecasts that assume all change<br />
is due to change into or out of the study area and do not allow for this redistribution. <strong>The</strong> challenge then is to<br />
estimate the extent to which change in connectivity could lead to internal redistribution within the study area or to<br />
changes in employment to or from outside the core study area.<br />
To estimate the change in employment within the core study area, the degree of business mobility between city<br />
regions was assessed. Unfortunately, suitable dynamic studies of business mobility and relocation decisions do<br />
not exist. Instead, mobility was assessed by looking at the geographical distribution of businesses, and the<br />
proportion of footloose businesses – hypothesized as those that could take advantage of changes in the<br />
connectivity offered by different locations. Footloose businesses were deemed to be those that were not tied to<br />
serving a local market, but that served an inter-regional or international market and could relocate to take<br />
<strong>The</strong> <strong>Lower</strong> <strong>Thames</strong> <strong>Crossing</strong> <strong>Kent</strong> <strong>County</strong> <strong>Council</strong> ⏐ 19<br />
@ 2010 KPMG LLP, a UK limited liability partnership, is a subsidiary of KPMG Europe LLP and a member firm of the KPMG<br />
network of independent member firms affiliated with KPMG International Cooperative, a Swiss entity. All rights reserved.
advantage of changes in locational factors. Businesses serving local markets (such as grocery shops, hair<br />
dressers etc.) tend to be geographically tied to local markets.<br />
<strong>The</strong> analysis of business mobility was based on businesses in the main UK conurbations. To understand which<br />
businesses could be considered footloose, the number of jobs by business sectors per head of population was<br />
assessed. <strong>The</strong> area with the minimum ratio of employment per head of population in a certain sector was<br />
deemed to employ the minimum necessary to serve local markets and perform local functions. Regions which<br />
host a greater level of employment than the minimum in this business sector were deemed to host some<br />
employment which need not be located there and that is deemed to be footloose. Hence London has a high ratio<br />
of jobs in the financial services sector per head of population mainly because it has a developed financial<br />
services sector which exports nationally and internationally. <strong>The</strong> North East of England, by contrast, has a low<br />
number of jobs per resident in this sector reflecting the fact that most financial service sector activity is in retail<br />
banking. Any employment over this minimum required to serve the local population was deemed to be footloose<br />
and capable of moving between city regions to take advantage of changes in the business conditions that they<br />
offer. <strong>The</strong> socio-economic data on employment was sourced from the Office for National Statistics and split into<br />
thirteen business sectors and by city region. From this the share of employment that could be considered to be<br />
mobile between cities and hence which could be attracted to the study area was estimated.<br />
This analysis indicates that some 28% of jobs could be considered to be mobile at this level of geography. This<br />
percentage was applied to estimate the net change in total employment within the study area. However, this<br />
method suggests that as the geographic scope of the analysis increases, the number of jobs estimated to move<br />
in or out of the study area reduces. When comparing the north of the country with the Midlands and the South, a<br />
much more homogeneous pattern of economic activity was found. This indicates that many businesses are<br />
regionally clustered but that there is not very much difference in the industrial structure of these broad areas of<br />
the country. If applied at this higher level of geography only around 14% of jobs were found to be mobile at the<br />
level of the South (the area comprising the South East, London, the East of England and the South West).<br />
Consequently, as the geographic area considered increases a smaller share of the employment benefits are net<br />
at this level of geography and more are likely to be redistributed within this area. At a national level, the net<br />
impacts on employment from adopting this approach would be zero and all change would be due to redistribution<br />
around the country.<br />
Together, the parameters derived from the statistical analysis and the parameters in the mobility analysis form<br />
the basis of the forecasts of business relocation.<br />
3.7 Assessing agglomeration and productivity<br />
<strong>The</strong> changes in connectivity have been used to estimate changes in business productivity through agglomeration<br />
economies. Agglomeration refers to the process whereby businesses can gain a productivity benefit from being in<br />
an area of high economic density, for example from sharing a larger and more specialised pool of labour.<br />
<strong>The</strong> analysis is based on the approach defined by DfT’s in WEBtag unit 3.5.14 except that the demand weighted<br />
connectivity measures described in section 3.3 have been used as the measure of effective economic density.<br />
Demand weighted connectivity was estimated using the following assumptions:<br />
■ 90% of all trips are undertaken by car within the study area;<br />
■ 30% of car trips are made for business travel purposes.<br />
DfT agglomeration elasticities were applied to changes in weighted connectivity measures to obtain changes in<br />
productivity by zone. Table 2 below sets out the DfT agglomeration elasticities used for the analysis. It shows that<br />
for manufacturing industries for example, a 10% increase in effective density will increase productivity of<br />
manufacturing industries by 0.21%.<br />
<strong>The</strong> <strong>Lower</strong> <strong>Thames</strong> <strong>Crossing</strong> <strong>Kent</strong> <strong>County</strong> <strong>Council</strong> ⏐ 20<br />
@ 2010 KPMG LLP, a UK limited liability partnership, is a subsidiary of KPMG Europe LLP and a member firm of the KPMG<br />
network of independent member firms affiliated with KPMG International Cooperative, a Swiss entity. All rights reserved.
Table 2: DfT agglomeration elasticities<br />
Sector Manufacturing Construction<br />
Consumer<br />
services<br />
Producer services<br />
Agglomeration Elasticity 0.021 0.034 0.024 0.083<br />
Source:<br />
DfT webtag unit 3.5.14C – wider impacts economic dataset<br />
3.8 Testing scenarios<br />
A DoMinimum scenario has been created based on existing opportunities to travel and connectivity. Connectivity<br />
measures for each market segment and for the 183 core model zones have been calculated for this scenario.<br />
Connectivity measures are similarly calculated for three test scenarios. By comparing the connectivity results of<br />
the DoMinimum to the scenarios, the impacts upon connectivity and effective market sizes can be assessed. <strong>The</strong><br />
model then proceeds by:<br />
■ Applying elasticities derived from the statistical analysis to convert changes in connectivity into unconstrained<br />
changes in employment density by model zone;<br />
■ Converting these into estimates of unconstrained employment change within the model zones. Unconstrained<br />
employment change was obtained by applying the percentage change in employment density to base<br />
employment in each zone to obtain new employment results for the DoSomething scenario. <strong>The</strong> new<br />
employment figures were then subtracted from base employment to obtain the change in employment by<br />
zone;<br />
■ Constraining the total change in employment to reflect only firms which are deemed footloose at the level of<br />
the study area. Business mobility factors were then applied to take into account the variations in sectoral mix<br />
and business mobility by zone;<br />
■ Redistributing the constrained employment total according to the new patterns of connectivity within the core<br />
study area;<br />
■ Calculating the change in productivity per head based on agglomeration impacts; and<br />
■ Calculating overall changes in economic output likely within the zones within the study area based on<br />
changes in employment and productivity.<br />
<strong>The</strong> net GVA impact across the study area can also be affected by changes in the pattern of employment<br />
location. Businesses in different locations will have different productivity levels so businesses that relocate may<br />
see a change in productivity. This has been incorporated into the analysis. Changes in the pattern of business<br />
activity could also either intensify agglomeration impacts by concentrating business activity or dissipate<br />
agglomeration benefits as business locations become more dispersed. This second round impact on<br />
agglomeration through changes in land use has not been captured in the analysis.<br />
<strong>The</strong> <strong>Lower</strong> <strong>Thames</strong> <strong>Crossing</strong> <strong>Kent</strong> <strong>County</strong> <strong>Council</strong> ⏐ 21<br />
@ 2010 KPMG LLP, a UK limited liability partnership, is a subsidiary of KPMG Europe LLP and a member firm of the KPMG<br />
network of independent member firms affiliated with KPMG International Cooperative, a Swiss entity. All rights reserved.
4 Strategic economic and regeneration<br />
impacts<br />
4.1 <strong>The</strong> scenarios tested<br />
Data on the likely changes in journey times due to an additional river crossing was supplied by MVA. This<br />
captured potential changes in journey times between 26 zones representing areas on both sides of the river and<br />
further afield. We have been informed by MVA that this data is the result of indicative modelling and should be<br />
treated with caution.<br />
Drawing on this data from MVA, we have constructed three scenarios:<br />
■ A new crossing close to the existing crossing assuming that the only journey time benefits come from<br />
reductions in congestion at the existing crossing point;<br />
■ A new bridge crossing from Chadwell to Gravesham; and<br />
■ A new bridge crossing from Stanford-le-Hope to Eastern Gravesham.<br />
<strong>The</strong> location of the existing bridge and the two proposed crossing options are shown in Figure 8 below.<br />
Figure 8: indicative location of new crossing options<br />
Source: Assessment of <strong>Lower</strong> <strong>Thames</strong> <strong>Crossing</strong> Capacity, Gifford, MVA and Capita, November 2008<br />
<strong>The</strong> first of these options has been constructed based on the reductions in journey time modelled by MVA for<br />
travel across the existing crossing when new bridges are constructed downstream. <strong>The</strong> journey time saving in the<br />
data from MVA suggested the journey time savings shown in Table 3 below.<br />
<strong>The</strong> <strong>Lower</strong> <strong>Thames</strong> <strong>Crossing</strong> <strong>Kent</strong> <strong>County</strong> <strong>Council</strong> ⏐ 22<br />
@ 2010 KPMG LLP, a UK limited liability partnership, is a subsidiary of KPMG Europe LLP and a member firm of the KPMG<br />
network of independent member firms affiliated with KPMG International Cooperative, a Swiss entity. All rights reserved.
Table 3: Journey time change from decongesting existing crossing (represented by savings between zones 7 and 13 in MVA<br />
model), 2021<br />
Journey time saving for travel across existing crossing when new crossing is<br />
constructed<br />
Chadwell to Gravesham<br />
Stanford-le-Hope to Gravesham<br />
Southbound (1.18) (0.52)<br />
Northbound (1.09) (0.37)<br />
This suggests that journey time reductions of up to around one or one and a half minutes are possible on<br />
average across the existing crossing from reducing traffic flow. Based on this, the impact of saving an average of<br />
1 minute on all journeys across the existing bridge has been tested as a proxy for expanding capacity at the<br />
existing crossing point. <strong>The</strong> new crossings will also impact on speed and distance for certain car trips, which will<br />
have an impact on vehicle operating costs and total generalised time. <strong>The</strong>se have not been taken into account<br />
within the hybrid model calculations.<br />
4.2 Changes in business location<br />
Changes in the number of jobs within the study area have been calculated using the modelling framework. <strong>The</strong>se<br />
are presented in Table 4 for the three options tested.<br />
Table 4: Modelled changes in employment in the study area due to changes in connectivity provided by new <strong>Lower</strong> <strong>Thames</strong><br />
crossing options, 2021<br />
1 minute saving on existing<br />
crossing<br />
Modelled change in employment<br />
Fixed land use Hybrid model Alternative approach<br />
789 706<br />
Chadwell to Gravesham 6,265 5,294<br />
Stanford-le-Hope to Gravesham 4,471 3,884<br />
<strong>The</strong> changes in employment reflect modelled changes in employment in the study area. Employment impacts<br />
could range from 700 to 6,000 additional jobs within the area, depending on the elasticity assumptions and<br />
options assessed. <strong>The</strong>se do not necessarily reflect net changes in employment at a national level and may<br />
include significant elements of redistribution from areas outside of the core study area.<br />
4.3 Changes in productivity<br />
Analysis of agglomeration impacts suggests that changes in connectivity associated with the three options could<br />
be valued in 2021 as shown in Table 5.<br />
Table 5: Value of agglomeration benefits from <strong>Lower</strong> <strong>Thames</strong> crossing options, 2021, £m, 2002 prices<br />
Annual impact on GVA per job in study area,<br />
Option<br />
£m, 2002 prices<br />
1 minute saving on existing<br />
£4 (+0.01%)<br />
crossing<br />
Chadwell to Gravesham £30 (+0.05%)<br />
Stanford-le-Hope to Gravesham £22 (+0.04%)<br />
<strong>The</strong> <strong>Lower</strong> <strong>Thames</strong> <strong>Crossing</strong> <strong>Kent</strong> <strong>County</strong> <strong>Council</strong> ⏐ 23<br />
@ 2010 KPMG LLP, a UK limited liability partnership, is a subsidiary of KPMG Europe LLP and a member firm of the KPMG<br />
network of independent member firms affiliated with KPMG International Cooperative, a Swiss entity. All rights reserved.
4.4 Implications for economic output<br />
<strong>The</strong> implications for economic output of the potential changes in employment and productivity are shown in Table<br />
6 below.<br />
Table 6: Value of GVA impact from <strong>Lower</strong> <strong>Thames</strong> crossing options on study area, 2021, £m, 2002 prices<br />
1 minute saving on existing<br />
crossing<br />
Fixed land use Hybrid model Alternative approach<br />
£2m<br />
(+0.01%)<br />
Chadwell to Gravesham £15<br />
(+0.01%)<br />
Stanford-le-Hope to Gravesham £11<br />
(+0.04%)<br />
£45<br />
(+0.2%)<br />
£334<br />
(+1.1%)<br />
£250<br />
(+0.8%)<br />
£42<br />
(+0.1%)<br />
£296<br />
(+1.01%)<br />
£227<br />
(+0.8%)<br />
<strong>The</strong> marginal benefit of a new crossing which is further downstream could be up to around £300m per annum in<br />
additional economic output within the study area. Annual GVA impacts have been converted into net present<br />
values over the life of the asset, using DfT appraisal guidance. It was assumed:<br />
■ Annual benefits remain constant;<br />
■ An appraisal period of 60 years;<br />
■ A discount factor of 3.5% over the first thirty years, and 3% for subsequent years.<br />
No information was available to us on the future growth of toll income or journey time changes and this analysis<br />
assumes that these remain constant from 2021 onwards. Assumptions regarding changes in journey time<br />
savings will affect this analysis and it must therefore be treated with caution. <strong>The</strong> NPV values are presented in<br />
Table 7 below. Total discounted benefits range from £80m with a 1 minute journey time saving at the existing<br />
crossing, to £12.7bn for the proposed Chadwell to Gravesham <strong>Crossing</strong>.<br />
Table 7: Net Present Value of GVA impact from <strong>Lower</strong> <strong>Thames</strong> crossing options on study area over a 60 year period (£m, 2002<br />
prices)<br />
Fixed land use Hybrid model Alternative approach<br />
1 minute saving on existing<br />
£80 £1,700 £1,600<br />
crossing<br />
Chadwell to Gravesham £600 £12,700 £11,250<br />
Stanford-le-Hope to Gravesham £400 £9,500 £8,600<br />
Existing practice in wider transport appraisal captures some of the scheme impacts that affect the real economy,<br />
such as improving business connectivity for existing businesses and reducing business transport costs. For<br />
example, a single new job moving into an area may support an additional GVA of some £40,000 per annum.<br />
Assuming a value of business time of £20 per hour, this is equivalent to 24,000 business trip time savings of five<br />
minutes each.<br />
At the same time, other aspects that affect economic outcomes via changes in land use or change in the sectoral<br />
mix of businesses are usually not included. Targeting economic growth means adopting an approach that takes<br />
an alternative view from current practice. <strong>The</strong> methodology applied for this report aims to capture these different<br />
outcomes.<br />
<strong>The</strong> <strong>Lower</strong> <strong>Thames</strong> <strong>Crossing</strong> <strong>Kent</strong> <strong>County</strong> <strong>Council</strong> ⏐ 24<br />
@ 2010 KPMG LLP, a UK limited liability partnership, is a subsidiary of KPMG Europe LLP and a member firm of the KPMG<br />
network of independent member firms affiliated with KPMG International Cooperative, a Swiss entity. All rights reserved.
5 Costs<br />
This Section considers the estimated costs of the New <strong>Lower</strong> <strong>Thames</strong> crossing Project from a conventional<br />
Design and Build perspective and then indicates how those estimated costs may translate into a Unitary Charge<br />
under a PPP arrangement. All costs are quoted exclusive of VAT.<br />
5.1 Capital costs<br />
5.1.1 Scheme Definition<br />
<strong>The</strong> analysis assumes that the <strong>Lower</strong> <strong>Thames</strong> crossing is specified as being located East of Gravesham to the<br />
South, and around Stanford-le-Hope to the North. <strong>The</strong> route will be approximately 12km long, and will connect<br />
the A13 and A2. <strong>The</strong> scheme will also include a link to the M25. It is further assumed that the crossing is a<br />
bridge, as described in the MVA study, 2008, and that it will be tolled.<br />
5.1.2 Capital Costs<br />
<strong>The</strong> estimated capital costs of the <strong>Lower</strong> <strong>Thames</strong> crossing (known as Option C) have been taken from the<br />
previous MVA study as follows:<br />
Table 8: MVA study’s estimate of capital costs, 2008 prices<br />
Description<br />
Cost (£’bn,<br />
2008 prices)<br />
Construction 0.6<br />
Allowance for Optimism Bias at<br />
0.4<br />
60%<br />
Total Capital Cost per MVA<br />
1.0<br />
study<br />
Source: MVA Capita Gifford, 2008<br />
<strong>The</strong> construction cost includes an allowance for linking the bridge to the M25, but it is unclear whether the<br />
scheme costs include for environmental and land related costs.<br />
<strong>The</strong> cost estimates presented above are shown in 2008 prices. <strong>The</strong> level of optimism bias stated, 60%, is<br />
consistent with advice given by the Department for Transport (DfT) in respect of non-standard civil engineering<br />
projects 4 .<br />
As with all forecast costs in the MVA report, we have not seen any underlying analysis and therefore are unable<br />
to comment on their appropriateness. In particular, we are unsighted on any land related costs, which may be<br />
material.<br />
5.2 Maintenance costs<br />
Maintenance costs have been considered by the MVA study. A provisional assessment estimates these at<br />
approximately 0.75% of the capital cost, which is equivalent to £8m per annum in 2008 prices. In reality,<br />
maintenance costs will fluctuate, with a mixture of routine maintenance and irregular life cycle improvements. We<br />
have not made any attempt to verify the accuracy of these estimates.<br />
4 Procedures for Dealing with Optimism Bias in Transport Planning (Bent Flyvbjerg, 2004) see paragraph 3.5.5 of DfT’s<br />
transport appraisal guidance (http://www.dft.gov.uk/webtag/documents/expert/unit3.5.9.php)<br />
<strong>The</strong> <strong>Lower</strong> <strong>Thames</strong> <strong>Crossing</strong> <strong>Kent</strong> <strong>County</strong> <strong>Council</strong> ⏐ 25<br />
@ 2010 KPMG LLP, a UK limited liability partnership, is a subsidiary of KPMG Europe LLP and a member firm of the KPMG<br />
network of independent member firms affiliated with KPMG International Cooperative, a Swiss entity. All rights reserved.
5.3 Unitary charge under a PPP<br />
<strong>The</strong> exact form of the scheme, if it were to be procured as a Public Private Partnership, is subject to further<br />
discussion. <strong>The</strong> principal issues affecting the level of the Unitary Charge relate to:<br />
1. Concession duration;<br />
2. Exact construction cost;<br />
3. Risk allocation; and<br />
4. Cost of finance.<br />
If the New <strong>Lower</strong> <strong>Thames</strong> crossing were to be delivered as an availability-based PPP transaction (that is, without<br />
full transfer to the private sector of demand risk), the annual cost could be in the range of 10 – 15% of the capital<br />
cost 5 (i.e. £100 - £150m p.a.), net of any capital contributions made. This Unitary Charge would be subject to<br />
annual indexation, assumed at 1% for a 30 year operating period from the opening of the new road (i.e. a 34 year<br />
total concession period). For the purposes of PPP financial analysis it is assumed that all land and compensation<br />
costs are outside of the PPP concession, since the factors primarily affecting the land availability are likely to be<br />
controlled by <strong>Kent</strong> and Essex <strong>County</strong> <strong>Council</strong>. Also, typically, land purchase through a PPP does not offer value<br />
for money.<br />
One way in which the level of the Unitary Charge from the PPP concession company could be significantly<br />
reduced would be for capital injections to be made into the concession during the construction period, thereby<br />
reducing the extent of the borrowing requirement of the concession company. <strong>The</strong>se capital injections could be<br />
funded through the Prudential Borrowing regime or third party grants.<br />
5 This reflects our experience of the normal ratio of capital to annual cost under a PPP and does not reflect financial modelling<br />
undertaken for this project.<br />
<strong>The</strong> <strong>Lower</strong> <strong>Thames</strong> <strong>Crossing</strong> <strong>Kent</strong> <strong>County</strong> <strong>Council</strong> ⏐ 26<br />
@ 2010 KPMG LLP, a UK limited liability partnership, is a subsidiary of KPMG Europe LLP and a member firm of the KPMG<br />
network of independent member firms affiliated with KPMG International Cooperative, a Swiss entity. All rights reserved.
6 Toll revenues<br />
6.1 Toll revenues from a Stanford-le-Hope to Gravesham crossing<br />
<strong>The</strong> proposed crossing is assumed to be tolled, with fares aligned to those on the Dartford crossing. <strong>The</strong> MVA<br />
report produced traffic forecasts for this scheme for the year 2021, assumed to be shortly after the completion of<br />
the scheme. <strong>The</strong>se assumptions are repeated below for illustrative purposes only.<br />
Table 9: Traffic and revenue forecasts for 2021 quoted in the MVA study<br />
Indicator traffic assumptions<br />
Annual traffic flow, 2021<br />
13.8m crossings p.a.<br />
Average toll £2.00<br />
Indicative income statement for 2021<br />
GBPm<br />
Income 27.6<br />
Provision for optimism bias and risk (5.9)<br />
Operations costs (4.1)<br />
Maintenance costs (7.6)<br />
Amount available for debt service,<br />
conventional procurement<br />
10.0<br />
Source: MVA Capita Gifford, 2008<br />
Key features of this projection are that:<br />
a) <strong>The</strong> above revenue forecast is an estimate at a point in time, and makes no comment about traffic flows at<br />
other times. This means that whilst the amount available for debt service under a conventional procurement is<br />
forecast at £10m per annum in 2021, the amount available in 2031 in real terms could be substantially<br />
different. 2021 is likely to represent traffic flows in the first years of operations. Traffic flows in subsequent<br />
years will be influenced by the scale and timing of economic growth expected in the <strong>Thames</strong> Gateway area,<br />
and the attraction of new developments into the area.<br />
b) It appears that some 35 to 40% of the traffic forecast on the new bridge is diverted from the existing Dartford<br />
crossing 6 . Understanding this dynamic will be critical to understanding the overall revenue potential of the<br />
crossings in a combined context and to understanding the DfT perspective on the value for money of<br />
investment. In particular, looking further out in time, demand growth may be further constrained on the<br />
existing crossing implying a larger share of traffic on the new crossing and more induced traffic and toll<br />
income.<br />
c) <strong>The</strong> tolls assumed are an extrapolation of current levels for Dartford, so exclude rises in excess of inflation.<br />
Relative to other major bridges, tolls are low: depending on the time of the crossing and the payment method,<br />
car tolls on the Dartford crossing range from nil to £1.50. It may be argued that it is currently priced as a<br />
public service rather than on a commercial basis. Commercialising tolls is likely to have a major impact on<br />
revenue generation.<br />
d) A PPP operator will typically Design, Build, Finance, Operate and maintain the crossing, for which the<br />
operator will be compensated by a Unitary Charge. As this Payment will include the costs of operations and<br />
maintenance, the relevant income to apply to the PPP as a contribution towards the unitary charge is the risk<br />
adjusted revenue amount, £21.7m sourced from MVA’s work.<br />
6 Parson Brinckerhoff show that AM peak hour two way demand flows excluding HGVs fall from 13,500 to 12,100 on the<br />
existing crossings compared to 3,800 on the new bridge.<br />
<strong>The</strong> <strong>Lower</strong> <strong>Thames</strong> <strong>Crossing</strong> <strong>Kent</strong> <strong>County</strong> <strong>Council</strong> ⏐ 27<br />
@ 2010 KPMG LLP, a UK limited liability partnership, is a subsidiary of KPMG Europe LLP and a member firm of the KPMG<br />
network of independent member firms affiliated with KPMG International Cooperative, a Swiss entity. All rights reserved.
Based on these initial projections, tolling of the new crossing at currently assumed levels will only make a modest<br />
contribution to the costs of the scheme, whether delivered conventionally or as a PPP.<br />
6.2 Relationship with the existing Dartford crossing<br />
In order to maximise the benefits of the <strong>Lower</strong> <strong>Thames</strong> <strong>Crossing</strong> notably on congestion relief and network<br />
resilience, the existing and proposed new crossings should be considered together as part of the same traffic<br />
corridor. It is therefore essential to take into account the existing Dartford crossing within the tolling regime, in<br />
order to avoid traffic diversion, and undermine the aspiration of a bifurcation for traffic heading from the North and<br />
East of London to the Channel Ports.<br />
This section considers the impact of tolling to support the <strong>Lower</strong> <strong>Thames</strong> crossing and the impact of the Dartford<br />
crossing to the scheme. <strong>The</strong> Dartford crossing represents an impediment to maximising toll revenues on the<br />
crossing but also a potential source of revenue support. <strong>The</strong> way in which the scheme is developed to interact<br />
with Dartford will be critical to securing success, not least because of the impact that a new crossing could have<br />
on a stable source of government revenue.<br />
6.2.1 Financial support from the Dartford crossing<br />
Tolls on the Existing Dartford crossing<br />
<strong>The</strong> Dartford - Thurrock River crossing is one of Europe's most heavily used estuarial crossings and complex<br />
traffic management systems. Traversing the <strong>Thames</strong> between Dartford and Thurrock, the crossing forms a vital<br />
link in the M25 London orbital. <strong>The</strong> crossing is currently owned by the Secretary of State for Transport. ‘Connect<br />
Plus’ are responsible for the day to day operations of the crossing on behalf of the Highways Agency, as part of a<br />
contract for the Design, Build, Finance and Operation of the upgrade of the whole of the M25.<br />
<strong>The</strong> Dartford crossing carries well over 50 million vehicles per year. Charges for use of the crossing are currently<br />
levied under the Transport Act 2000. <strong>The</strong>re are currently discounts for local users, and those using more efficient<br />
payment methods (DART-Tag). <strong>The</strong> crossing generated net proceeds for the Government of £42.9m in 2008/9.<br />
DfT has recently undertaken studies aimed at evaluating options to sell the crossing (primarily the revenue<br />
stream attached to it) to a third party, either outright or for a pre-determined duration in exchange for a capital<br />
receipt. This follows the inclusion of the Dartford crossing on the Operational Efficiency Programme asset list.<br />
Such a sale would affect DfT’s ability to deliver future capacity, as a purchaser is likely to require protection<br />
against the impact of such future capacity on the Dartford revenue stream. <strong>The</strong>re remains a risk that the crossing<br />
may still be sold, but for the purposes of this report it is assumed that such a sale will not occur in the immediate<br />
future.<br />
<strong>The</strong> economic analysis has shown that the tolls act in a certain way as a local tax which restricts the regeneration<br />
potential of the study area: a scenario without tolls on the existing bridge was run, which indicated a potential<br />
increase in local employment by around 2,000, and additional annual economic output of over £115m when tolls<br />
were taken away. As the capital cost of the bridge has been paid for, an argument could be made that the net<br />
operating surplus of the existing bridge should accrue to local authorities who currently feel the impact of the toll,<br />
and who could use the receipts of the existing bridge to fund a new crossing along the <strong>Thames</strong>.<br />
If this option was to be considered, the existing crossing revenue could contribute to around half of the<br />
construction costs, and significantly improve the funding case for the proposed new crossing.<br />
<strong>The</strong> existing tolls pass to the Department for Transport, so it cannot be assumed that these revenues will be<br />
made available to the <strong>Lower</strong> <strong>Thames</strong> crossing. It is understood, for instance, that both the Conservative and<br />
Liberal Democrat manifestos allude to the revenue being made available for other purposes, such as ‘seeding’ a<br />
‘Green Investment Bank’. It is possible, moreover, that DfT may seek to protect the aggregate level of revenue<br />
and therefore seek compensation for any traffic shift to the new crossing. However, it is also possible that if a<br />
<strong>The</strong> <strong>Lower</strong> <strong>Thames</strong> <strong>Crossing</strong> <strong>Kent</strong> <strong>County</strong> <strong>Council</strong> ⏐ 28<br />
@ 2010 KPMG LLP, a UK limited liability partnership, is a subsidiary of KPMG Europe LLP and a member firm of the KPMG<br />
network of independent member firms affiliated with KPMG International Cooperative, a Swiss entity. All rights reserved.
compelling economic case is made for the <strong>Lower</strong> <strong>Thames</strong> crossing and it is deemed to be of strategic national<br />
importance, then DfT may agree to allocate some or all of the revenues from the Dartford crossing or other<br />
equivalent capital grants to the new scheme and/or agree to raise tolls significantly beyond the current levels.<br />
Impact of raising tolls<br />
<strong>The</strong> impact of raising tolls will be to potentially significantly increase the affordability of a new scheme. <strong>The</strong><br />
assumption made thus far is that the level of tolls will rise in line with RPI, meaning that by 2021, average tolls will<br />
be £2.00. If the toll was to rise to a level comparable to the Severn River crossing (effectively currently £5.50 for a<br />
return for a car, meaning £2.75 each way), and assuming no material loss of patronage, then the additional<br />
revenues in 2021 for <strong>Lower</strong> <strong>Thames</strong> crossing and Dartford crossing could be in the order of £8m and £36m,<br />
respectively 7 .<br />
At an aggregate level, such income from <strong>Lower</strong> <strong>Thames</strong> crossing and Dartford crossing would be likely to<br />
materially assist in the funding of the proposed development.<br />
We recommend that <strong>Kent</strong> <strong>County</strong> <strong>Council</strong> considers developing this option in further detail to allow an informed<br />
decision to be made regarding its potential benefits and practicality. We consider this to be the main opportunity<br />
available to generate significant additional revenue to support the new <strong>Lower</strong> <strong>Thames</strong> crossing project.<br />
A higher level of tolls than is currently the case may have an impact on the communities of North <strong>Kent</strong> and South<br />
Essex. <strong>Kent</strong> <strong>County</strong> <strong>Council</strong> could therefore consider a local community discount arrangement that minimises<br />
such an impact. This may preserve many of the local regeneration benefits of the scheme although would reduce<br />
the toll income available to fund the scheme.<br />
6.2.2 Toll revenues from the <strong>Lower</strong> <strong>Thames</strong> crossing<br />
Less than 20% of the scheme costs can be serviced from the revenue forecasts provided to us based on tolls on<br />
the new crossing equal to current tolls at Dartford. Based on preliminary traffic modelling and tolling based on<br />
current levels, estimated net toll revenue has been forecast by MVA to be in the region of £10m per annum, rising<br />
in real terms in line with growth in traffic flows. This amount includes a provision of 25% for optimism bias on the<br />
forecasting. Depending on the procurement approach taken, concession length and market sentiment, £10m of<br />
risk-adjusted revenue will support around £0.1bn of debt for a 30 year loan.<br />
A separate challenge is that revenue growth is a function of inflation, extra-inflationary price rises and traffic<br />
growth driven by wider economic conditions. <strong>The</strong> information prepared thus far is therefore insufficient for us to<br />
comment on these factors.<br />
<strong>The</strong> capability of the project to raise tolls materially beyond those charged on the Dartford crossing is unlikely as<br />
the crossings are sufficiently close as to represent substitutes for each other (notwithstanding the impact of<br />
constrained capacity). It furthermore follows that the crossings may benefit from being operated under some form<br />
of cooperation agreement, ensuring that both tolling and maintenance are synchronised.<br />
7 This assumes that tolls are increased by a percentage reflecting the difference between a standard car trip toll on the Dartford<br />
crossing and the Severn River crossing and assumes that no traffic is priced off. <strong>The</strong>se assumptions are applied for illustrative<br />
purposes and we recommend that further work is undertaken to determine likely impacts of changes to tolls.<br />
<strong>The</strong> <strong>Lower</strong> <strong>Thames</strong> <strong>Crossing</strong> <strong>Kent</strong> <strong>County</strong> <strong>Council</strong> ⏐ 29<br />
@ 2010 KPMG LLP, a UK limited liability partnership, is a subsidiary of KPMG Europe LLP and a member firm of the KPMG<br />
network of independent member firms affiliated with KPMG International Cooperative, a Swiss entity. All rights reserved.
7 Funding<br />
7.1 Distinguishing funding from finance<br />
A distinction should be drawn between funding and finan.0ce. At its simplest, a funder ultimately pays for the<br />
costs of a scheme while finance is a mechanism for moving funding around in time. Finance must be paid back.<br />
Either conventional procurement or a PPP approach can be part of a combined funding package. Other capital<br />
contributions, for example from the Regional Funding Allocation, local contributions or third parties could be used<br />
to reduce the PPP availability payment or reduce the level of borrowing required for construction. High levels of<br />
capital grant can reduce the ability to transfer risk from the public sector and would require careful consideration<br />
as part of a PPP arrangement.<br />
Revenue income streams, for example those that could be captured from increases in the local tax base (such as<br />
from supplementary business rates or additional council tax income) could be used to repay borrowing or<br />
contribute to availability payments under a PPP arrangement.<br />
7.2 Funding from Department for Transport<br />
Central government funding for regional transport schemes is primarily provided through the Regional Funding<br />
Allocation. <strong>The</strong>se funds are to be allocated across a range of initiatives. <strong>The</strong> relative size of the scheme suggests<br />
that RFA provision will be insufficient for the challenge of financing the <strong>Lower</strong> <strong>Thames</strong> crossing.<br />
Alternatively, the DfT may choose to provide direct capital funding, either in the form of committed capital<br />
payments, or PPP (PFI) credits. An example of the former is the 10 year capital commitment made to Transport<br />
for London and in particular the funding promised in respect of Crossrail. An example of the latter is the Street<br />
lighting PPPs.<br />
Such funding will be predicated on a persuasive business case being prepared that demonstrates that the <strong>Lower</strong><br />
<strong>Thames</strong> crossing meets wider government social, economic and regeneration objectives, and the availability of<br />
public funds.<br />
<strong>The</strong> 10 year indicative Regional Funding Allocation for transport for the South East is subscribed until 2019. <strong>The</strong><br />
current indicative funding line is likely to come under pressure as government expenditure is reduced over<br />
coming years.<br />
<strong>The</strong> Department could alternatively choose to fund the scheme from national budgets reflecting its strategic<br />
national role.<br />
7.3 European support<br />
TEN-T Funding<br />
<strong>The</strong> European Union is able to provide support to schemes that aim to promote interconnectivity under the Trans-<br />
European Transport Network (TEN-T) scheme. Funding is in the form of a grant and would therefore aid<br />
affordability, and is typically available up to 10% of eligible costs (exceptionally, more). €8 billion has been<br />
attributed by the EU to the TEN-T programme for 2007-2013.<br />
It is possible that the proposed crossing will be eligible for TEN-T funding. <strong>The</strong> existing Dartford-Thurrock<br />
crossing is currently part of the TEN-T network, therefore it is likely that the proposed new crossing could also be<br />
designated a TEN-T.<br />
<strong>The</strong> <strong>Lower</strong> <strong>Thames</strong> <strong>Crossing</strong> <strong>Kent</strong> <strong>County</strong> <strong>Council</strong> ⏐ 30<br />
@ 2010 KPMG LLP, a UK limited liability partnership, is a subsidiary of KPMG Europe LLP and a member firm of the KPMG<br />
network of independent member firms affiliated with KPMG International Cooperative, a Swiss entity. All rights reserved.
ERDF funding<br />
<strong>The</strong> European Regional Development Fund is a scheme promoting regional competiveness, growth and<br />
employment, and is allocated through the Regional Development Agencies. <strong>The</strong> focus of funding is currently<br />
towards areas of urban deprivation and the impact of this may be seen by the relative levels of support: <strong>The</strong><br />
South-East England Development Agency has £22m allocated in respect of ERDF up to 2013, whereas<br />
Yorkshire First will receive €584m for the same period.<br />
<strong>The</strong> quantum of funding available from ERDF suggests that it is unlikely to make a material difference to the<br />
affordability of the project.<br />
7.4 Lorry road user charging<br />
Lorry Road User Charging (LRUC) has been contemplated by the Government, but was subsequently<br />
abandoned in 2005. Nevertheless the scheme has several theoretical benefits that mean that it may be<br />
readopted 8 and so an outline of the scheme is provided here.<br />
<strong>The</strong> purpose of the scheme was to, “ensure that lorry operators from overseas pay their fair share towards the<br />
cost of using UK roads<br />
9 .” In 2003, HM Customs and Excise reported that approximately £300m in tax revenues<br />
were lost, arising from untaxed diesel fuel shipped into the UK from foreign commercial vehicles 10 .<br />
Options have been explored for how the tax would be charged, including mileage, congestion impact, type of<br />
road used or time of day, and the scheme’s intention was that all commercial vehicles over a pre-determined<br />
weight would be taxed under this scheme. However, since UK based commercial road users currently also pay<br />
road tax and fuel duty, the tax incurred on fuel duty would be credited against the tax paid under the LRUC<br />
scheme.<br />
<strong>The</strong> proposed <strong>Lower</strong> <strong>Thames</strong> crossing, an arterial route between the channel ports and the UK hinterland, would<br />
be a route used by a significant number of foreign vehicles. If this scheme is readopted, promoters of the <strong>Lower</strong><br />
<strong>Thames</strong> crossing would need to make a case to government to use a share of this income to fund the project.<br />
<strong>The</strong> introduction of lorry road user charging is likely to be unpopular with the freight industry and improving key<br />
freight routes may need to be part of the combined offer to the freight industry. In this case, the eastern side of<br />
the M25, as one of the most congested motorway routes in the country, would have a good claim to be prioritised<br />
for investment. This would further boost the strategic national case for investment in a <strong>Lower</strong> <strong>Thames</strong> crossing to<br />
relieve capacity constraints.<br />
7.5 Capturing economic benefits<br />
Other sources of possible funds towards meeting the costs of the New <strong>Lower</strong> <strong>Thames</strong> crossing project are based<br />
on obtaining external contributions from key third party beneficiaries of the new bridge. This could include those<br />
involved in land development in the crossing area or existing businesses within a catchment that benefits from<br />
the new infrastructure.<br />
Assuming transport can lead to changes in land use, providing a new crossing over the <strong>Thames</strong> will have a<br />
positive impact on employment within the local area, which could be between 700 and 6,000 new jobs depending<br />
on the scheme and the model assumptions. <strong>The</strong> employment and productivity growth could raise economic<br />
output of the study area by over £300m per year in 2021. Additional economic growth could be linked to funding<br />
8 Such as: www.roadtransport.com/.../Tories-confirm-backing-for-lorry-road-user-charging.htm<br />
9 Budget 2002, Economic and Fiscal Strategy Report, HM Treasury.<br />
10 http://hm-treasury.gov.uk/d/lorryria240305.pdf<br />
<strong>The</strong> <strong>Lower</strong> <strong>Thames</strong> <strong>Crossing</strong> <strong>Kent</strong> <strong>County</strong> <strong>Council</strong> ⏐ 31<br />
@ 2010 KPMG LLP, a UK limited liability partnership, is a subsidiary of KPMG Europe LLP and a member firm of the KPMG<br />
network of independent member firms affiliated with KPMG International Cooperative, a Swiss entity. All rights reserved.
mechanisms such as tax increment financing and raising finance through developer contributions and Community<br />
Infrastructure Levy tools.<br />
Section 106 of the 1990 Town and Country Planning Act enables local authorities to require new developments to<br />
contribute to the infrastructure demands that they create. In practice, this legislation has been very flexible and<br />
has been applied to transport infrastructure. Around 40 per cent of major developments in the South East include<br />
a negotiated Section 106 contribution compared to around 7.5 per cent in the North East. <strong>The</strong> coincidence of<br />
major development and transport expenditure is important with Section 106 contributions paid at the time of<br />
development and ring fenced for particular purposes set out in the negotiated agreement. <strong>The</strong> Community<br />
Infrastructure Levy (CIL) regulations come into force in Spring 2009 and allow local authorities to levy a standard<br />
charge on developments if they choose. <strong>The</strong> new government has said that it would replace CIL, although the<br />
alternative is not yet clear. CIL would work in conjunction with Section 106. Section 106 demands are expected to<br />
be scaled back if CIL is also introduced. CIL is limited to infrastructure expenditure and “should be used to fund<br />
the infrastructure needs of development contemplated by the development plan for the area, not to remedy<br />
existing deficiencies.” 11 Also, when agreeing the now defunct Planning Gain Supplement, the government agreed<br />
in principle that developer contributions should be limited to direct impacts and mitigation (along with affordable<br />
housing provisions). This may limit the scope for securing developer funding from developers over a wider area.<br />
Using assumptions on employment densities set out in the English Partnerships guide to employment densities<br />
this would be the additional employment numbers would require up to 170,000 sqm of new development to be<br />
built 13 . No standard rates are available for calculating CIL contributions per square metre of floor space. In the<br />
absence of this, it has been assumed that an average charge of between £10 and £30 per square metre of<br />
commercial development could be achieved, implying total CIL or similar contributions of between £1.7m and<br />
£5m based on an additional 6,000 jobs. This is insignificant compared to the capital cost of the new bridge.<br />
Combined with issues of geographic scope, developer contributions are likely to be an insignificant part of the<br />
funding package for a new bridge.<br />
Overall GVA impacts of the crossing options will also have implications for tax revenues. A tentative assumption<br />
would be that 35% of the GVA impacts are captured in taxation and could thus contribute up to £117m per<br />
annum (35% of £334m) on new tax income from local businesses within the study area. Business rate income<br />
makes up around 5% of national tax income<br />
14<br />
implying additional business rate income of around £6m per<br />
annum within the study area. This could represent a more significant funding stream if it can be captured.<br />
However, again issues of geographic scope limit the potential for securing this increased tax income.<br />
<strong>The</strong>se impacts may not be net at a national level as new employment could be attracted from outside of the study<br />
area, although the smaller agglomeration benefits set out in the fixed land use scenario can be considered as net<br />
national, as these benefits are new and not redistributed from other parts of the country.<br />
Tax increment financing or supplementary business rate approaches could both be used to appropriate some of<br />
these benefits. However, imposing any general business levy is likely to be seen as unacceptable because of its<br />
negative impact on the local and regional economy. <strong>The</strong>se will need to be explored more fully once the scheme<br />
reaches a full business case development stage.<br />
12 ,<br />
11 <strong>The</strong> Community Infrastructure Levy, Department for Communities and Local Government, August 2008<br />
12 Arup Economics and Planning, “Employment Densities: A Full Guide”- Final Report, English Partnerships and the Regional<br />
Development Agencies, July 2001<br />
13 Assuming 26.5 square metres of floorspace per employee based on an average of 34 for general industrial buildings and 19<br />
for general offices based on English Partnerships guidance<br />
14 Source: HMT Public finances databank, 27th May 2010 (http://www.hm-treasury.gov.uk/psf_databank.htm)<br />
<strong>The</strong> <strong>Lower</strong> <strong>Thames</strong> <strong>Crossing</strong> <strong>Kent</strong> <strong>County</strong> <strong>Council</strong> ⏐ 32<br />
@ 2010 KPMG LLP, a UK limited liability partnership, is a subsidiary of KPMG Europe LLP and a member firm of the KPMG<br />
network of independent member firms affiliated with KPMG International Cooperative, a Swiss entity. All rights reserved.
8 Procurement and financing options<br />
8.1 Introduction<br />
This section considers two of the most common methods of procurement for a major capital scheme of the scale<br />
of the <strong>Lower</strong> <strong>Thames</strong> crossing. It is not an exhaustive evaluation and should be treated as a starting point for<br />
further discussion.<br />
<strong>The</strong> decision on how the crossing is procured will have a significant impact on the scheme, particularly in respect<br />
of costs, risks and future flexibility. <strong>The</strong> decision should therefore be aligned to the strategic intent of <strong>Kent</strong> <strong>County</strong><br />
<strong>Council</strong> and its delivery partners, and driven by value for money considerations and the delivery team’s attitude<br />
towards the potential risks of the project.<br />
Finance can be provided from a number of sources. If procured through a local authority, borrowing is most likely<br />
to come from the PWLB. This is typically relatively cheap because it requires sovereign backing, but also has<br />
some limitations. In particular, it cannot be arranged at pre-booked rate of interest, although borrowing in<br />
advance of need can reduce this risk to some extent.<br />
An alternative is borrowing from the European Investment Bank (EIB). This is an autonomous body set up to<br />
finance capital investment furthering European integration by promoting EU policies. Projects considered for EIB<br />
financing within the European Union must contribute to one or more of a number of objectives, one of which is<br />
the TEN-T Network. <strong>The</strong> main attraction of using the EIB is its ability to offer substantial amounts of capital<br />
(generally up to 50% of the debt funding requirement) at a cost of finance significantly lower than that of<br />
commercial lenders. However, the EIB is not generally a risk-taking lender and usually requires a bank guarantee<br />
(or similar security) on all project lending at least until periods of significant risk have passed, i.e. at least until the<br />
end of the construction period. It also has the advantage that interest rates can be agreed in advance. This<br />
source of financing should be considered as part of developing the overall financing package and could be used<br />
to manage risks and reduce financing costs.<br />
Under a PPP arrangement, finance can come from a range of sources including commercial banks. However,<br />
this would be arranged by the PPP concessionaire.<br />
If promoted by a local authority, the capital costs of the <strong>Lower</strong> <strong>Thames</strong> crossing of around £1bn would be beyond<br />
the capability of both <strong>Kent</strong> and Essex <strong>County</strong> <strong>Council</strong>’s to fund out of their revenue account. It follows that the<br />
scheme would need to be funded either by the Highways Agency from national funding sources or by increasing<br />
the level of debt held by a local authority promoter.<br />
Local authorities are permitted to source loans under the Prudential Borrowing rules. This would make a<br />
significant addition to existing borrowings. For example, <strong>Kent</strong> <strong>County</strong> <strong>Council</strong>’s current borrowings lie around<br />
£1bn, and so if financed by <strong>Kent</strong> <strong>County</strong> <strong>Council</strong> through Prudential Borrowing the scheme would approximately<br />
double its debt and create a material risk for the council and its council tax payers.<br />
<strong>The</strong> rules for Local Authority borrowing were primarily set out under <strong>The</strong> Local Government Act 2003, and which<br />
permit local authorities to borrow for capital investment purposes. Crucially, it allows authorities to determine their<br />
own programmes for capital investment, without formal central government direction. Instead, the authority sets<br />
out a capital investment plan that is affordable, prudent and sustainable in line with the Chartered Institute of<br />
Public Finance and Accountancy (CIPFA) Prudential Code.<br />
<strong>The</strong> cost of funds borrowed is very low, typically 0.3% more than the cost of government gilts (for fixed rate<br />
borrowing sourced through the Public Works Loan Board, an executive body of the UK Government), or 0.3%<br />
more than the cost of Inter-Bank lending rates (‘LIBOR’) for commercial loans. This is because Local Authorities<br />
have the statutory obligation to prepare a balanced budget, and must therefore modify their taxation and/or<br />
<strong>The</strong> <strong>Lower</strong> <strong>Thames</strong> <strong>Crossing</strong> <strong>Kent</strong> <strong>County</strong> <strong>Council</strong> ⏐ 33<br />
@ 2010 KPMG LLP, a UK limited liability partnership, is a subsidiary of KPMG Europe LLP and a member firm of the KPMG<br />
network of independent member firms affiliated with KPMG International Cooperative, a Swiss entity. All rights reserved.
expenditure to ensure that this is the case. <strong>The</strong> term of lending (‘tenor’) can be considerable, and thirty to fifty<br />
years is often seen.<br />
Prudential Borrowing is therefore a potential source of financing for the scheme, to be paid back from toll<br />
revenues or other council receipts. <strong>The</strong> funding remains a loan, however, and this means that the limit of<br />
borrowing available is defined by the Prudential Code’s Affordability criteria. <strong>Kent</strong> <strong>County</strong> <strong>Council</strong> will need to<br />
agree with the District Auditor as to its affordability limit, and almost certainly also with HM Treasury, given the<br />
scale of the borrowing envisaged.<br />
Interest rate risk<br />
A secondary issue is that of interest rate risk: interest rates fluctuate and there is a risk that the rates available at<br />
the time of borrowing will be greater than the rate forecast in the decision business case. This risk can be partmitigated<br />
by part pre-funding (that is, borrowing the funds in advance of their need). This practice has been<br />
adopted for example by Transport for London and the Greater Manchester Integrated Transport Authority. <strong>The</strong><br />
funds could be reinvested into government gilts. Such an approach would require agreement in advance from the<br />
<strong>Council</strong>’s auditor.<br />
PPP and funding<br />
A major advantage of private sector funding is the level of scrutiny that banks and rating agencies offer to the<br />
scheme. Such bodies combine commercial expertise and a privileged insight with an objective interest in<br />
protecting their loans. Such self-interest means that lenders will flag issues and will deploy specialists to rectify<br />
them at a very early stage.<br />
In the context of a PPP, this means that the risk of failure of delivering the crossing is diminished.<br />
<strong>The</strong> public sector could stimulate this benefit without the use of PPP by obtaining a credit rating for <strong>Kent</strong> <strong>County</strong><br />
<strong>Council</strong>. This approach has been used by Transport for London, rated AA by Standard and Poor’s and Aa2 by<br />
Moody’s in connection with their Medium Term Notes issued 2004. <strong>The</strong>se bonds were issued at a commercial<br />
rate. <strong>The</strong> challenge for <strong>Kent</strong> is that the strategy adopted by TfL is very mature, is part of a multi billion pound<br />
programme and represents substantial ongoing costs. TfL is the only local authority that has taken this path on<br />
account of these challenges.<br />
Conclusion<br />
<strong>The</strong> <strong>Council</strong> in theory has access to low cost financing for the scheme, but the size of the project, potential<br />
difficulty in demonstrating that the borrowing would fall under prudential borrowing rules and interest rate risk<br />
make its availability somewhat difficult, and again acts as an indicator for preferring a PPP based solution.<br />
8.2 Review of the project from a procurement perspective<br />
8.2.1 Understanding of the scope of the project<br />
<strong>The</strong> proposed <strong>Lower</strong> <strong>Thames</strong> crossing project is for a permanent structure crossing the River <strong>Thames</strong>, together<br />
with access to the M25 and connectivity to regional trunk roads. <strong>The</strong> project will require maintenance, and it is<br />
assumed that these costs will not be supported by the Highways Agency. It is further assumed that the crossing<br />
will be tolled, in line with the levels charged on the Dartford crossing. <strong>The</strong>re is therefore no inherent reason why<br />
an output-based specification could not be defined.<br />
8.2.2 Asset ownership and the scheme promoter<br />
<strong>The</strong>re are no major road structures in the UK that are permanently owned by the private sector (the M6 toll<br />
motorway, for instance is to be handed back to the public sector in 2054), therefore the option for the bridge to be<br />
a permanently owned private sector enterprise is discounted for now. If the option of permanent private sector<br />
<strong>The</strong> <strong>Lower</strong> <strong>Thames</strong> <strong>Crossing</strong> <strong>Kent</strong> <strong>County</strong> <strong>Council</strong> ⏐ 34<br />
@ 2010 KPMG LLP, a UK limited liability partnership, is a subsidiary of KPMG Europe LLP and a member firm of the KPMG<br />
network of independent member firms affiliated with KPMG International Cooperative, a Swiss entity. All rights reserved.
ownership is to be explored, its economics are likely to be closely aligned to a long term concession where the<br />
private sector bears demand risk.<br />
<strong>The</strong> public sector ownership of the asset could lie with the Highways Agency or with one of the local <strong>County</strong><br />
<strong>Council</strong>s or a combination of these through a joint arrangement. We have not made any assumptions about who<br />
the ultimate owner would be and have considered situations in which either the Highways Agency or a local<br />
authority acted as scheme promoter, concentrating on a situation in which <strong>Kent</strong> <strong>County</strong> <strong>Council</strong> acted as scheme<br />
promoter.<br />
8.2.3 Scale<br />
<strong>The</strong> proposed scheme is very substantial, considerably more expensive than either the proposed Mersey<br />
Gateway or second Severn River crossing. MVA’s estimates suggest costs somewhat greater than £1bn (before<br />
consideration of inflation between 2008 and actual construction). <strong>The</strong> cost therefore of detailed contract<br />
development or forming a programme office will be dwarfed by those of the capital programme. Procurement<br />
approaches such as PPP may therefore be appropriate in an environment where public funding is becoming ever<br />
more scarce.<br />
8.2.4 Separability of the project components<br />
<strong>The</strong> project is likely to contain several components, including, inter alia:<br />
■ Construction of the bridge, including access roads and enabling works;<br />
■ Restoration of the Environment, for instance in respect of the SSSI to the South;<br />
■ Maintenance of the infrastructure following completion; and<br />
■ Policy and operations of tolling.<br />
With the possible exception of the environmental and enabling works, these components do not appear to require<br />
one form of procurement over another.<br />
8.2.5 Risk<br />
This financial review pre-assumes that all specification and governance issues are agreed at the point of delivery<br />
of the Outline Business Case and therefore that the risks contemplated are those related to construction and<br />
operations.<br />
<strong>The</strong> general response to risks are that they should be transferred to the party with the best ability to manage the<br />
risk at the lowest cost, shared, insured or managed internally. <strong>The</strong> procurement approach adopted will guide<br />
which of these is most relevant for the scheme. Based on the initial information made available to KPMG, notably<br />
the studies performed for DfT and the MVA study, the project bears several project specific risks, of which the<br />
two of the most significance are as follows:<br />
■ Design and Construction risk. This is the risk that the crossing is delivered behind schedule and/or over<br />
budget, or that it fails to meet its design objectives. <strong>The</strong> scheme is large and unique relative to other schemes<br />
procured in the UK. It follows that this risk will be material, so it is suggested that this risk should be managed<br />
either through full risk transfer (such as through a PPP) or through a sharing mechanism (such as found with<br />
a delivery partner approach).<br />
■ Demand risk. This is the risk that the traffic volume out-turn and associated revenue is not in line with the<br />
traffic projections. Green-field projects are particularly susceptible to this risk, as are schemes conceived for<br />
political or strategic 15 objectives. <strong>The</strong> scheme complements an existing (congested) crossing, and so demand<br />
15 Flyvbjerg, B (2005): How inaccurate are Demand Forecasts in Public Works Projects. Journal of the American Planning<br />
Association.<br />
<strong>The</strong> <strong>Lower</strong> <strong>Thames</strong> <strong>Crossing</strong> <strong>Kent</strong> <strong>County</strong> <strong>Council</strong> ⏐ 35<br />
@ 2010 KPMG LLP, a UK limited liability partnership, is a subsidiary of KPMG Europe LLP and a member firm of the KPMG<br />
network of independent member firms affiliated with KPMG International Cooperative, a Swiss entity. All rights reserved.
is neither established nor green-field, but current negative private sector sentiment towards demand risk<br />
means that even prudent traffic forecasts are treated with caution.<br />
Consideration of the preferred approach to demand risk will be one of the key issues in selection of procurement<br />
route and structure.<br />
8.3 Conventional procurement and delivery partner approaches<br />
Conventional procurement refers to a range of approaches, with the common feature of the authority exerting<br />
direct influence over the design and build of the infrastructure and treating asset delivery and the subsequent<br />
operational performance as distinct activities.<br />
<strong>The</strong> delivery partner approach is where a private sector partner has responsibility for project development (taking<br />
significant project risk) but has a less direct role in service provision. <strong>The</strong> delivery partner is rewarded according<br />
to meeting performance and cost efficiency milestones.<br />
Such options may offer some degree of flexibility for specifying the infrastructure, setting tolls and operating the<br />
assets. If taken forward by local authorities, it also offers a straightforward approach to financing the project since<br />
the promoter would typically borrow funds from the Public Works Loan Board (PWLB), and if Central Government<br />
later chose to adopt the crossing, transfer of ownership would be straightforward. <strong>The</strong> approach is also<br />
compatible with the awarding of a service contract to a toll operator for the crossing.<br />
<strong>The</strong> major risk feature of this approach is the lower level of construction risk that will be transferred to the private<br />
sector compared to a PPP scheme, which means that the impact of cost over-runs to the promoter would be<br />
serious. <strong>The</strong> project’s budget matches <strong>Kent</strong> <strong>County</strong> <strong>Council</strong>’s annual budget and it follows that if costs overrun,<br />
the impact to the county council, who is obliged to approve a balanced budget, would be severe. Financing the<br />
scheme will also be a challenge since the costs of debt service will not be matched by a mature income stream.<br />
A local authority promoter will need to present a mature financial case to its auditors, demonstrating that future<br />
rather than current toll revenues will finance the scheme. This is a complex process, but the case has been<br />
successfully made by Transport for London and is being made by Greater Manchester PTE in relation to other<br />
schemes.<br />
In summary, this option offers high flexibility, and potentially a low cost of borrowing, but it requires the immediate<br />
development of world-class technical capabilities, possibly in concert with a specialist partner. It however<br />
exposes the promoter to substantial levels of construction risk that may be unacceptable.<br />
8.4 Public Private Partnership<br />
PPPs are joint working arrangements between the public and private sectors and in theory represent a continuum<br />
of procurement strategies. In the context of this report, however, PPP means the delivery and operation of the<br />
bridge infrastructure through a concession arrangement, with a negotiated risk sharing arrangement with the<br />
public sector and private sector financing. It is furthermore assumed that the arrangement is long term, and in the<br />
context of this scheme, the duration could be from 30 to 50 years in length.<br />
<strong>The</strong> main features of such a PPP are that the crossing is built and operated by a stand-alone company, owned by<br />
private sector ‘sponsors’. Changes require pre-embedding in a long-term service contract or are subject to<br />
negotiation, meaning that the arrangement can be somewhat inflexible. <strong>The</strong> counter of the inflexibility is that the<br />
private sector operator has considerable clarity over how the scheme will look over a long period of time and that<br />
clarity should lead to a focus on long-term efficiency: a so-called whole life perspective. <strong>The</strong> commercial<br />
contracts also require considerable detail and this detail often leads to high procurement costs: the matching<br />
benefit is that a high level of detail about construction and operations tends to reduce risk. Finally, financing is<br />
primarily from specialist project finance banks, and these banks will undertake very significant due diligence on<br />
<strong>The</strong> <strong>Lower</strong> <strong>Thames</strong> <strong>Crossing</strong> <strong>Kent</strong> <strong>County</strong> <strong>Council</strong> ⏐ 36<br />
@ 2010 KPMG LLP, a UK limited liability partnership, is a subsidiary of KPMG Europe LLP and a member firm of the KPMG<br />
network of independent member firms affiliated with KPMG International Cooperative, a Swiss entity. All rights reserved.
the proposals, and will either employ or are specialists in asset management, and will intervene if the project<br />
appears to be off schedule.<br />
<strong>The</strong> benefits and issues of PPP are summarised in the table 10 below:<br />
Table 10: Key advantages of a PPP, compared to conventional procurement<br />
Benefits<br />
Ability to spread cost over lifetime of asset<br />
Risk transfer<br />
Detailed specification ensures that assets deliver<br />
desired output<br />
Predictability of payments assists long-term<br />
planning<br />
Focus on value for money over lifetime of asset<br />
Strong performance incentives ensure asset<br />
delivery<br />
Bank/bond funding provides high level of project<br />
governance.<br />
Challenges<br />
Cost of procuring the asset can be higher than is<br />
procured directly<br />
Risk transfer needs to be carefully evaluated to<br />
ensure value for money<br />
Cost of bid process is high and procurement process is<br />
longer than for conventional procurement<br />
PPP requires a stable environment where there are<br />
limited public sector uncertainties post contract<br />
signing (Financial Close)<br />
Inflexibility<br />
Requirement to carefully calibrate performance<br />
mechanism<br />
Bank/bond debt sourced through PPP is high cost.<br />
<strong>The</strong> decision as to how to procure the <strong>Lower</strong> <strong>Thames</strong> crossing is a complex one and will affect the costs of the<br />
scheme and its likelihood of commercial success. We recommend that a twin-track approach is maintained up to<br />
the point of approval of the Outline Business Case (a point that is some way away), with continuous re-evaluation<br />
of how risks are shared and external finance is sourced. In accordance with HM Treasury guidance the final<br />
decision should be predicated on the perceived value for money delivered by the options and will need to pass<br />
quantitative and qualitative tests for value for money<br />
<strong>The</strong> <strong>Lower</strong> <strong>Thames</strong> <strong>Crossing</strong> <strong>Kent</strong> <strong>County</strong> <strong>Council</strong> ⏐ 37<br />
@ 2010 KPMG LLP, a UK limited liability partnership, is a subsidiary of KPMG Europe LLP and a member firm of the KPMG<br />
network of independent member firms affiliated with KPMG International Cooperative, a Swiss entity. All rights reserved.
Appendix A – Comparison of SETLUM and<br />
KTS costs<br />
<strong>The</strong> following graphs illustrate the differences in KTS and SETLUM model outputs. <strong>The</strong> comparisons use KTS<br />
and SETLUM zones that are geographically close to each other, the centroids of the zones used in the<br />
comparison being within 1km of each other. This enabled us to compare a trip from an origin to a destination in<br />
KTS that is very similar to an origin to destination trip in SETLUM. KTS consistently provides journey time and<br />
cost elements that are higher than SETLUM.<br />
Figure 9 below shows that operating cost assumptions are very different, KTS vehicle operating costs being on<br />
average 2.3 times higher than SETLUM costs.<br />
Figure 9: Comparison of KTS and SETLUM car vehicle operating costs, AM peak, 2001 prices<br />
Vehicle operating costs (pence)<br />
1,000<br />
900<br />
y = 2.316x<br />
800<br />
700<br />
KTS<br />
600<br />
500<br />
400<br />
300<br />
200<br />
100<br />
0<br />
0 50 100 150 200 250 300 350 400 450<br />
SETLUM<br />
Source:<br />
KTS and SETLUM models<br />
Figure 10 and Figure 11 (overleaf) show that car in vehicle time and generalised costs are more closely related,<br />
although KTS produces journey times and generalised costs that are still on average 1.4 and 1.7 times higher<br />
than SETLUM respectively.<br />
<strong>The</strong> <strong>Lower</strong> <strong>Thames</strong> <strong>Crossing</strong> <strong>Kent</strong> <strong>County</strong> <strong>Council</strong> ⏐ 38<br />
@ 2010 KPMG LLP, a UK limited liability partnership, is a subsidiary of KPMG Europe LLP and a member firm of the KPMG<br />
network of independent member firms affiliated with KPMG International Cooperative, a Swiss entity. All rights reserved.
Figure 10: Comparison of KTS (2005) and SETLUM (2001) car in-vehicle time, AM peak<br />
Travel time (minutes<br />
120<br />
100<br />
y = 1.470x<br />
80<br />
KTS<br />
60<br />
40<br />
20<br />
0<br />
0 10 20 30 40 50 60 70 80<br />
SETLUM<br />
Source:<br />
KTS and SETLUM models<br />
Figure 11: Comparison of KTS (2005) and SETLUM (2001) car generalised costs, AM peak<br />
Generalised cost (pence)<br />
2,000<br />
1,800<br />
y = 1.7679x<br />
1,600<br />
1,400<br />
1,200<br />
KTS<br />
1,000<br />
800<br />
600<br />
400<br />
200<br />
0<br />
0 200 400 600 800 1,000 1,200<br />
SETLUM<br />
Source:<br />
KTS and SETLUM models<br />
<strong>The</strong> Figure 12 and Figure 13 below indicate that KTS and SETLUM AM peak PT travel time and generalised<br />
costs are more closely related than the modelled car journey times, KTS producing journey times for PT that are<br />
1.2 times higher than SETLUM, and generalised cost outputs that are broadly in line with SETLUM.<br />
<strong>The</strong> <strong>Lower</strong> <strong>Thames</strong> <strong>Crossing</strong> <strong>Kent</strong> <strong>County</strong> <strong>Council</strong> ⏐ 39<br />
@ 2010 KPMG LLP, a UK limited liability partnership, is a subsidiary of KPMG Europe LLP and a member firm of the KPMG<br />
network of independent member firms affiliated with KPMG International Cooperative, a Swiss entity. All rights reserved.
Figure 12: Comparison of KTS (2005) and SETLUM (2001) public transport travel time, AM peak<br />
Travel time (minutes)<br />
300<br />
250<br />
y = 1.1638x<br />
200<br />
KTS<br />
150<br />
100<br />
50<br />
0<br />
0 50 100 150 200 250<br />
SETLUM<br />
Source:<br />
KTS and SETLUM models<br />
Figure 13: Comparison of KTS (2005) and SETLUM (2001) public transport generalised cost, AM peak, 2001 prices<br />
Generalised cost (pence)<br />
4,000<br />
3,500<br />
y = 1.0153x<br />
3,000<br />
2,500<br />
KTS<br />
2,000<br />
1,500<br />
1,000<br />
500<br />
0<br />
0 500 1,000 1,500 2,000 2,500 3,000 3,500 4,000<br />
SETLUM<br />
Source:<br />
KTS and SETLUM models<br />
<strong>The</strong> <strong>Lower</strong> <strong>Thames</strong> <strong>Crossing</strong> <strong>Kent</strong> <strong>County</strong> <strong>Council</strong> ⏐ 40<br />
@ 2010 KPMG LLP, a UK limited liability partnership, is a subsidiary of KPMG Europe LLP and a member firm of the KPMG<br />
network of independent member firms affiliated with KPMG International Cooperative, a Swiss entity. All rights reserved.
Appendix B – Statistical analysis<br />
Table 11 sets out the results of the initial regression analysis using the hybrid model. It shows a negative<br />
relationship between employment density and car connectivity to labour markets and a positive relationship to car<br />
connectivity to business to business markets. This is counterintuitive and reflects the fact that car connectivity to<br />
labour is related to car connectivity to other businesses. <strong>The</strong> natural log of car connectivity to labour markets and<br />
the natural log of car connectivity to other businesses have a correlation coefficient of 55%.<br />
<strong>The</strong> other findings from this regression are that the distance from a <strong>Thames</strong> port (reflecting the influence of river<br />
transport and maritime trade) is a statistically significant predictor of economic density. <strong>The</strong> negative sign<br />
indicates that as distance from a <strong>Thames</strong> port increases, employment density tends to reduce. Finally the ‘South’<br />
and the ‘North’ parameters in this equation reflect the equation intercepts, to take into account the differences in<br />
the calculation of connectivity between the Northern and Southern zones.<br />
Table 11: Relationship between car connectivity and employment density, 2008, all zones<br />
Regression statistics<br />
Multiple R 98%<br />
R Square 96%<br />
Adjusted R Square 96%<br />
Standard Error 1<br />
Observations 183<br />
Coefficients<br />
t Stat<br />
connectivity measure (Employment: car) - 0.68 - 2.90<br />
connectivity measure (B2B: car) 0.70 5.05<br />
Distance from, <strong>Thames</strong> port, km - 0.44 -3.14<br />
North 10.19 3.24<br />
South 7.01 2.26<br />
As connectivity to labour has a counter intuitive sign and is related to car connectivity to other businesses, it was<br />
then removed from the regression equation. For the southern zones, northern zones and all model zones<br />
considered together, this yielded the following three equations.<br />
Table 12: Relationship between car connectivity to other business and employment density, 2008, all zones<br />
Regression statistics<br />
Multiple R 98%<br />
R Square 96%<br />
Adjusted R Square 95%<br />
Standard Error 1<br />
Observations 183<br />
<strong>The</strong> <strong>Lower</strong> <strong>Thames</strong> <strong>Crossing</strong> <strong>Kent</strong> <strong>County</strong> <strong>Council</strong> ⏐ 41<br />
@ 2010 KPMG LLP, a UK limited liability partnership, is a subsidiary of KPMG Europe LLP and a member firm of the KPMG<br />
network of independent member firms affiliated with KPMG International Cooperative, a Swiss entity. All rights reserved.
Coefficients t Stat P-value<br />
connectivity measure (B2B: car) 0.65 4.67 0%<br />
Distance from, <strong>Thames</strong> port, km - 0.27 - 2.09 4%<br />
North 1.74 1.43 15%<br />
South - 0.66 - 0.40 69%<br />
Table 12 above shows the results for all model zones taken together. This shows that there is a positive and<br />
statistically significant relationship between car connectivity to other businesses and employment density. <strong>The</strong><br />
regression results presented below show the difference in findings when considering the northern and southern<br />
zones separately<br />
Table 13: Relationship between car connectivity to other business and employment density, 2008, southern zones<br />
Regression statistics<br />
Multiple R 98%<br />
R Square 95%<br />
Adjusted R Square 93%<br />
Standard Error 1<br />
Observations 82<br />
Coefficients<br />
t Stat<br />
connectivity measure (B2B: car) 0.02 0.04<br />
Distance from, <strong>Thames</strong> port, km - 0.65 - 2.70<br />
South 6.97 1.52<br />
Table 13 shows the regression results for the southern model zones (where journey times have mainly been<br />
sourced from KTS data). This shows that business to business connectivity is not a significant driver of<br />
employment density.<br />
Table 14: Relationship between car connectivity to other business and employment density, 2008, northern zones<br />
Regression statistics<br />
Multiple R 98%<br />
R Square 97%<br />
Adjusted R Square 95%<br />
Standard Error 1<br />
Observations 101<br />
Coefficients<br />
t Stat<br />
connectivity measure (B2B: car) 0.76 5.54<br />
Distance from, <strong>Thames</strong> port, km - 0.09 - 0.48<br />
South 0.54 0.45<br />
<strong>The</strong> <strong>Lower</strong> <strong>Thames</strong> <strong>Crossing</strong> <strong>Kent</strong> <strong>County</strong> <strong>Council</strong> ⏐ 42<br />
@ 2010 KPMG LLP, a UK limited liability partnership, is a subsidiary of KPMG Europe LLP and a member firm of the KPMG<br />
network of independent member firms affiliated with KPMG International Cooperative, a Swiss entity. All rights reserved.
Table 14 shows that in the Northern zones, car connectivity to businesses is a significant driver of employment<br />
density with a T-Statistic of 5.54. This indicates that, if no other uncaptured variables are also correlated with car<br />
business to business connectivity, we can be more than 99% certain that the statistical relationship between<br />
these two variables is positive. In this equation, the distance from a <strong>Thames</strong> port is negatively correlated,<br />
although insignificant.<br />
In order to take into account the variation in connectivity between the northern and southern zones more<br />
consistently, an alternative formulation was developed which considered whether connectivity in zones north of<br />
the river is better expressed as a multiple of connectivity in southern zones rather than having a different<br />
intercept. <strong>The</strong> formulation of this equation was therefore:<br />
■ Employment density = A+B*C*ln(car B2B connectivity)+D*ln(distance from <strong>Thames</strong> ports)<br />
■ Where C = 1 for southern zones but solved for northern zones to minimise the model error<br />
<strong>The</strong> other parameter assumed to have an impact on employment density was distance from <strong>Thames</strong> Ports. <strong>The</strong><br />
equation was optimised by providing the equation parameters that minimised the sum of the squared errors. This<br />
formulation generated the parameters outlined in Table 15 below. This equation produces a slightly better<br />
statistical fit than the hybrid model equation set out above.<br />
Table 15: relationship between car connectivity to other businesses and employment density – alternative formulation<br />
Parameter<br />
Coefficient<br />
A – Intercept 1.50<br />
B – Car B2B 0.46<br />
C – North multiplier 1.51<br />
D – Distance from, <strong>Thames</strong> ports, km -0.32<br />
<strong>The</strong> <strong>Lower</strong> <strong>Thames</strong> <strong>Crossing</strong> <strong>Kent</strong> <strong>County</strong> <strong>Council</strong> ⏐ 43<br />
@ 2010 KPMG LLP, a UK limited liability partnership, is a subsidiary of KPMG Europe LLP and a member firm of the KPMG<br />
network of independent member firms affiliated with KPMG International Cooperative, a Swiss entity. All rights reserved.
@ 2010 KPMG LLP, a UK limited liability partnership, is a subsidiary of KPMG Europe LLP<br />
and a member firm of the KPMG network of independent member firms affiliated with<br />
KPMG International Cooperative, a Swiss entity. All rights reserved.<br />
<strong>The</strong> information contained herein is of a general nature and is not intended to address the<br />
circumstances of any particular individual or entity. Although we endeavour to provide<br />
accurate and timely information, there can be no guarantee that such information is<br />
accurate as of the date it is received or that it will continue to be accurate in the future. No<br />
one should act on such information without appropriate professional advice after a thorough<br />
examination of the particular situation.<br />
<strong>The</strong> KPMG name, logo and ‘cutting through complexity’ are registered trademarks or<br />
trademarks of KPMG International.