Commuting patterns within Hertfordshire (based on the 23001 ...
Commuting patterns within Hertfordshire (based on the 23001 ...
Commuting patterns within Hertfordshire (based on the 23001 ...

Create successful ePaper yourself
Turn your PDF publications into a flip-book with our unique Google optimized e-Paper software.
<str<strong>on</strong>g>Commuting</str<strong>on</strong>g> <str<strong>on</strong>g>patterns</str<strong>on</strong>g><br />
Rati<strong>on</strong>ale behind <strong>the</strong> project<br />
Living in <str<strong>on</strong>g>Hertfordshire</str<strong>on</strong>g>, it seemed a sensible locati<strong>on</strong> in which to study journey to work <str<strong>on</strong>g>patterns</str<strong>on</strong>g> for a number of reas<strong>on</strong>s:<br />
1. The local planning office have provided access to census data and boundary maps which are supplemented by <strong>the</strong>ir own surveys<br />
and reports (see appendix).<br />
2. Years of local knowledge make it easier to interpret and explain general <str<strong>on</strong>g>patterns</str<strong>on</strong>g> and discrepancies <str<strong>on</strong>g>within</str<strong>on</strong>g> <strong>the</strong> general informati<strong>on</strong>.<br />
3. It seemed a sensible choice to start of with data relating to <strong>the</strong> whole county (working at a macro scale) and <strong>the</strong>n to home in <strong>on</strong><br />
individual settlements where more subtle nuances came into play in additi<strong>on</strong> to <strong>the</strong> broad trends identified at county level.<br />
4. Two settlements were chosen Stevenage and Watford, because <strong>the</strong>y are two of <strong>the</strong> largest settlements in <str<strong>on</strong>g>Hertfordshire</str<strong>on</strong>g>, <strong>the</strong>y have<br />
an almost identical total labour force, <strong>the</strong>y are found at opposite ends of <strong>the</strong> county and <strong>on</strong>e is a traditi<strong>on</strong>al town (Watford) while <strong>the</strong><br />
o<strong>the</strong>r is a planned new town (Stevenage).<br />
The focus for investigati<strong>on</strong> came from <strong>the</strong> data provided by <strong>the</strong> 2001 census and restricti<strong>on</strong>s <strong>on</strong> data available limited <strong>the</strong> study to a number of<br />
areas of interest:<br />
1. Flows of commuters between areas, both into and out of. In particular do <strong>the</strong> c<strong>on</strong>cepts of distance decay and <strong>the</strong> ideas of gravity<br />
models come into play? What o<strong>the</strong>r influences appear to be operating?<br />
2. Method of travel to work and distances travelled pose some interesting data (as well as throwing up some apparent anomalies).<br />
3. Sectors of industry and <strong>the</strong>ir relative importance in different areas.
<str<strong>on</strong>g>Commuting</str<strong>on</strong>g> <str<strong>on</strong>g>patterns</str<strong>on</strong>g> <str<strong>on</strong>g>within</str<strong>on</strong>g> <str<strong>on</strong>g>Hertfordshire</str<strong>on</strong>g> (<str<strong>on</strong>g>based</str<strong>on</strong>g> <strong>on</strong> <strong>the</strong> 2001 census data).<br />
<str<strong>on</strong>g>Hertfordshire</str<strong>on</strong>g> general summary:<br />
1) Identify <strong>the</strong> key comp<strong>on</strong>ents of commuting to, from and <str<strong>on</strong>g>within</str<strong>on</strong>g> <str<strong>on</strong>g>Hertfordshire</str<strong>on</strong>g>.<br />
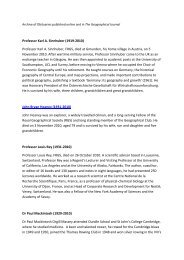
What <str<strong>on</strong>g>patterns</str<strong>on</strong>g> might you expect to find around <str<strong>on</strong>g>Hertfordshire</str<strong>on</strong>g> in terms of <strong>the</strong> ideas of distance decay (people are more likely to travel to<br />
places close by)?<br />
Turn <strong>the</strong>se basic ideas into hypo<strong>the</strong>ses (ideas to test).<br />
e.g. Will <strong>the</strong> number of commuters increase or decrease as <strong>the</strong> distance increases?<br />
Test by drawing/plotting <strong>the</strong> data <strong>on</strong> graphs or in a computer.<br />
120,000<br />
100,000<br />
80,000<br />
60,000<br />
Series1<br />
40,000<br />
20,000<br />
0<br />
less than<br />
2km<br />
less than<br />
5km<br />
less than<br />
10km<br />
less than<br />
20km<br />
less than<br />
30km<br />
less than less than<br />
40km 60km<br />
60km<br />
and over<br />
What about <strong>the</strong> influence of transport routes? Do <strong>the</strong>y reflect topography (<strong>the</strong> shapes of hills and valleys), do <strong>the</strong>y relate to major<br />
settlements or do <strong>the</strong>y have a preferred geographical alignment (east - west or north - south for instance). What about <strong>the</strong> cost of<br />
housing? How does this affect people's commuting <str<strong>on</strong>g>patterns</str<strong>on</strong>g>? Predict what you might expect to find and <strong>the</strong>n test your ideas, do <strong>the</strong>y fit<br />
or do <strong>the</strong>y need a little tweaking or were <strong>the</strong>y completely wr<strong>on</strong>g. Do not worry if your original ideas were incorrect it is <strong>the</strong> building up a<br />
picture of <strong>the</strong> <str<strong>on</strong>g>patterns</str<strong>on</strong>g> created that leads to real understanding. Use "Gut feelings" to generate your ideas and <strong>the</strong>n pool your<br />
suppositi<strong>on</strong>s<br />
http://www.statistics.gov.uk/census2001/cis/pdfs/C1InE.pdf
Plot <strong>on</strong> a map of <str<strong>on</strong>g>Hertfordshire</str<strong>on</strong>g> <strong>the</strong> main areas of employment for <str<strong>on</strong>g>Hertfordshire</str<strong>on</strong>g> people.<br />
Does your map give any clues to <strong>the</strong> main reas<strong>on</strong>s for variati<strong>on</strong>s? Can you suggest any reas<strong>on</strong>s for <strong>the</strong> <str<strong>on</strong>g>patterns</str<strong>on</strong>g> shown?<br />
2) Plot <strong>on</strong> a map of <strong>the</strong> counties of South-east England <strong>the</strong> main places of employment for <str<strong>on</strong>g>Hertfordshire</str<strong>on</strong>g> people. Does your map give you<br />
clues as to <strong>the</strong> main attracti<strong>on</strong>s for commuters?<br />
The map you are about to c<strong>on</strong>struct is a choropleth map and your first task is decide <strong>the</strong> boundaries for each group.<br />
Where people from <str<strong>on</strong>g>Hertfordshire</str<strong>on</strong>g> work (% figures)<br />
Within county Out of county<br />
Broxbourne 4.46 Inner L<strong>on</strong>d<strong>on</strong> 11.61<br />
Dacorum 9.66 Outer L<strong>on</strong>d<strong>on</strong> 8.80<br />
East <str<strong>on</strong>g>Hertfordshire</str<strong>on</strong>g> 8.50 Essex 2.73<br />
Hertsmere 5.81 Bedfordshire 2.18<br />
North <str<strong>on</strong>g>Hertfordshire</str<strong>on</strong>g> 6.90 Buckinghamshire 1.54<br />
St. Albans 8.49 Cambridgeshire 0.91<br />
Stevenage 6.45 Berkshire 0.55<br />
Three Rivers 4.04 Surrey 0.33<br />
Watford 7.01 Hampshire 0.17<br />
Welwyn Hatfield 8.40 Oxfordshire 0.12<br />
Kent 0.12<br />
Northampt<strong>on</strong>shire 0.10
Wards in and surrounding counties around <str<strong>on</strong>g>Hertfordshire</str<strong>on</strong>g>.
Counties of South East England
3) Draw a graph (ei<strong>the</strong>r pie or bar chart) to illustrate <strong>the</strong> distance to work travelled for all people who live in <str<strong>on</strong>g>Hertfordshire</str<strong>on</strong>g>.<br />
4) Do <strong>the</strong> figures for <strong>the</strong> journey to work show a pattern that c<strong>on</strong>firms <strong>the</strong> idea of distance decay (i.e. fewer people travel to work over a<br />
l<strong>on</strong>g distance than a short distance?<br />
5) What are <strong>the</strong> main c<strong>on</strong>clusi<strong>on</strong>s about <strong>the</strong> figures showing journey to work?<br />
6) What surprising data appears in <strong>the</strong> graph and proves that not all data can be taken at face value?<br />
7) Discuss with a partner and identify up to five problems caused by <strong>the</strong> commuting <str<strong>on</strong>g>patterns</str<strong>on</strong>g> identified.<br />
8) Prioritise your ideas and suggest soluti<strong>on</strong>s you would recommend for <strong>the</strong> worst problems (you can use ideas you may have already<br />
come across - c<strong>on</strong>gesti<strong>on</strong> charging, car sharing, public transport, or you can suggest original or forward thinking ideas.
All of <str<strong>on</strong>g>Hertfordshire</str<strong>on</strong>g>, method of journey to work.<br />
Office for Nati<strong>on</strong>al Statistics, 2001 Census, Standard Tables for Local Authorities.<br />
Crown copyright.<br />
Table S129 Sex and Distance Travelled to Work* by Method of Travel to Work<br />
(Workplace Populati<strong>on</strong>) (numbers)<br />
All people aged 16 to 74 in employment in <strong>the</strong> area:<br />
<str<strong>on</strong>g>Hertfordshire</str<strong>on</strong>g><br />
Distance travelled to work *<br />
ALL<br />
PEOPLE<br />
Method of travel to work<br />
Work<br />
mainly at<br />
or from<br />
home<br />
Underground;<br />
metro; light<br />
rail; tram<br />
Train<br />
Bus;<br />
minibus;<br />
coach<br />
Motor<br />
cycle;<br />
scooter<br />
or moped<br />
Driving a<br />
car or<br />
van<br />
Passenger<br />
in a car or<br />
van<br />
Taxi or<br />
minicab<br />
Bicycle On foot<br />
O<strong>the</strong>r<br />
ALL PEOPLE 481,675 48,766 2,935 12,170 17,479 4,243 309,360 27,455 2,530 9,184 46,081 1,472<br />
Less than 2km 97,830 108 732 2,898 613 44,051 6,441 585 4,250 37,735 417<br />
2km to less than 5km 80,796 160 1,009 7,010 1,030 55,258 8,158 510 3,147 4,364 150<br />
5km to less than 10km 72,521 375 1,920 3,948 890 58,203 4,766 195 911 1,183 130<br />
10km to less than 20km 76,415 742 2,663 1,977 823 65,160 3,537 148 386 852 127<br />
20km to less than 30km 34,311 555 1,612 548 349 29,449 1,210 44 82 401 61<br />
30km to less than 40km 15,514 368 961 230 157 13,043 488 11 49 174 33<br />
40km to less than 60km 12,140 158 925 157 95 10,244 335 11 37 148 30<br />
60km and over 16,688 52 795 432 83 13,548 711 26 131 767 143<br />
Works mainly at or from home 75,460 48,766 417 1,553 279 203 20,404 1,809 1,000 191 457 381<br />
Cells in this table have been randomly adjusted to avoid <strong>the</strong> release of<br />
c<strong>on</strong>fidential data.<br />
* The distance travelled is a calculati<strong>on</strong> of <strong>the</strong> straight line between <strong>the</strong> postcode of place of residence and<br />
postcode of workplace.<br />
Average journey to work 14.65 km (compared to 13.39 in England and Wales and 15.88 for east of England regi<strong>on</strong>).
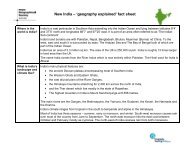
Pie chart showing journeys to work for <str<strong>on</strong>g>Hertfordshire</str<strong>on</strong>g> people<br />
Driving a car or a van<br />
who works at home<br />
Train<br />
On foot<br />
Passenger in a car or van<br />
Bus mini bus or coach<br />
Bicycle<br />
Underground metro light rail or<br />
tram<br />
Motorcycle scooter or moped<br />
Taxi<br />
O<strong>the</strong>r **<br />
Distance travelled to work<br />
40km to less than 60km<br />
30km to less than 40km<br />
60km and over<br />
20km to less than 30km<br />
Less than 2km<br />
5km to less than 10km<br />
2km to less than 5km<br />
Works mainly at or from<br />
home<br />
10km to less than 20km
Office for Nati<strong>on</strong>al Statistics, 2001 Census, Standard Tables for Local Authorities. Crown<br />
copyright.<br />
Net In-<str<strong>on</strong>g>Commuting</str<strong>on</strong>g> (Derived from Table T10 Theme Table <strong>on</strong> Resident;<br />
Workplace and Daytime Populati<strong>on</strong>)<br />
All people aged 16 to 74 who are workers resident in <strong>the</strong> area, or work in <strong>the</strong> area but live<br />
outside <strong>the</strong> area:<br />
Resident<br />
working<br />
populati<strong>on</strong> (Live<br />
in area and work<br />
ei<strong>the</strong>r in or<br />
outside area)<br />
Workplace<br />
populati<strong>on</strong><br />
(Work in area)<br />
Gross In-<br />
<str<strong>on</strong>g>Commuting</str<strong>on</strong>g><br />
(Live outside<br />
area and work<br />
in area) *<br />
Gross Out-<br />
<str<strong>on</strong>g>Commuting</str<strong>on</strong>g><br />
(Live in area<br />
and work<br />
outside area) *<br />
Net In-<br />
<str<strong>on</strong>g>Commuting</str<strong>on</strong>g><br />
% Incommuting<br />
% Outcommuting<br />
<str<strong>on</strong>g>Hertfordshire</str<strong>on</strong>g> 518,768 481,676 120,115 157,207 -37,092 23 30 -7<br />
Broxbourne 43,482 32,123 13,868 25,227 -11,359 32 58 -26<br />
Dacorum 69,313 68,501 26,286 27,098 -812 38 39 -1<br />
East <str<strong>on</strong>g>Hertfordshire</str<strong>on</strong>g> 67,534 57,200 22,904 33,238 -10,334 34 49 -15<br />
Hertsmere 46,003 44,339 25,438 27,102 -1,664 55 59 -4<br />
North <str<strong>on</strong>g>Hertfordshire</str<strong>on</strong>g> 58,814 47,664 17,669 28,819 -11,150 30 49 -19<br />
St. Albans 65,676 55,586 23,353 33,443 -10,090 36 51 -15<br />
Stevenage 39,576 41,725 18,959 16,810 2,149 48 42 5<br />
Three Rivers 40,565 30,569 16,890 26,886 -9,996 42 66 -25<br />
Watford 41,648 49,372 28,636 20,912 7,724 69 50 19<br />
Welwyn Hatfield 46,157 54,597 28,467 20,027 8,440 62 43 18<br />
* Please note that <strong>the</strong> Gross In-<str<strong>on</strong>g>Commuting</str<strong>on</strong>g> or Out-<str<strong>on</strong>g>Commuting</str<strong>on</strong>g> figures cannot be summed to produce totals for a larger area as <strong>the</strong><br />
total may include workers who commute <str<strong>on</strong>g>within</str<strong>on</strong>g> <strong>the</strong> summed areas.<br />
© Crown copyright 2003<br />
% in and out commuting are measured as a % of <strong>the</strong> resident working populati<strong>on</strong>.<br />
Net
9) Plot <strong>on</strong> a map of <str<strong>on</strong>g>Hertfordshire</str<strong>on</strong>g> <strong>the</strong> areas which are net providers of jobs and those that are net producers of workers. Can you identify<br />
any <str<strong>on</strong>g>patterns</str<strong>on</strong>g>? For example what do <strong>the</strong> key providers of jobs have in comm<strong>on</strong>?<br />
10) Describe <strong>the</strong> similarities and differences between Stevenage and Watford in terms of site and situati<strong>on</strong>, history, main industries, types<br />
of employment, working populati<strong>on</strong>s and distributi<strong>on</strong> of industry throughout <strong>the</strong> town.<br />
Stevenage<br />
Watford<br />
Site<br />
History<br />
Sectors of employment<br />
Main employers<br />
Key industries<br />
11) Why are main employers and key industries not necessarily <strong>the</strong> same thing?
Stevenage<br />
http://www.<strong>the</strong>grid.org.uk/learning/hals/geography.shtml<br />
http://en.wikipedia.org/wiki/Stevenage<br />
http://www.visi<strong>on</strong>ofbritain.org.uk/GBH_match_page.jsp?<strong>on</strong>s=Stevenage<br />
http://www.hertsdirect.org/comdirectory/comvol/trade2y/chamcom3/10597217<br />
http://www.hertsdirect.org/libsleisure/abou<strong>the</strong>rts/industry/<br />
http://visi<strong>on</strong>.edina.ac.uk/data_<strong>the</strong>me_page.jsp?u_id=10088380&c_id=10001043&data_<strong>the</strong>me=T_IND<br />
http://www.nhc.ac.uk/about/stevenage.htm<br />
http://www.britinfo.net/fp-C-DAH.htm<br />
http://www.stevenage.gov.uk/envir<strong>on</strong>ment/polluti<strong>on</strong>/c<strong>on</strong>taminatedlandstrategy/appendixe<br />
http://www.norwichuni<strong>on</strong>.com/careers/locati<strong>on</strong>s.htm#stevenage<br />
http://www.hertfordshire.com/pages/towns/guides/566/<br />
http://www.hertford.net/fordshire.htm<br />
Watford<br />
http://en.wikipedia.org/wiki/Watford<br />
http://www.visi<strong>on</strong>ofbritain.org.uk/GBH_match_page.jsp?<strong>on</strong>s=Watford<br />
http://www.watfordobserver.co.uk/<strong>on</strong>ewatford/watfordhistory/<br />
http://www.watford-chamber.co.uk/<br />
http://www.visi<strong>on</strong>ofbritain.org.uk/data_<strong>the</strong>me_page.jsp?u_id=10056779&c_id=10001043&data_<strong>the</strong>me=T_IND<br />
http://www.hertfordshire.com/pages/towns/guides/636/<br />
http://www.applegate.co.uk/searchadl/Search.htm<br />
http://www.1stdirectory.com/AtoZ_Companies/index~letter~a.htm<br />
http://www.watford.gov.uk/ccm/portal/<br />
http://www.watfordobserver.co.uk/<br />
http://www.watfordmuseum.org.uk/outreach.html
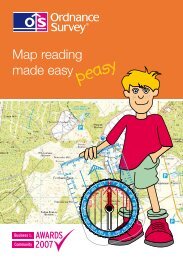
Comparis<strong>on</strong> of sectors of industry in Stevenage and Watford<br />
8,000<br />
7,000<br />
6,000<br />
5,000<br />
4,000<br />
3,000<br />
2,000<br />
1,000<br />
Stevenage<br />
Watford<br />
Watford<br />
51%<br />
0<br />
Stevenage<br />
49%<br />
Stevenage<br />
Watford<br />
Agriculture; hunting and forestry<br />
Mining and quarrying<br />
Electricity; gas and water supply<br />
Wholesale & retail trade; repair of motor ve...<br />
Transport; storage & communicati<strong>on</strong><br />
Real estate; renting and business activities<br />
Educati<strong>on</strong><br />
O<strong>the</strong>r*
All people aged<br />
16 - 74 in<br />
employment<br />
Agriculture;<br />
hunting and<br />
forestry<br />
Fishing Mining and<br />
quarrying<br />
People aged 16 - 74 in employment working in<br />
Manufacturing<br />
Electricity;<br />
gas and<br />
water<br />
supply<br />
C<strong>on</strong>structi<strong>on</strong><br />
Wholesale &<br />
retail trade;<br />
repair of<br />
motor<br />
vehicles<br />
Hotels and<br />
catering<br />
Stevenage 39,576 236 0 27 6,263 168 3,211 7,969 1,516<br />
Watford 41,648 205 0 22 4,633 208 2,886 7,966 1,487<br />
All people aged<br />
16 - 74 in<br />
employment<br />
Financial<br />
intermedi<br />
ati<strong>on</strong><br />
Public<br />
administrati<strong>on</strong><br />
and defence<br />
Educati<strong>on</strong> Health and<br />
social work<br />
O<strong>the</strong>r*<br />
Transport;<br />
storage &<br />
communicatio<br />
n<br />
Real<br />
estate;<br />
renting<br />
and<br />
business<br />
activities<br />
Stevenage 3,106 1,908 5,547 2,019 2,207 3,691 1,708<br />
Watford 3,956 2,264 6,684 1,930 2,894 4,110 2,403
Ward summaries for Stevenage and Watford<br />
Net In-<str<strong>on</strong>g>Commuting</str<strong>on</strong>g> (Derived from Table T10 Theme Table <strong>on</strong> Resident;<br />
Workplace and Daytime Populati<strong>on</strong>)<br />
All people aged 16 to 74 who are workers resident in <strong>the</strong> area, or work in <strong>the</strong> area but<br />
live outside <strong>the</strong> area:<br />
Wards in Stevenage District<br />
Ward Code Ward Resident<br />
working<br />
populati<strong>on</strong><br />
(Live in area<br />
and work ei<strong>the</strong>r<br />
in or outside<br />
area)<br />
Workplace<br />
populati<strong>on</strong><br />
(Work in<br />
area)<br />
Gross In-<br />
<str<strong>on</strong>g>Commuting</str<strong>on</strong>g><br />
(Live<br />
outside area<br />
and work in<br />
area) *<br />
Gross Out-<br />
<str<strong>on</strong>g>Commuting</str<strong>on</strong>g><br />
(Live in area<br />
and work<br />
outside<br />
area) *<br />
Net In-<br />
<str<strong>on</strong>g>Commuting</str<strong>on</strong>g><br />
Incommuting<br />
as a<br />
percentage of<br />
residential<br />
workforce<br />
Outcommuting<br />
as a<br />
percentage of<br />
residential<br />
workforce<br />
Net<br />
commuting<br />
as a<br />
percentage of<br />
residential<br />
working<br />
populati<strong>on</strong><br />
26UHFQ Bandley Hill 3,377 1,207 574 2,744 -2,170 17 81 -64<br />
26UHFR Bedwell 2,763 8,814 7,961 1,910 6,051 288 69 219<br />
26UHFS Chells 3,067 872 401 2,596 -2,195 13 85 -72<br />
26UHFT L<strong>on</strong>gmeadow 2,929 632 182 2,479 -2,297 6 85 -78<br />
26UHFU Manor 3,713 782 274 3,205 -2,931 7 86 -79<br />
26UHFW Martins Wood 3,186 845 359 2,700 -2,341 11 85 -73<br />
26UHFX Old Town 2,938 3,637 2,886 2,187 699 98 74 24<br />
26UHFY Pin Green 2,904 740 252 2,416 -2,164 9 83 -75<br />
26UHFZ Roebuck 2,874 9,344 8,569 2,099 6,470 298 73 225<br />
26UHGA St. Nicholas 3,154 2,877 2,273 2,550 -277 72 81 -9<br />
26UHGB Shephall 2,790 1,126 627 2,291 -1,664 22 82 -60<br />
26UHGC Sym<strong>on</strong>ds Green 3,147 6,724 5,980 2,403 3,577 190 76 114<br />
26UHGD Woodfield 2,734 4,125 3,479 2,088 1,391 127 76 51<br />
* Please note that <strong>the</strong> Gross In-<str<strong>on</strong>g>Commuting</str<strong>on</strong>g> or Out-<str<strong>on</strong>g>Commuting</str<strong>on</strong>g> figures cannot be summed to produce totals for a larger area as <strong>the</strong><br />
total may include workers who commute <str<strong>on</strong>g>within</str<strong>on</strong>g> <strong>the</strong> summed areas.<br />
© Crown copyright 2003<br />
Office for Nati<strong>on</strong>al Statistics, 2001 Census, Standard Tables for<br />
Wards. Crown copyright.
Net In-<str<strong>on</strong>g>Commuting</str<strong>on</strong>g> (Derived from Table T10 Theme Table <strong>on</strong> Resident;<br />
Workplace and Daytime Populati<strong>on</strong>)<br />
All people aged 16 to 74 who are workers resident in <strong>the</strong> area, or work in <strong>the</strong> area but<br />
live outside <strong>the</strong> area:<br />
Wards in Watford District<br />
Ward Code Ward Resident<br />
working<br />
populati<strong>on</strong><br />
(Live in area<br />
and work ei<strong>the</strong>r<br />
in or outside<br />
area)<br />
Workplace<br />
populati<strong>on</strong><br />
(Work in<br />
area)<br />
Gross In-<br />
<str<strong>on</strong>g>Commuting</str<strong>on</strong>g><br />
(Live<br />
outside area<br />
and work in<br />
area) *<br />
Gross Out-<br />
<str<strong>on</strong>g>Commuting</str<strong>on</strong>g><br />
(Live in area<br />
and work<br />
outside<br />
area) *<br />
Net In-<br />
<str<strong>on</strong>g>Commuting</str<strong>on</strong>g><br />
Incommuting<br />
as a<br />
percentage<br />
of residential<br />
workforce<br />
Outcommuting<br />
as a<br />
percentage of<br />
residential<br />
workforce<br />
Net<br />
commuting<br />
as a<br />
percentage of<br />
residential<br />
working<br />
populati<strong>on</strong><br />
26UKFN Callowland 3,932 3,048 2,357 3,241 -884 60 82 -22<br />
26UKFP Central 3,708 17,587 16,470 2,591 13,879 444 70 374<br />
26UKFQ Holywell 3,534 5,478 4,712 2,768 1,944 133 78 55<br />
26UKFR Leggatts 3,588 1,771 1,190 3,007 -1,817 33 84 -51<br />
26UKFS Meriden 3,259 1,465 883 2,677 -1,794 27 82 -55<br />
26UKFT Nascot 3,268 2,466 1,820 2,622 -802 56 80 -25<br />
26UKFU Oxhey 3,325 1,303 701 2,723 -2,022 21 82 -61<br />
26UKFW Park 3,005 2,693 2,079 2,391 -312 69 80 -10<br />
26UKFX Stanborough 3,520 999 381 2,902 -2,521 11 82 -72<br />
26UKFY Tudor 3,203 7,375 6,690 2,518 4,172 209 79 130<br />
26UKFZ Vicarage 3,922 3,914 3,102 3,110 -8 79 79 0<br />
26UKGA Woodside 3,384 1,273 693 2,804 -2,111 20 83 -62<br />
* Please note that <strong>the</strong> Gross In-<str<strong>on</strong>g>Commuting</str<strong>on</strong>g> or Out-<str<strong>on</strong>g>Commuting</str<strong>on</strong>g> figures cannot be summed to produce totals for a larger area as <strong>the</strong><br />
total may include workers who commute <str<strong>on</strong>g>within</str<strong>on</strong>g> <strong>the</strong> summed areas.<br />
© Crown copyright 2003<br />
Office for Nati<strong>on</strong>al Statistics, 2001 Census, Standard Tables for<br />
Wards. Crown copyright.
<str<strong>on</strong>g>Hertfordshire</str<strong>on</strong>g><br />
Office for Nati<strong>on</strong>al Statistics, 2001 Census, Standard Tables for Local<br />
Authorities. Crown copyright.<br />
All people aged 16 to 74 who are ei<strong>the</strong>r resident in <strong>the</strong> area or work in<br />
<strong>the</strong> area: <str<strong>on</strong>g>Hertfordshire</str<strong>on</strong>g><br />
'Resident'<br />
populati<strong>on</strong><br />
aged 16-74<br />
(A+B+C+F)<br />
A. Lives in<br />
area and<br />
works<br />
outside<br />
area but<br />
<str<strong>on</strong>g>within</str<strong>on</strong>g><br />
associated<br />
area $$<br />
B. Lives in<br />
area and<br />
works<br />
outside<br />
associated<br />
area # $$<br />
C. Lives<br />
and<br />
works in<br />
area $<br />
D. Lives<br />
outside<br />
area but<br />
<str<strong>on</strong>g>within</str<strong>on</strong>g><br />
associated<br />
area and<br />
works<br />
inside area<br />
$$<br />
E. Lives<br />
outside<br />
associated<br />
area and<br />
works<br />
inside area<br />
$$<br />
F. Lives in<br />
area and<br />
does not<br />
work<br />
'Workplace<br />
'<br />
populati<strong>on</strong><br />
aged 16-74<br />
(C+D+E)<br />
###<br />
'Daytime'<br />
populati<strong>on</strong><br />
aged 16-74<br />
(C+D+E+F)<br />
###<br />
ALL PEOPLE 746,008 155,658 1,549 361,561 120,115 n/a 227,240 481,676 708,916<br />
Males 368,684 100,138 1,110 183,101 77,257 n/a 84,335 260,358 344,693<br />
Females 377,324 55,520 439 178,460 42,858 n/a 142,905 221,318 364,223<br />
In order to give <strong>the</strong> topic some realism it might be an idea to take <strong>on</strong> <strong>the</strong> role of a bus company deciding to tender for <strong>the</strong> c<strong>on</strong>tract to serve<br />
Stevenage or Watford and to produce a report <strong>on</strong> <strong>the</strong> most lucrative. Alternatively, different teams could be given <strong>the</strong> case for serving Watford<br />
and ano<strong>the</strong>r <strong>the</strong> case for serving Stevenage. To this end commuting pattern data for <str<strong>on</strong>g>within</str<strong>on</strong>g> <strong>the</strong> towns has been supplied.<br />
Resource written by Bob Grinham (Head of Geography, The Nobel School)