Map reading made 'easy peasy' (PDF)
Map reading made 'easy peasy' (PDF)
Map reading made 'easy peasy' (PDF)

You also want an ePaper? Increase the reach of your titles
YUMPU automatically turns print PDFs into web optimized ePapers that Google loves.
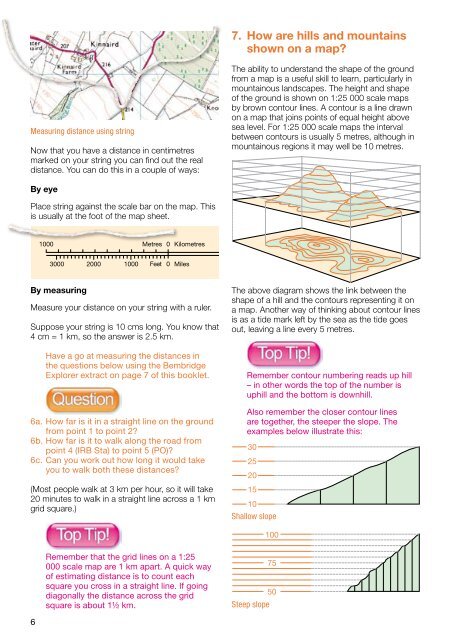
7. How are hills and mountains<br />
shown on a map?<br />
Measuring distance using string<br />
Now that you have a distance in centimetres<br />
marked on your string you can find out the real<br />
distance. You can do this in a couple of ways:<br />
The ability to understand the shape of the ground<br />
from a map is a useful skill to learn, particularly in<br />
mountainous landscapes. The height and shape<br />
of the ground is shown on 1:25 000 scale maps<br />
by brown contour lines. A contour is a line drawn<br />
on a map that joins points of equal height above<br />
sea level. For 1:25 000 scale maps the interval<br />
between contours is usually 5 metres, although in<br />
mountainous regions it may well be 10 metres.<br />
By eye<br />
Place string against the scale bar on the map. This<br />
is usually at the foot of the map sheet.<br />
By measuring<br />
Measure your distance on your string with a ruler.<br />
Suppose your string is 10 cms long. You know that<br />
4 cm = 1 km, so the answer is 2.5 km.<br />
Have a go at measuring the distances in<br />
the questions below using the Bembridge<br />
Explorer extract on page 7 of this booklet.<br />
6a. How far is it in a straight line on the ground<br />
from point 1 to point 2?<br />
6b. How far is it to walk along the road from<br />
point 4 (IRB Sta) to point 5 (PO)?<br />
6c. Can you work out how long it would take<br />
you to walk both these distances?<br />
(Most people walk at 3 km per hour, so it will take<br />
20 minutes to walk in a straight line across a 1 km<br />
grid square.)<br />
The above diagram shows the link between the<br />
shape of a hill and the contours representing it on<br />
a map. Another way of thinking about contour lines<br />
is as a tide mark left by the sea as the tide goes<br />
out, leaving a line every 5 metres.<br />
Remember contour numbering reads up hill<br />
– in other words the top of the number is<br />
uphill and the bottom is downhill.<br />
Also remember the closer contour lines<br />
are together, the steeper the slope. The<br />
examples below illustrate this:<br />
Shallow slope<br />
Remember that the grid lines on a 1:25<br />
000 scale map are 1 km apart. A quick way<br />
of estimating distance is to count each<br />
square you cross in a straight line. If going<br />
diagonally the distance across the grid<br />
square is about 1½ km.<br />
Steep slope