Considering a Cadre Augmented Army - RAND Corporation
Considering a Cadre Augmented Army - RAND Corporation Considering a Cadre Augmented Army - RAND Corporation
-124- A Budgetary Analysis of Cadre incrementally looks for AC units to deploy until it reaches the minimum number of periods at home for the AC specified by the user. If after deploying all AC units at home more than the minimum, the requirement for deployed AC forces is still not met, then the algorithm will redeploy AC units already deployed. If the requirement for deployed AC forces is still not met, the model will display the error message shown in Figure B.13, which displays the period in which the algorithm was unable to meet the requirement for AC forces. Figure B.13—Failed Force Assignment Message If the algorithm is able to meet the demand for AC forces in a given period, it will move on to trying to meet the total requirement for deployed forces. Again, the algorithm begins by deploying cadre and active units at home the longest. However, the algorithm stops looking for AC units at home less than the threshold for RC deployments specified by the user. When it reaches this threshold, the algorithm looks to see if there are any RC units at home for the longest possible time (RCMaxH). 139 If there are fully rested RC units, the model deploys as many units as needed. If the requirement for deployed forces is still not met, the algorithm will return to deploying AC units at home for a period less than the RC threshold, but more than the AC minimum. After deploying all AC units home more than the minimum period of time, the algorithm will then redeploy AC units already deployed. If ____________ 139 The model is hard-coded so that RC units are always deployed with a full cycle of rest between deployments. Unlike the AC, which we are willing to stress to some extent, we assume that RC units must have a full five years at home between deployments. The user can change the dwell time for RC units to explore the sensitivity of the results to this assumption.
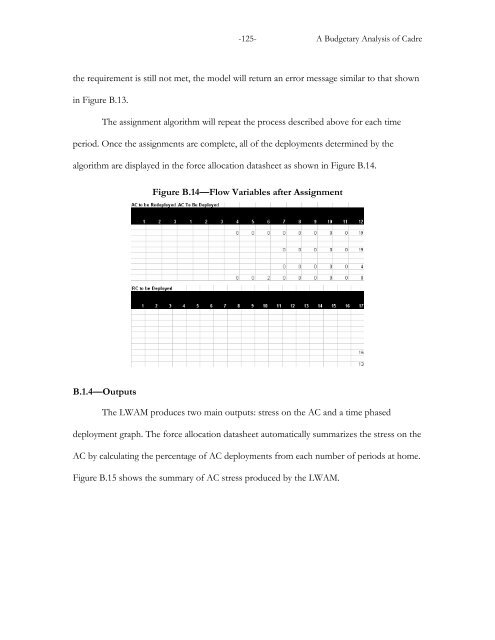
-125- A Budgetary Analysis of Cadre the requirement is still not met, the model will return an error message similar to that shown in Figure B.13. The assignment algorithm will repeat the process described above for each time period. Once the assignments are complete, all of the deployments determined by the algorithm are displayed in the force allocation datasheet as shown in Figure B.14. Figure B.14—Flow Variables after Assignment B.1.4—Outputs The LWAM produces two main outputs: stress on the AC and a time phased deployment graph. The force allocation datasheet automatically summarizes the stress on the AC by calculating the percentage of AC deployments from each number of periods at home. Figure B.15 shows the summary of AC stress produced by the LWAM.
- Page 89 and 90: -73- A Budgetary Analysis of Cadre
- Page 91 and 92: -75- A Budgetary Analysis of Cadre
- Page 93 and 94: -77- A Budgetary Analysis of Cadre
- Page 95 and 96: -79- A Budgetary Analysis of Cadre
- Page 97 and 98: -81- A Budgetary Analysis of Cadre
- Page 99 and 100: -83- A Budgetary Analysis of Cadre
- Page 101 and 102: -85- A Budgetary Analysis of Cadre
- Page 103 and 104: -87- A Budgetary Analysis of Cadre
- Page 105 and 106: -89- A Budgetary Analysis of Cadre
- Page 107 and 108: -91- A Budgetary Analysis of Cadre
- Page 109 and 110: -93- A Budgetary Analysis of Cadre
- Page 111 and 112: -95- A Budgetary Analysis of Cadre
- Page 113 and 114: -97- A Budgetary Analysis of Cadre
- Page 115 and 116: -99- A Budgetary Analysis of Cadre
- Page 117 and 118: -101- A Budgetary Analysis of Cadre
- Page 119 and 120: -103- A Budgetary Analysis of Cadre
- Page 121 and 122: -105- A Budgetary Analysis of Cadre
- Page 123 and 124: -107- A Budgetary Analysis of Cadre
- Page 125 and 126: -109- A Budgetary Analysis of Cadre
- Page 127 and 128: -111- A Budgetary Analysis of Cadre
- Page 129 and 130: -113- A Budgetary Analysis of Cadre
- Page 131 and 132: -115- A Budgetary Analysis of Cadre
- Page 133 and 134: -117- A Budgetary Analysis of Cadre
- Page 135 and 136: -119- A Budgetary Analysis of Cadre
- Page 137 and 138: -121- A Budgetary Analysis of Cadre
- Page 139: -123- A Budgetary Analysis of Cadre
- Page 143 and 144: -127- A Budgetary Analysis of Cadre
- Page 145 and 146: -129- A Budgetary Analysis of Cadre
- Page 147 and 148: -131- A Budgetary Analysis of Cadre
- Page 149 and 150: -133- A Budgetary Analysis of Cadre
- Page 151 and 152: -135- A Budgetary Analysis of Cadre
- Page 153 and 154: -137- An Operational Analysis of Ca
- Page 155 and 156: -139- An Operational Analysis of Ca
- Page 157: -141- An Operational Analysis of Ca
- Page 161 and 162: -145- An Operational Analysis of Ca
- Page 163 and 164: -147- An Operational Analysis of Ca
- Page 165 and 166: -149- An Operational Analysis of Ca
- Page 167 and 168: -151- An Operational Analysis of Ca
- Page 169 and 170: -153- An Operational Analysis of Ca
- Page 171 and 172: -155- An Operational Analysis of Ca
- Page 173 and 174: -157- An Operational Analysis of Ca
- Page 175 and 176: -159- An Operational Analysis of Ca
- Page 177 and 178: -161- An Operational Analysis of Ca
- Page 179 and 180: -163- An Operational Analysis of Ca
- Page 181 and 182: -165- An Operational Analysis of Ca
- Page 183 and 184: -167- An Operational Analysis of Ca
- Page 185 and 186: -169- An Operational Analysis of Ca
- Page 187 and 188: -171- An Operational Analysis of Ca
- Page 189 and 190: -173- An Operational Analysis of Ca
-125- A Budgetary Analysis of <strong>Cadre</strong><br />
the requirement is still not met, the model will return an error message similar to that shown<br />
in Figure B.13.<br />
The assignment algorithm will repeat the process described above for each time<br />
period. Once the assignments are complete, all of the deployments determined by the<br />
algorithm are displayed in the force allocation datasheet as shown in Figure B.14.<br />
Figure B.14—Flow Variables after Assignment<br />
B.1.4—Outputs<br />
The LWAM produces two main outputs: stress on the AC and a time phased<br />
deployment graph. The force allocation datasheet automatically summarizes the stress on the<br />
AC by calculating the percentage of AC deployments from each number of periods at home.<br />
Figure B.15 shows the summary of AC stress produced by the LWAM.


