Solubility Curve Practice Problems Worksheet 1
Solubility Curve Practice Problems Worksheet 1
Solubility Curve Practice Problems Worksheet 1

You also want an ePaper? Increase the reach of your titles
YUMPU automatically turns print PDFs into web optimized ePapers that Google loves.
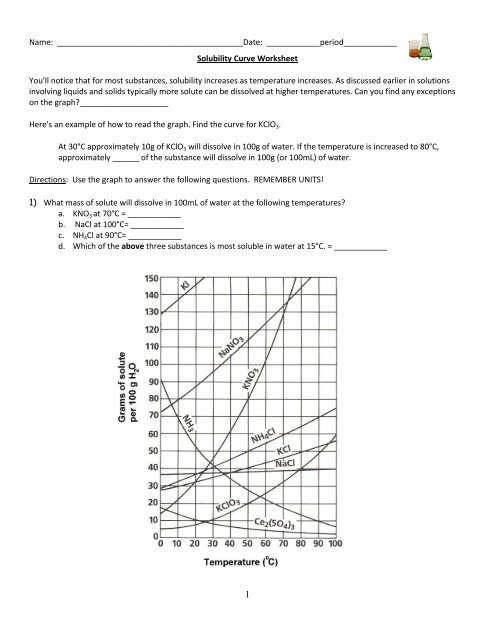
Name: __________________________________________Date: ____________period____________<br />
<strong>Solubility</strong> <strong>Curve</strong> <strong>Worksheet</strong><br />
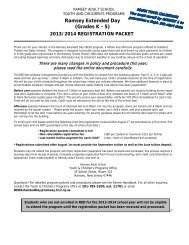
You'll notice that for most substances, solubility increases as temperature increases. As discussed earlier in solutions<br />
involving liquids and solids typically more solute can be dissolved at higher temperatures. Can you find any exceptions<br />
on the graph?____________________<br />
Here's an example of how to read the graph. Find the curve for KClO 3 .<br />
At 30°C approximately 10g of KClO 3 will dissolve in 100g of water. If the temperature is increased to 80°C,<br />
approximately ______ of the substance will dissolve in 100g (or 100mL) of water.<br />
Directions: Use the graph to answer the following questions. REMEMBER UNITS!<br />
1) What mass of solute will dissolve in 100mL of water at the following temperatures?<br />
a. KNO 3 at 70°C = ____________<br />
b. NaCl at 100°C= ____________<br />
c. NH 4 Cl at 90°C= ____________<br />
d. Which of the above three substances is most soluble in water at 15°C. = ____________<br />
1
2) Types of Solutions<br />
On a solubility curve, the lines indicate the concentration of a __________________ solution - the maximum amount of<br />
solute that will dissolve at that specific temperature.<br />
Values on the graph ____________ a curve represent unsaturated solutions - more solute could be dissolved at that<br />
temperature.<br />
Label the following solutions as saturated or unsaturated. If unsaturated, write how much more solute can be dissolved<br />
in the solution.<br />
Solution Saturated or Unsaturated? If unsaturated: How much more<br />
solute can dissolve in the solution?<br />
a solution that contains 70g of NaNO 3<br />
at 30°C (in 100 mL H 2 O)<br />
a solution that contains 50g of NH 4 Cl at<br />
50°C (in 100 mL H 2 O)<br />
a solution that contains 20g of KClO 3 at<br />
50°C (in 100 mL H 2 O)<br />
a solution that contains 70g of KI at 0°C<br />
(in 100 mL H 2 O)<br />
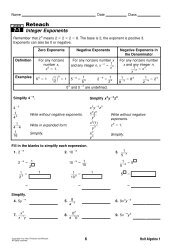
1. a. What is the solubility of KCl at 5C? _______<br />
b. What is the solubility of KCl at 25C? _______<br />
c. What is the solubility of Ce 2 (SO 4 ) 3 at 10C? _______<br />
d. What is the solubility of Ce 2 (SO 4 ) 3 at 50C? _______<br />
Use the <strong>Solubility</strong> Graphs on Page 1<br />
2. a. At 90C, you dissolved 10 g of KCl in 100. g of water. Is this solution saturated or unsaturated?<br />
b. How do you know?<br />
2
3. A mass of 100 g of NaNO 3 is dissolved in 100 g of water at 80ºC.<br />
a) Is the solution saturated or unsaturated?______________________________<br />
b) As the solution is cooled, at what temperature should solid first appear in the solution? Explain.<br />
4. Use the graph to answer the following two questions:<br />
Which compound is most soluble at 20 ºC? ________<br />
Which is the least soluble at 40 ºC? ________<br />
5. Which substance on the graph is least soluble at 10C? __________<br />
6. A mass of 80 g of KNO 3 is dissolved in 100 g of water at 50 ºC. The solution is heated to 70ºC. How many more grams<br />
of potassium nitrate must be added to make the solution saturated? Explain your reasoning (See question #2 on the<br />
other side for a hint)<br />
7. Fill in the chart below for some of the compounds on the graph:<br />
Formula<br />
Example:<br />
NaCl<br />
If the following amounts of solute are dissolved in 100 mL of water: Is the<br />
solution SATURATED OR UNSATURATED<br />
3 grams dissolved at 0ºC<br />
unsaturated<br />
120 grams dissolved at 0ºC<br />
KI<br />
Ce(SO 4 ) 3<br />
7.2 grams dissolved at 70ºC<br />
NH 4 Cl<br />
11 grams dissolved at 46.7ºC<br />
3
Part II: Graph Questions<br />
1. Graph the following data on the graph paper on the next page.<br />
Your graph must:<br />
-Be neat and organized (use a ruler)<br />
-X and Y axis must have proper scale<br />
-Have properly labeled axes<br />
-Use a different color for the two different solubility curves.<br />
Sodium Chloride <strong>Solubility</strong><br />
Temperatur<br />
e<br />
0 35.7<br />
10 35.8<br />
20 35.9<br />
30 36<br />
40 36.4<br />
60 37.1<br />
80 38<br />
90 38.5<br />
100 39.2<br />
<strong>Solubility</strong> (g of<br />
solute/100 mL of<br />
H 2 0)<br />
Copper Sulfate <strong>Solubility</strong><br />
Temperature <strong>Solubility</strong> (g of<br />
solute/100 mL of<br />
H 2 0)<br />
0 23<br />
10 27.5<br />
20 32<br />
30 38<br />
40 44.5<br />
60 62<br />
80 84<br />
100 114<br />
2. Write the data from your lab in the space below:<br />
______22_______grams of sodium chloride dissolved in 100 mL of water<br />
_____32________grams of or copper sulfate dissolved in 100 mL of water<br />
Use the graph you just created and the above lab data to answer these questions:<br />
a) Which solution was saturated? Which was unsaturated? Explain.<br />
b) How much more solute could you add to the unsaturated solution?<br />
4