Deutsche Bahn 2010 Annual Report - Deutsche Bahn AG
Deutsche Bahn 2010 Annual Report - Deutsche Bahn AG
Deutsche Bahn 2010 Annual Report - Deutsche Bahn AG

Create successful ePaper yourself
Turn your PDF publications into a flip-book with our unique Google optimized e-Paper software.
<strong>Deutsche</strong> <strong>Bahn</strong><br />
<strong>2010</strong> <strong>Annual</strong> <strong>Report</strong>
At a glance<br />
Selected key figures <strong>2010</strong> 2009 Change<br />
absolute %<br />
KEY FINANCIAL FIGURES [ € million ]<br />
Revenues 34,410 29,335 +5,075 +17.3<br />
Revenues comparable 32,456 29,335 +3,121 +10.6<br />
Profit before taxes on income 900 1,387 –487 –35.1<br />
Net profit for the year 1,058 830 +228 +27.5<br />
EBITDA adjusted 4,651 4,402 +249 +5.7<br />
EBIT adjusted 1,866 1,685 +181 +10.7<br />
Non-current assets as of Dec 31 44,530 41,308 +3,222 +7.8<br />
Current assets as of Dec 31 7,473 5,995 +1,478 +24.7<br />
Equity as of Dec 31 14,316 13,066 +1,250 +9.6<br />
Net financial debt as of Dec 31 16,939 15,011 +1,928 +12.8<br />
Total assets as of Dec 31 52,003 47,303 +4,700 +9.9<br />
Capital employed as of Dec 31 31,312 28,596 +2,716 +9.5<br />
ROCE 6.0 % 5.9 % – –<br />
Redemption coverage 18.1 % 19.4 % – –<br />
Gearing 118 % 115 % – –<br />
Gross capital expenditures 6,891 6,462 +429 +6.6<br />
Net capital expenditures 2,072 1,813 +259 +14.3<br />
Cash flow from operating activities 3,409 3,133 +276 +8.8<br />
KEY PERFORMANCE FIGURES<br />
RAIL PASSENGER TRANSPORT 1)<br />
Passengers (million) 1,950 1,908 +42 +2.2<br />
Volume sold (million pkm) 78,582 76,772 +1,810 +2.4<br />
Volume produced (million train-path km) 674.9 675.9 –1.0 –0.1<br />
RAIL FREIGHT TRANSPORT<br />
Freight carried (million t) 415.4 341.0 +74.4 +21.8<br />
Volume sold (million tkm) 105,794 93,948 +11,846 +12.6<br />
Capacity utilization (t per train) 502.4 484.0 +18.4 +3.8<br />
RAIL INFRASTRUCTURE<br />
Train kilometers on track infrastructure (million train-path km) 1,034 1,003 +31 +3.1<br />
thereof non-Group customers 195.4 170.4 +25.0 +14.7<br />
Station stops (million) 143.9 143.3 +0.6 +0.4<br />
thereof non-Group customers 22.0 20.0 +2.0 +10.0<br />
BUS TRANSPORT 1)<br />
Passengers (million) 784.2 800.2 –16.0 –2.0<br />
Volume sold (million pkm) 9,214 9,261 –47 –0.5<br />
FREIGHT FORWARDING AND LOGISTICS<br />
Shipments in European land transport (thousand) 80,816 70,052 +10,764 +15.4<br />
Air freight volume (export) (thousand t) 1,225 1,032 +193 +18.7<br />
Ocean freight volume (export) (thousand TEU) 1,647 1,424 +223 +15.7<br />
OTHER FIGURES<br />
Length of line operated (km) 33,723 33,721 +2 –<br />
Passenger stations 5,700 5,707 –7 –0.1<br />
Employees as of Dec 31 276,310 239,382 +36,928 +15.4<br />
Rating Moody’s/Standard & Poor’s/Fitch Aa1 /AA/AA Aa1 /AA/AA – –<br />
1)<br />
Excluding DB Arriva.
DB Group’s business units<br />
DB BAHN LONG-DISTANCE<br />
The DB <strong>Bahn</strong> Long-Distance business unit provides national<br />
and cross-border long-distance rail transport services. We<br />
connect 150 German cities to major European cities such as<br />
Amsterdam, Brussels, Paris and Zurich via our long-distance<br />
rail services. Daily scheduled rail service is the core business<br />
of long-distance transport. We want to convince customers<br />
of our offers and expand our market share by keeping our<br />
promise of providing quick and comfortable connections<br />
directly into cities at attractive prices. In addition to our<br />
services in Germany we are gradually expanding our international<br />
range of offers.<br />
DB BAHN REGIONAL<br />
As of January 1, 2011, all of our regional bus<br />
and rail transport activities in Germany, as<br />
well as cross-border regional transport services<br />
to and from Germany, were bundled<br />
together in the DB <strong>Bahn</strong> Regional business<br />
unit. Our rail transport offers connections<br />
to major metropolitan areas as well as rural<br />
destinations via our extensive regional transport<br />
network. We are active with 22 different<br />
companies in the bus transport segment,<br />
making us the biggest provider in Germany.<br />
DB ARRIVA<br />
As of January 1, 2011 we bundled together all of<br />
our regional transport activities outside of Germany<br />
(with the exception of cross-border routes<br />
to and from Germany) in the new DB Arriva business<br />
unit. The business unit comprises bus and/<br />
or rail transports in eleven European countries:<br />
Denmark, Great Britain, Italy, the Netherlands,<br />
Poland, Portugal, Sweden, Slovakia, Spain, the<br />
Czech Republic and Hungary. These activities<br />
will be expanded into the 12th country in the<br />
2011 financial year when DB Arriva inaugurates<br />
bus services in Malta.<br />
DB SCHENKER LOGISTICS<br />
DB Schenker Logistics supports industrial and trade custo<br />
mers in the global exchange of goods: in land transport,<br />
worl dwide air and ocean freight services, as well as in the<br />
areas of contract logistics and supply chain management.<br />
Our presence in approximately 2,000 locations in over<br />
130 countries enables us to assert ourselves in markets known<br />
for having rapid rates of growth and tough competition.<br />
As a land transport specialist in Europe, we link<br />
to gether key European business regions via our dense<br />
network of regularly scheduled transports. We are equally<br />
specialized in providing global solutions in the areas of<br />
air and ocean freight as well as providing the related<br />
logistical services. Our<br />
logistics centers make<br />
it possible to connect<br />
all modes of transport<br />
there by offering customers<br />
a wide selection<br />
of value-added services.
DB SCHENKER RAIL<br />
DB Schenker Rail is the leading freight railway in Europe and<br />
is represented in 12 European countries: Belgium, Bul ga ria,<br />
Denmark, Germany, France, Great Britain, Italy, the Netherlands,<br />
Poland, Romania, Switzerland and Spain. We offer block<br />
train, single wagon, and combined transport services, as well<br />
as special know-how in the iron, coal and steel (Montan) area,<br />
chemicals, pet ro leum-based products, agricultural pro ducts,<br />
forestry, con sumer<br />
goods freight, building<br />
materials and<br />
waste disposal areas.<br />
DB SERVICES<br />
The availability of reliable services is a central<br />
prerequisite for smoothly operating mobility<br />
and logistical services and thus for the competitiveness<br />
of rail transport. DB Group companies<br />
are the main customers of the primarily<br />
transport-related infrastructure management<br />
and infrastructure-linked services.<br />
DB GROUP’S BUSINESS UNITS<br />
DB NETZE TRACK<br />
The DB Netze Track business unit is the service provider for all train operating<br />
companies (TOC) in Germany that use our nearly 33,600-km-long rail network. Due<br />
to its location, our rail network, which is the longest in Europe, is quite important<br />
for the transport business in Europe. We ensure the safe operation of our rail infrastructure,<br />
the marketing of customer-oriented track usage offers, as well as the<br />
preparation of conflict-free schedules.<br />
DB NETZE STATIONS<br />
Our approximately 5,700 passenger stations not<br />
only serve as gateways to the rail system, they<br />
also act as hubs connecting the various modes of<br />
transport in addition to their roles as marketplaces<br />
and calling cards for cities and regions. The activities<br />
of DB Netze Stations business unit encompass<br />
the operation of the passenger stations as traffic<br />
stations as well as the development and marketing<br />
of train station space.<br />
DB NETZE ENERGY<br />
The DB Netze Energy business unit bundles together the<br />
responsibility to provide TOCs with power derived from<br />
a range of energy sources with the technical know-how<br />
needed to perform this task. We operate a high-performance<br />
energy infrastructure system to provide power<br />
and diesel fuel to mobile and stationary consumers. In<br />
addition to planning, maintenance, marketing and operation<br />
of technically complex energy networks, our range<br />
of services also includes<br />
the sustainable generation<br />
and procurement of<br />
traction and stationary<br />
energy, which is also provided<br />
to customers from<br />
the industrial, trade and<br />
services sectors.
BACK ON TRACK<br />
DB Group after the economic crisis
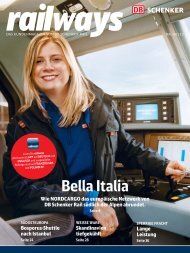
PASSENGER TRANSPORT<br />
Mobility offers are part of our core competencies. We are active across Europe in 17 countries with bus<br />
and /or rail transport provided by our DB <strong>Bahn</strong> Long-Distance, DB <strong>Bahn</strong> Regional and DB Arriva business<br />
units. Our passenger transport business proved to be robust during the economic crisis and acted as a<br />
stabilizing pillar in our Group portfolio.
95,000<br />
EMPLOYEES IN EUROPE<br />
DENMARK<br />
4,196 employees<br />
SWEDEN<br />
2,099 employees<br />
POLAND<br />
138 employees<br />
GREAT BRITAIN<br />
THE NETHERLANDS<br />
GERMANY<br />
CZECH REPUBLIC<br />
23,949 employees<br />
1,637 employees<br />
57,116 employees<br />
419 employees<br />
FRANCE<br />
BELGIUM<br />
AUSTRIA<br />
SLOVAKIA<br />
16 employees No employees No employees 1,015 employees<br />
SWITZERLAND<br />
ITALY<br />
HUNGARY<br />
146 employees 2,026 employees 244 employees<br />
PORTUGAL<br />
1,537 employees<br />
SPAIN<br />
877 employees<br />
MALTA<br />
No employees<br />
(starting 2011)<br />
Long-distance transport (rail),<br />
cross-border<br />
Regional transport (rail)<br />
Regional transport (bus)
EUROPEAN LONG-DISTANCE CONNECTIONS<br />
220 PER DAY IN 80 CITIES<br />
No. 1 in bus transport in Germany<br />
773.2 800.2 784.2<br />
2008<br />
2009<br />
<strong>2010</strong><br />
Bus transport passengers (millions, excluding DB Arriva)<br />
The development in the bus transport sector was barely<br />
influenced by the economic crisis. The business is driven by<br />
the development of tenders and demographic trends.
No. 2 in rail passenger transport in Europe<br />
1,920 1,908 1,950<br />
2008<br />
2009<br />
<strong>2010</strong><br />
Rail transport passengers (millions, excluding DB Arriva)<br />
The rail transport showed strong robustness in the economic<br />
crisis. Demand was primarily influenced by operating factors.<br />
The acquisition of Arriva means that we are also very well<br />
positioned in the European regional transport market. Arriva<br />
not only operates the well-known red double-decker buses<br />
in London, it also runs rail transports and water buses.
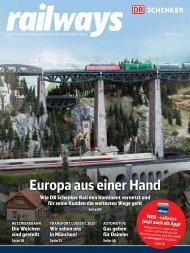
TRANSPORT AND LOGISTICS<br />
We have positioned ourselves with a single market appearance under the DB Schenker brand as a strong partner<br />
to transport and logistics customers around the world. The effects of the economic crisis were particularly felt by<br />
the rail freight transport and air freight segments.
91,000<br />
EMPLOYEES AROUND THE WORLD<br />
1 | IRELAND | 137 employees<br />
20 | FINLAND | 1,284 employees<br />
2 | GREAT BRITAIN | 4,329 employees<br />
20<br />
21 | ESTONIA | 153 employees<br />
3 | DENMARK | 516 employees<br />
18<br />
19<br />
21<br />
22<br />
22 | LATVIA | 71 employees<br />
4 | GERMANY | 32,336 employees<br />
3<br />
23<br />
24<br />
23 | LITHUANIA | 50 employees<br />
5 | THE NETHERLANDS | 2,083 employees<br />
6 | BELGIUM | 499 employees<br />
7 | LUXEMBOURG | 32 employees<br />
1<br />
2<br />
5<br />
6<br />
7<br />
4<br />
8<br />
28<br />
27<br />
25<br />
26<br />
24 | WHITE RUSSIA<br />
25 | UKRAINE | 63 employees<br />
26 | MOLDOVA | 27 employees<br />
8 | CZECH REPUBLIC | 777 employees<br />
9 | SLOVENIA | 126 employees<br />
15<br />
11<br />
10 29<br />
9 12<br />
31 32<br />
30<br />
33<br />
27 | SLOVAKIA | 128 employees<br />
28 | POLAND | 7,028 employees<br />
10 | AUSTRIA | 1,667 employees<br />
11 | SWITZERLAND | 554 employees<br />
12 | CROATIA | 99 employees<br />
17<br />
16<br />
13<br />
35<br />
34<br />
36<br />
37<br />
29 | HUNGARY | 346 employees<br />
30 | ROMANIA | 1,284 employees<br />
31 | BOSNIA-HERZEGOVINA | 38 employees<br />
13 | ITALY | 1,435 employees<br />
32 | SERBIA | 43 employees<br />
14 | MALTA<br />
14<br />
33 | BULGARIA | 317 employees<br />
15 | FRANCE | 5,961 employees<br />
34 | MACEDONIA | 37 employees<br />
16 | SPAIN | 1,791 employees<br />
35 | KOSOVO<br />
17 | PORTUGAL | 278 employees<br />
36 | ALBANIA<br />
18 | NORWAY | 1,239 employees<br />
37 | GREECE | 149 employees<br />
19 | SWEDEN | 3,824 employees<br />
AMERICAS<br />
EUROPE<br />
ASIA<br />
8,862 employees<br />
69,664 employees<br />
10,238 employees<br />
AFRICA<br />
793 employees<br />
AUSTRALIA /<br />
OCEANIA<br />
1,734 employees<br />
Logistics<br />
(DB Group companies or partners)<br />
Rail freight transport<br />
(DB Group companies or partners)
No. 1 in rail freight transport in Europe<br />
378.7 341.0 415.4<br />
80,816<br />
<strong>2010</strong><br />
2008<br />
2009<br />
<strong>2010</strong><br />
Rail freight transport (million t)<br />
The rail freight transport sector was especially hit by the<br />
effects of the economic crisis and the resulting collapse of key<br />
industries like the iron, coal and steel industry (Montan)<br />
and the automotive sector. However, driven by the improved<br />
economy in <strong>2010</strong>, volumes once again rose substantially.<br />
THE LEADING ROAD AND RAIL<br />
TRANSPORT NETWORKS IN EUROPE<br />
No. 1 in European land transport<br />
72,805 70,052<br />
2008<br />
2009<br />
Land transport (thousand shipments)<br />
Our European land transport business is recovering quickly,<br />
and in <strong>2010</strong> we were able to surpass the pre-crisis figures<br />
posted in 2008.
No. 2 in global air freight<br />
1,229<br />
1,032<br />
1,225<br />
AND LEADING GLOBAL AIR<br />
AND OCEAN FREIGHT NETWORKS<br />
No. 3 in global ocean freight<br />
1,454 1,424 1,647<br />
2008<br />
2009<br />
<strong>2010</strong><br />
2008<br />
2009<br />
<strong>2010</strong><br />
Air freight (export) (thousand t)<br />
The air freight business posted major declines in 2009. The<br />
recovery seen in <strong>2010</strong> was even more dynamic, even though we<br />
were not yet able to fully attain our pre-crisis level.<br />
Ocean freight (export) (thousand t)<br />
In 2009 our ocean freight business was again able to develop<br />
significantly better than the market as we only recorded a<br />
slight decline. In <strong>2010</strong> we had already surpassed the pre-crisis<br />
figure posted in 2008.
INFRASTRUCTURE<br />
Rail transport needs a high-performing infrastructure. Our rail network is one of the most modern – and with<br />
about 33,600 km it is also the longest – in Europe. The network’s central location in the heart of Europe is<br />
particularly important for the European transport corridors. Following the decline caused by the economic crisis,<br />
demand has once again risen sharply in <strong>2010</strong>.
49,600<br />
EMPLOYEES IN GERMANY<br />
EC/ IC/ ICE network<br />
(schematic representation)
1,043 1,003 1,034<br />
2008<br />
2009<br />
<strong>2010</strong><br />
Train kilometers on track infrastructure<br />
(million train-path km)<br />
Development of demand for train-path was particularly influenced<br />
by the drop in rail freight transport noted in the previous<br />
year, and then by the onset of the significant recovery in <strong>2010</strong>.<br />
KM – THE LONGEST RAIL<br />
33,600 NETWORK IN EUROPE
PASSENGER STATIONS<br />
5,700 IN GERMANY<br />
143.1 143.3 143.9<br />
2008<br />
2009<br />
<strong>2010</strong><br />
Station stops (million)<br />
The development of the station stops figure reflects the<br />
relatively stable development of volume produced in rail<br />
passenger transport.
Our sustained success over the long-term is becoming increasingly<br />
dependent on our employees, their qualifications as well as their<br />
willingness and ability to perform. This is because of the growing<br />
shortage of skilled labor due to demographic development as<br />
well as the changing demands impacting on job requirements.<br />
276,000<br />
EMPLOYEES AROUND THE WORLD<br />
IN 130 COUNTRIES, AND ABOUT<br />
9,000 TRAINEES IN GERMANY<br />
AMERICAS<br />
8,878 employees
DB Group has been one of the biggest companies training<br />
young people in Germany for years. For us, training and<br />
educating people, even beyond our own needs, is part of our<br />
responsibility to society. We train young people in more<br />
than 25 occupational areas.<br />
EUROPE<br />
254,669 employees<br />
ASIA<br />
10,238 employees<br />
AFRICA<br />
793 employees<br />
AUSTRALIA /<br />
OCEANIA<br />
1,734 employees
WORKING ON THE RAILWAY FOR<br />
175 YEARS IN GERMANY
FROM THE FIRST RUN OF THE ADLER IN 1835<br />
TO THE NEW ERA OF HIGH-SPEED TRAINS
CONTENTS<br />
AT A GLANCE<br />
DB GROUP’S BUSINESS UNITS<br />
10-YEAR SUMMARY<br />
FINANCIAL CALENDAR<br />
U2<br />
U3<br />
U5<br />
U7<br />
01<br />
BACK ON TRACK –<br />
DB GROUP AFTER THE ECONOMIC CRISIS 1<br />
02<br />
MAN<strong>AG</strong>EMENT BOARD AND SUPERVISORY BOARD 18<br />
CHAIRMAN’S LETTER 20<br />
MAN<strong>AG</strong>EMENT BOARD 22<br />
REPORT OF THE SUPERVISORY BOARD 24<br />
CORPORATE GOVERNANCE REPORT 28<br />
03<br />
GROUP INFORMATION 36<br />
FINANCIAL COMMUNICATION 38<br />
COMPLIANCE REPORT 40<br />
DEUTSCHE BAHN CELEBRATES 175 YEARS OF RAILWAYS IN GERMANY 42<br />
ANNUAL REVIEW <strong>2010</strong> 44<br />
GROUP PROFILE 48
04<br />
GROUP MAN<strong>AG</strong>EMENT REPORT 56<br />
OVERVIEW 58<br />
BUSINESS AND OVERALL CONDITIONS 60<br />
BUSINESS PERFORMANCE 72<br />
DEVELOPMENT OF BUSINESS UNITS 83<br />
FINANCIAL SITUATION 97<br />
STRATEGY 104<br />
SUSTAINABILITY 111<br />
TECHNOLOGY AND PROCUREMENT 118<br />
ADDITIONAL INFORMATION 121<br />
RISK REPORT 124<br />
EVENTS AFTER THE BALANCE SHEET DATE 129<br />
OUTLOOK 131<br />
05<br />
CONSOLIDATED FINANCIAL STATEMENTS 140<br />
AUDITOR’S REPORT 142<br />
CONSOLIDATED STATEMENT OF INCOME 143<br />
CONSOLIDATED BALANCE SHEET 144<br />
CONSOLIDATED STATEMENT OF CASH FLOWS 146<br />
CONSOLIDATED STATEMENT OF CHANGES IN EQUITY 147<br />
NOTES TO THE CONSOLIDATED FINANCIAL STATEMENTS 148<br />
06<br />
ADDITIONAL INFORMATION 262<br />
DB ADVISORY BOARD 264<br />
GLOSSARY 265<br />
LIST OF ABBREVIATIONS 267<br />
CONTACTS 268<br />
IMPRINT 268
DR. RÜDIGER GRUBE<br />
CEO and Chairman<br />
of the Management Board<br />
of <strong>Deutsche</strong> <strong>Bahn</strong> <strong>AG</strong>
| CHAIRMAN’S LETTER 21<br />
Chairman’s letter<br />
Dear ladies and gentlemen,<br />
First, I would like to express my thanks to our customers and our employees for the trust they placed in us, because they were<br />
the ones who made it possible for us to get back on track for growth following the global financial and economic crisis. Furthermore,<br />
we also recovered from the negative effects faster than we had expected. Our corporate structure proved to be stable during<br />
the crisis and quick to expand when the economy rebounded. And with revenues of 33.4 billion euros – excluding Arriva – we are<br />
almost back up to the record level set in 2008. Moreover, our adjusted EBIT figure of 1.9 billion euros has also improved notably.<br />
In order to further develop our rail transport activities we launched four initiatives in <strong>2010</strong>: the Customer and Quality<br />
Initiative, Capital Expenditures Initiative, Engineering Initiative, as well as our Market Initiative. Along with profitable and<br />
sustainable growth these initiatives are primarily aimed at improving our performance as a railway. The key lever for achieving<br />
this is having greater availability of our vehicles and an improved infrastructure. We also launched numerous measures to improve<br />
passenger service and travel information. Our goal here is to achieve a sustainable improvement – above all in Germany – so we<br />
can convince even more people to travel via rail.<br />
Following the acquisition of Arriva our Passenger Transport division is now present in 13 European countries. With this<br />
move we created a platform for further growth that will enable us to actively participate in the opening of the local transport<br />
markets across Europe. Another milestone was the premiere of the ICE in London. The future connection from Germany to the<br />
British capital is a shining example of the gradual expansion of cross-border routes. Meanwhile, in our home market of Germany,<br />
which will naturally remain the backbone of our business, we were able to win 65 percent of the train kilometers awarded in the<br />
regional transport market in <strong>2010</strong>.<br />
The main focus of the Transport and Logistics division was on recovering from the global economic crisis. We defended our<br />
leading position in the transport and logistics market while at the same time the DB Schenker Logistics business unit posted an<br />
unusually strong 27 percent increase in revenues, and the DB Schenker Rail business unit raised their revenues by 13 percent.<br />
Numerous projects were either continued or newly launched by the Infrastructure division to expand and modernize our<br />
rail network, our train stations and our energy procurement processes. The start of construction on the Stuttgart–Ulm rail<br />
project marked a decisive breakthrough for us. The financing of the rail requirements plan remains a major political task. We are<br />
absolutely adamant here in insisting that Germany must have a rail infrastructure that can successfully cope with future demands.<br />
In <strong>2010</strong> challenges arose in the area of overall regulatory conditions in Germany and Europe. We believe that the priorities<br />
in this area should be placed on the actual opening of the national markets – as has been the case in Germany since the Rail Reform<br />
Act of 1994 – as well as on an entrepreneurial orientation of the rail sector. Furthermore, reducing bureaucracy and enhancing<br />
the speed and efficiency of processes must also remain important goals.<br />
During the year under review our employees were a matter of particular importance for the members of the Management<br />
Board and myself. Once again we were one of the biggest occupational trainers in Germany thereby securing our future workforce<br />
in times of demographic change. The Management Board placed special emphasis on the continued development of our corporate<br />
culture. In this context we introduced a sustainable process which we will fill with life at all levels of our organization. I would<br />
especially like to thank our employees for their dedicated efforts in <strong>2010</strong>.<br />
In 2011 we will continue to resolutely take the steps needed to reach our goal of becoming a clearly customer-oriented railway<br />
and a successful service company.<br />
Sincerely yours,<br />
Dr. Rüdiger Grube<br />
CEO and Chairman<br />
of the Management Board<br />
of <strong>Deutsche</strong> <strong>Bahn</strong> <strong>AG</strong>
22<br />
| DEUTSCHE BAHN GROUP<br />
Management Board<br />
From left to right<br />
DR. RICHARD LUTZ<br />
CFO<br />
Born in 1964<br />
Appointed until 2013<br />
GERD BECHT<br />
Compliance, Privacy<br />
and Legal Affairs<br />
Born in 1952<br />
Appointed until 2014<br />
DR. RÜDIGER GRUBE<br />
CEO and Chairman<br />
Born in 1951<br />
Appointed until 2014<br />
DR. VOLKER KEFER<br />
Rail Technology and Services,<br />
Infrastructure<br />
Born in 1956<br />
Appointed until 2012<br />
ULRICH WEBER<br />
Personnel<br />
Born in 1950<br />
Appointed until 2014<br />
Information with respect to the CVs are available at:<br />
www.deutschebahn.com/man-board
| MAN<strong>AG</strong>EMENT BOARD 23
24<br />
| DEUTSCHE BAHN GROUP<br />
<strong>Report</strong> of the Supervisory Board<br />
During the year under review the Supervisory Board carried out its supervisory functions in accordance<br />
with the legal requirements, the company’s Articles of Association and its bylaws. It extensively advised<br />
and supervised the Management Board in the management of the company as well as the management of its<br />
business operations. The Management Board informed the Supervisory Board regularly, without delay and<br />
comprehensively, especially about all issues regarding corporate planning, and the business, strategic and<br />
financial development of <strong>Deutsche</strong> <strong>Bahn</strong> <strong>AG</strong> (DB <strong>AG</strong>) and its subsidiary companies. All business issues of<br />
fundamental importance were discussed in plenary meetings and the relevant Supervisory Board committees<br />
based on reports prepared by the Management Board. Significant deviations in the actual business<br />
development were pointed out by the Management Board and examined by the Supervisory Board. The<br />
Chairman of the Supervisory Board remained in close contact with the Chairman of the Management Board<br />
and was kept regularly informed about <strong>Deutsche</strong> <strong>Bahn</strong> Group’s (DB Group) current business developments,<br />
pending business decisions and risk management. The Supervisory Board was involved in all decisions of<br />
fundamental importance for DB <strong>AG</strong>. No member of the Supervisory Board attended fewer than half of the<br />
meetings of the Supervisory Board.<br />
MEETINGS OF THE SUPERVISORY BOARD<br />
The Supervisory Board was newly constituted in March <strong>2010</strong> at the end of its previous term. During the year<br />
under review the Supervisory Board met for its constituent meeting as well as four regular meetings and<br />
one extraordinary meeting. In three cases, resolutions were adopted on the basis of written procedures. The<br />
meetings of the Supervisory Board were prepared by meetings of the Executive Committee, the Personnel<br />
Committee and the Audit and Compliance Committee.<br />
The focal points of discussions in the plenary meetings were the development of DB Group’s revenues,<br />
results and employment situation, as well as significant capital expenditure, participation and divestment<br />
projects. Furthermore, the Supervisory Board also considered DB Group’s strategy as well as the strategies<br />
pursued by the individual divisions. In addition, the Supervisory Board dealt intensively with the technical<br />
deficiencies affecting the ICE fleet and the S-<strong>Bahn</strong> (metro) vehicles in Berlin, which had major operational<br />
and financial repercussions on the rail passenger transport business. Moreover, during the year under review<br />
the Supervisory Board repeatedly requested reports on the weather-related disturbances in rail transport<br />
operations that took place, as well as the measures taken to preclude them. In many of its meetings the<br />
Supervisory Board also dealt with the status of the major Stuttgart 21 Project. The main purpose of the<br />
extraordinary meeting of the Supervisory Board held in April <strong>2010</strong> was to deliberate the takeover offer for<br />
Arriva Plc (Arriva), Sunderland /Great Britain, for which the Supervisory Board gave its consent. The<br />
progress of the acquisition process as well as the integration of Arriva into DB Group were discussed during<br />
the subsequent meetings of the Supervisory Board. Due to the legal requirements imposed by anti-trust law,<br />
the Supervisory Board consented to the divestment of Arriva’s activities in Germany in December <strong>2010</strong>.<br />
In December <strong>2010</strong> the Supervisory Board took DB Group’s mid-term plan covering 2011 to 2015 under<br />
con sideration, and consented to DB Group’s budget for the 2011 financial year and its capital expenditure<br />
plans.<br />
There were no conflicts of interest reported involving members of the Management Board and Supervisory<br />
Board which had to be disclosed to the Supervisory Board.<br />
MEETINGS OF THE SUPERVISORY BOARD COMMITTEES<br />
The Supervisory Board has established four permanent committees to facilitate its work and increase its<br />
efficiency. The Executive Committee of the Supervisory Board met six times during the year under review<br />
and was in continual contact with the Management Board regarding all fundamental business policy issues.<br />
This was also the method used to prepare various key issues, in particular, for the Board’s meetings.
PROFESSOR DR. DR. UTZ-HELLMUTH FELCHT<br />
Chairman of the Supervisory Board of <strong>Deutsche</strong> <strong>Bahn</strong> <strong>AG</strong><br />
During the year under review the Audit and Compliance Committee held four meetings and one telephone<br />
conference, and primarily dealt with the quarterly financial statements, the six-month financial statements<br />
and the related review results, as well as the six-month review of major capital expenditure projects.<br />
Additional focal points were the <strong>2010</strong> forecast and DB Group’s mid-term plan covering the period 2011 to<br />
2015. The Audit and Compliance Committee kept itself informed about the operational difficulties experienced<br />
by the S-<strong>Bahn</strong> (metro) Berlin, the technical deficiencies in the ICE fleet, as well as the progress and<br />
development of costs associated with the major Stuttgart 21 project. Furthermore, the Audit and Compliance<br />
Committee also considered issues pertaining to accounting and risk management, the further development<br />
of corporate governance due to the passage of the Public Corporate Governance Code and the Accounting<br />
Law Modernization Act, and the resulting changes to the rules of procedure for the Audit and Compliance<br />
Committee. The Audit and Compliance Committee also kept itself informed about the business development<br />
of acquisitions, the issuing of the audit mandate to the auditor, as well as the results of the internal audit and<br />
compliance-related investigations.<br />
The Chairman of the Audit and Compliance Committee maintained regular contact with the CFO and<br />
the auditor, and regularly and extensively reported to the plenary meeting regarding the Committee’s work.<br />
During the year under review the Personnel Committee met three times to prepare personnel decisions<br />
for the Supervisory Board, and in particular prepared a peer group comparison as an addition to the Long-Term<br />
Incentive Plan for the Management Board. Moreover, on behalf of the Supervisory Board the Personnel Committee<br />
prepared the target agreements for the members of the Management Board for the 2011 financial year.<br />
The Mediation Committee, which was established in accordance with Article 27, Para. 3 of the Codetermination<br />
Act (MitbestG), did not have to meet during the year under review.
26<br />
| DEUTSCHE BAHN GROUP<br />
CORPORATE GOVERNANCE<br />
During the year under review the Management Board and Supervisory Board again considered the further<br />
development of Corporate Governance. With the Cabinet resolution of July 1, 2009, the Federal Government<br />
adopted the German Public Corporate Governance Code. The German Public Corporate Governance Code<br />
contains the essential provisions of existing laws regarding the management and supervision of unlisted<br />
companies in which the Federal Republic of Germany holds a majority stake, as well as internationally and<br />
nationally recognized standards of good and responsible management. The Supervisory Board was intensively<br />
engaged in implementing the Public Corporate Governance Code within DB Group and took the<br />
necessary related decisions.<br />
Furthermore, the passage of the Accounting Law Modernization Act (BilMoG) in May 2009 redefined<br />
the main emphasis of audit committee work as described in the German Stock Corporation Act (AktG).<br />
Therefore, the rules of procedure for the Supervisory Board’s Audit and Compliance Committee were clarified<br />
to the extent that, as part of its supervisory function, the Audit and Compliance Committee will also regularly<br />
inform itself about the effectiveness and appropriateness of the risk management and the internal control<br />
systems in accordance with the requirements stated in Article 107, Para. 3 (2) of the AktG. The DB <strong>AG</strong> Supervisory<br />
Board consented to the revision of the rules of procedure for the Audit and Compliance Committee.<br />
ANNUAL FINANCIAL STATEMENTS<br />
The annual financial statements and the management report of DB <strong>AG</strong> prepared by the Management Board<br />
as well as the consolidated financial statements and Group management report for the period ending<br />
Decem ber 31, <strong>2010</strong> were audited by the auditor elected by the <strong>Annual</strong> General Meeting, Pricewaterhouse-<br />
Coopers Aktiengesellschaft Wirtschaftsprüfungsgesellschaft (PwC), Berlin, and received the auditor’s<br />
unqualified certification. In addition, the auditor also audited the risk management system as part of the<br />
annual audit and did not raise any objections.<br />
The auditor’s report was the subject of the Audit and Compliance Committee meeting held on March 28,<br />
2011 and was also extensively discussed during the Supervisory Board’s financial statements meeting on<br />
March 30, 2011 that took place in the presence of the auditor who signed the auditor’s report. The auditor<br />
reported on the fundamental results of the audit and was available to answer questions. The Supervisory<br />
Board concurred with the results of the audit.<br />
The Supervisory Board examined DB <strong>AG</strong>’s annual financial statements and management report, as well<br />
as the consolidated financial statements and the Group management report for the year under review, as<br />
well as the proposed allocation of profits, and did not express any reservations. The annual financial statements<br />
of DB <strong>AG</strong> for the <strong>2010</strong> financial year were approved, and are thus adopted.<br />
The auditor also audited the report prepared by the Management Board concerning relations with<br />
affiliated companies. The auditor has issued an unqualified auditor’s certificate, and reported on the result<br />
of the audit.<br />
The Supervisory Board examined this report, and did not express any reservations regarding the closing<br />
statement of the Management Board included in the report and the results of the audit by the auditor.
| REPORT OF THE SUPERVISORY BOARD 27<br />
CHANGES IN DB <strong>AG</strong>’S SUPERVISORY BOARD AND THE MAN<strong>AG</strong>EMENT BOARD<br />
Professor Dr. Dr. Utz-Hellmuth Felcht was elected Chairman of the Supervisory Board on March 24, <strong>2010</strong>.<br />
He succeeds Dr. Werner Müller whose mandate ended on this date due to the expiration of his term of office.<br />
The term of office of the following members of the DB <strong>AG</strong> Supervisory Board ended on March 24, <strong>2010</strong>:<br />
shareholder representatives Mr. Georg Brunnhuber and Mr. Niels-Lund Chrestensen; employee representatives<br />
Mr. Jörg Hartkorn and Ms. Heike Moll. New members elected to the Supervisory Board effective<br />
March 24, <strong>2010</strong> were: Mr. Patrick Döring and Professor Dr. Knut Löschke were elected as shareholder<br />
representatives. On March 11, <strong>2010</strong> Messrs. Mario Reiß and Wolfgang Joosten were newly elected to the<br />
Supervisory Board as employee representatives.<br />
Dr. Walther Otremba, who resigned his mandate as member of the Supervisory Board effective March 8,<br />
<strong>2010</strong>, was succeeded by State Secretary Dr. Hans Bernhard Beus, who was seconded to the Supervisory<br />
Board effective March 9, <strong>2010</strong>.<br />
Effective March 31, <strong>2010</strong> Mr. Diethelm Sack resigned his mandate as member of the DB <strong>AG</strong> Management<br />
Board, where he was the Chief Financial Officer. He was succeeded effective April 1, <strong>2010</strong> by Dr. Richard<br />
Lutz. Effective March 31, <strong>2010</strong> Mr. Stefan Garber also resigned his mandate as member of the DB <strong>AG</strong> Management<br />
Board, where he was the head of the Infrastructure division. He was succeeded on April 1, <strong>2010</strong> by<br />
Dr. Volker Kefer who will serve for the remainder of his existing term. Dr. Kefer had already served as the<br />
provisional head of the Infrastructure division since December 9, 2009. Dr. Kefer is also responsible for the<br />
Rail Technology and Services Division.<br />
At this point, the Supervisory Board would also like to thank the former members of the Management<br />
Board and Supervisory Board for their committed and constructive support on behalf of the company.<br />
The Supervisory Board thanks the Management Board, all employees as well as the DB <strong>AG</strong> employees’<br />
representatives and its affiliated companies for their dedicated efforts during the year under review.<br />
Berlin, March 2011<br />
For the Supervisory Board<br />
Sincerely,<br />
Professor Dr. Dr. Utz-Hellmuth Felcht<br />
Chairman of the Supervisory Board<br />
of <strong>Deutsche</strong> <strong>Bahn</strong> <strong>AG</strong>
28<br />
| DEUTSCHE BAHN GROUP<br />
Corporate Governance report<br />
a The Corporate Governance report is part of the Group management report<br />
a Good corporate governance is a significant foundation for corporate success<br />
a Public Corporate Governance Code recommendations observed with one exception<br />
Corporate governance regulations are designed to ensure good,<br />
responsible and value-driven corporate governance. The Federal<br />
Government established the Public Corporate Governance Code<br />
of the Federal Government (PCGK) on July 1, 2009 to create<br />
standards of good corporate and investment governance. The<br />
PCGK contains significant provisions of current laws for managing<br />
and supervising non-listed companies in which the Federal<br />
Government holds a majority stake, and it also includes internationally<br />
and nationally recognized standards for good and<br />
responsible governance. The objective of the PCGK is to make<br />
corporate governance and oversight more transparent and<br />
understandable, and to more clearly define the Federal Government’s<br />
role as a shareholder representative. At the same time,<br />
it is intended to promote the awareness of good corporate<br />
governance.<br />
We believe that good corporate governance is a significant<br />
foundation for the success of <strong>Deutsche</strong> <strong>Bahn</strong> Group (DB Group).<br />
Our goal is to increase the company’s value in the long term,<br />
thereby promoting the interests of customers, business partners,<br />
investors, employees and the public while preserving and<br />
expanding their trust in DB Group.<br />
The Supervisory Board of DB <strong>AG</strong> has adopted the A bylaws<br />
[1] for the Management Board and Supervisory Board of<br />
<strong>Deutsche</strong> <strong>Bahn</strong> <strong>AG</strong> (DB <strong>AG</strong>) to meet PCGK requirements. The<br />
PCGK applies to the DB Group companies to the legal extent<br />
possible and technically appropriate in view of the special features<br />
of a Group structure. Group-wide compliance with the<br />
PCGK principles was established by approval of sample rules of<br />
procedure for the Supervisory Boards of the Group companies.<br />
DECLARATION OF CONFORMITY<br />
The Management Board and Supervisory Board of DB <strong>AG</strong> jointly<br />
declare: “Since the last declaration of conformity made on March<br />
24, <strong>2010</strong>, DB <strong>AG</strong> has complied with the recommendations of the<br />
Public Corporate Governance Code of the Federal Government<br />
adopted by the Federal Government on July 1, 2009 with the<br />
following exception: During the <strong>2010</strong> financial year the Directors<br />
and Officers Liability insurance policy (D&O insurance) taken<br />
out by DB <strong>AG</strong> for the Supervisory Board members of companies<br />
within the Group deviated from the recommendation stated in<br />
section 3.3.2 PCGK and did not contain a deductible amount. The<br />
decision-making process regarding the structure of an appropriate<br />
deductible amount was not concluded in <strong>2010</strong>. An agreement<br />
concerning an appropriate deductible amount for Supervisory<br />
Board members will be reached in 2011. DB <strong>AG</strong> also intends to<br />
observe the remaining PCGK recommendations in the future.”<br />
COOPERATION BETWEEN THE MAN<strong>AG</strong>EMENT<br />
BOARD AND THE SUPERVISORY BOARD<br />
As a German stock corporation, DB <strong>AG</strong>’s Management Board and<br />
Supervisory Board are subject to a dual level management and<br />
supervisory structure. These two committees are strictly separated,<br />
both in terms of their membership and in terms of their<br />
responsibilities. The Management Board is solely responsible for<br />
managing the company. The Supervisory Board supervises the<br />
Management Board’s activities and is responsible for appointing<br />
and removing members of the Management Board.<br />
In the interest of creating the best possible company management<br />
system, we place great value on maintaining a continuous<br />
dialogue between the Management Board and the Supervisory<br />
Board, and work together in a trustful and efficient manner for<br />
the benefit of the company. The Management Board regularly<br />
informs the Supervisory Board, in a timely and comprehensive<br />
manner, about all issues that are relevant for the company –<br />
especially planning, business development, the risk situation and<br />
risk management as well as the internal controlling system.<br />
| [1] A www.db.de/bylaws
| CORPORATE GOVERNANCE REPORT 29<br />
An overview of the A members of the Management Board<br />
and the Supervisory Board [1], including the mandates they<br />
hold, is included in the Group notes.<br />
Management Board<br />
The Management Board is solely responsible for managing the<br />
company. It is bound to the company interests and obligated to<br />
permanently increase the value of the company. It sets company<br />
objectives and defines the strategies with which these objectives<br />
are to be attained. The Management Board makes decisions<br />
regarding all matters of fundamental and significant importance<br />
for the company.<br />
Details about the personnel changes in the Management<br />
Board can be found in the A Group management report [2]<br />
and the A <strong>Report</strong> of the Supervisory Board [3].<br />
The DB <strong>AG</strong> Management Board consists of six divisions. In<br />
addition to the Chairman’s division, the Managing Board consists<br />
of the following divisions: Finance/Controlling; Personnel;<br />
Infrastructure; Compliance, Privacy and Legal Affairs; and Rail<br />
Technology and Services.<br />
The members of the Management Board must report any<br />
conflicts of interest to the Supervisory Board without delay and<br />
inform their colleagues on the Management Board. No such<br />
cases occurred during the year under review.<br />
In order to ensure an integrated Group management<br />
approach, the DB <strong>AG</strong> Management Board’s meetings are normally<br />
held concurrently with meetings of the DB Mobility Logistics<br />
(DB ML<strong>AG</strong>) Management Board.<br />
Supervisory Board<br />
The Supervisory Board advises and supervises the Management<br />
Board’s work in managing the company. The DB <strong>AG</strong> Supervisory<br />
Board has 20 members, and in accordance with the terms of the<br />
Codetermination Act ten of these members are shareholder<br />
representatives, and ten are employee representatives. Some<br />
of the shareholder representatives are appointed, and some are<br />
elected by the <strong>Annual</strong> General Meeting. The members on the<br />
employee side are elected according to the requirements of the<br />
Codetermination Act. Currently, the Supervisory Board includes<br />
two women. The Chairman of the Supervisory Board is Professor<br />
Dr. Dr. Utz-Hellmuth Felcht. Any A personal or business<br />
relationships [4] between individual Supervisory Board members<br />
and the company are listed in the Group’s notes.<br />
The members of the Supervisory Board must disclose any conflicts<br />
of interest which arise to the Supervisory Board without<br />
delay and must also inform their colleagues on the Supervisory<br />
Board. No such cases occurred during the year under review.<br />
Transactions of fundamental importance, as well as Management<br />
Board decisions that will have a significant effect on<br />
the company’s business activities and its assets, financial situation<br />
or earnings situation, require the approval of the Supervisory<br />
Board. The Management Board informs the Supervisory<br />
Board of DB Group’s business development and circumstances<br />
on at least a quarterly basis. The Management Board also regularly<br />
informs the Supervisory Board of measures taken within<br />
DB Group to comply with laws and internal company rules (Compliance).<br />
The Supervisory Board’s duties also include auditing<br />
and approving DB <strong>AG</strong>’s annual financial statements, auditing<br />
DB <strong>AG</strong>’s Management <strong>Report</strong>, the Group consolidated financial<br />
statements, and the Group Management <strong>Report</strong> for DB <strong>AG</strong>. The<br />
Supervisory Board also supervises the accounting process; the<br />
efficiency of the internal controlling system, risk management<br />
system and internal auditing system; and the annual audit.<br />
In addition, the Chairman of the Supervisory Board is in<br />
regular contact with the Management Board, and particularly<br />
with the Chairman of the Management Board, and deliberates<br />
DB Group’s strategy, business development and risk management<br />
with them. The Chairman of the Management Board regularly<br />
informs the Chairman of the Supervisory Board about events<br />
that have a significant impact on evaluating the business situation<br />
and development of DB <strong>AG</strong> as well as the management of<br />
the company.<br />
During the <strong>2010</strong> financial year, there were again no consulting<br />
agreements or other comparable service or work agreements<br />
between the members of the Supervisory Board and DB <strong>AG</strong>.<br />
JOINT SUPERVISORY BOARD MEETINGS<br />
In order to increase the efficiency of their deliberations, the<br />
DB <strong>AG</strong> Supervisory Board and the DB ML<strong>AG</strong> Supervisory Board<br />
regularly hold joint meetings. Each Supervisory Board’s resolutions<br />
are decided by its own members. It is fundamentally possible<br />
to hold separate Supervisory Board meetings.<br />
| [1] A Page 258 ff. | [2] A Page 60<br />
| [3] A Page 27<br />
| [4] A Page 238
30<br />
| DEUTSCHE BAHN GROUP<br />
SUPERVISORY BOARD COMMITTEES<br />
In order to carry out its supervisory tasks in the best possible<br />
manner, the Supervisory Board has taken advantage of the possibility<br />
to form committees and created the following committees:<br />
Executive Committee, Audit and Compliance Committee, Personnel<br />
Committee and a Mediation Committee. An overview of<br />
the A members of these committees [1] can be found in the<br />
Group notes. The Supervisory Board’s report explains the A<br />
work done by the committees [2] during the year under review.<br />
A A description of the individual committees’ functions [3]<br />
can be found on our Web site.<br />
These regular reports on the internal controlling system inform<br />
the Audit and Compliance Committee about a project’s progress<br />
and about the appropriateness and effectiveness of the internal<br />
controlling system. In addition, the Management Board reports<br />
to the Audit and Compliance Committee about significant risks<br />
facing DB <strong>AG</strong> and DB Group and how they are being handled by<br />
the Management Board. It also checks if the early risk detection<br />
system meets the requirements of Article 91 Para. 2 of the AktG<br />
(Stock Corporation Act).<br />
COMPLIANCE<br />
TRANSPARENCY<br />
Our A Web site [4] provides all of the important information<br />
regarding the Group and the annual financial statements, the<br />
interim report and the financial calendar, as well as information<br />
about any securities transactions that must be disclosed. In<br />
addition, we regularly provide information about current developments<br />
within the framework of our investor relations activities<br />
and our corporate communications.<br />
RISK MAN<strong>AG</strong>EMENT<br />
Good management also includes the responsible handling of<br />
opportunities and risks which arise in connection with business<br />
activities. This is why the early identification and limitation of<br />
business risks is of such great importance to the Management<br />
Board and Supervisory Board.<br />
It is the Management Board’s duty to create appropriate<br />
risk management and monitoring systems within the company<br />
and to continue further developing both of these. The Accounting<br />
Law Modernization Act (BilMoG) defined the tasks of the Supervisory<br />
Board with regard to monitoring the accounting process<br />
and the effectiveness of the internal controlling system, as well<br />
as the risk management system and internal auditing system.<br />
In order for the Supervisory Board to fulfill this task, it must be<br />
provided with the necessary information so it can evaluate the<br />
appropriateness and functionality of the systems. The Management<br />
Board has established internal controlling system reports<br />
within the framework of a Group-wide project for this purpose.<br />
The Integrated Compliance Management system in DB Group<br />
ensures Group-wide compliance with laws and regulations, and<br />
is a significant building block of our corporate culture. The<br />
activities of DB <strong>AG</strong> are subject to national and international<br />
requirements as well as our own values and rules. The corporate<br />
values of DB Group have been summarized in a A Code of<br />
Conduct [5] that applies to all companies within the Group. The<br />
objective of the Code of Conduct is to help the organs and<br />
employees of DB Group observe and implement specific rules<br />
of conduct with regard to society, competitors, elected officials<br />
and business partners, as well as vis-à-vis the owner and in their<br />
interactions with one another. We use a wide range of training<br />
programs based on a risk-awareness approach to educate our<br />
employees on the meaning of the Code of Conduct as well as<br />
the definitive laws and regulations. Departmental managers and<br />
the responsible organizational units are responsible for ensuring<br />
that they and their employees comply with regulations.<br />
In order to ensure a rule-compliant corporate organization,<br />
we further developed the integrated compliance management<br />
system introduced last year with a clearly preventive focus,<br />
particularly with regard to the decentralized structures in the<br />
business units and subsidiaries.<br />
Further information about the topic of compliance can be<br />
found in the A Compliance report [6].<br />
| [1] A Page 261 | [2] A Page 24 f.<br />
| [5] A www.db.de/coc<br />
| [3] A www.db.de/committees<br />
| [6] A Page 40 f.<br />
| [4] A www.db.de/ir-e
| CORPORATE GOVERNANCE REPORT 31<br />
ACCOUNTING AND AUDIT OF THE ANNUAL<br />
FINANCIAL STATEMENTS<br />
On March 24, <strong>2010</strong>, the Shareholders’ Meeting appointed PricewaterhouseCoopers<br />
Aktiengesellschaft Wirtschaftsprüfungsgesellschaft<br />
(PwC), Berlin, as the auditor for the <strong>2010</strong> financial<br />
year. The Audit and Compliance Committee prepared the Supervisory<br />
Board’s suggestion for selecting the auditor. After the<br />
auditor had been confirmed by the Shareholders’ Meeting, the<br />
Committee worked with the auditor to determine the main points<br />
of the audit. It was again agreed with this year’s auditor that the<br />
Chairman of the Audit and Compliance Committee would be<br />
informed immediately of any possible grounds for exclusion or<br />
bias if these were not resolved immediately. In addition, it was<br />
agreed that the auditor would immediately inform the Committee<br />
Chairman of any separate discrepancies or potential irregularities<br />
in the Declaration of Conformity.<br />
SUPERVISORY BOARD EFFICIENCY AUDIT<br />
The Supervisory Board regularly audits the efficiency of its<br />
activities. The efficiency audit is carried out every two years.<br />
The next audit will take place in 2011.<br />
COMPENSATION REPORT<br />
The compensation report describes the compensation system<br />
and individual compensation for the members of the Supervisory<br />
Board and the Management Board.<br />
Compensation of the Management Board<br />
The compensation system for DB <strong>AG</strong>’s Management Board aims<br />
to provide appropriate compensation to the members of the<br />
Management Board in accordance with their duties and areas<br />
of responsibility, and to directly consider the performance of<br />
each Management Board member as well as the success of the<br />
company.<br />
The appropriate level of compensation is regularly reviewed<br />
through a comparison process. This process reviews the level<br />
of Management Board compensation in comparison with the<br />
external market (horizontal appropriateness) and with other<br />
compensation within the company (vertical appropriateness).<br />
If this process reveals a need to modify the compensation system<br />
or the compensation amount, the Personnel Committee of the<br />
Supervisory Board will make corresponding suggestions to the<br />
Supervisory Board for approval.<br />
COMPENSATION COMPONENTS<br />
The total compensation for Management Board members consists<br />
of a fixed basic compensation, a performance-linked annual<br />
director’s fee, and a long-term bonus program with a multi-year<br />
measurement basis (long-term incentive plan). Total compensation<br />
also includes benefit commitments, other commitments,<br />
and ancillary benefits.<br />
Fixed basic compensation is a cash compensation linked to<br />
the financial year that is based on the scope of responsibility and<br />
the experience of each Management Board member. The individually<br />
defined fixed income is paid out in 12 equal installments.<br />
The annual performance-linked director’s fee is calculated<br />
using a factor linked to the achievement of business targets based<br />
on key performance figures (director’s fee factor) and the achievement<br />
of individual targets (performance factor). The director’s<br />
fee factor and the performance factor are multiplicatively linked.<br />
The size of the director’s fee factor depends on the level of success<br />
in attaining the business goals set by corpo rate planning.<br />
The parameters for this relationship are equal parts operational<br />
success (EBIT) and return on capital employed (ROCE).<br />
The performance factor reflects the success in meeting<br />
personal targets. The target fee corresponds to the annual<br />
director’s fee that the Management Board member receives for<br />
fully meeting performance goals during a “normal financial year”<br />
(meeting the objectives). If company profits do not meet the<br />
planned objectives, the fee factor – regardless of personal performance<br />
– can be reduced to zero in extreme cases. Thus the<br />
annual director’s fee can be omitted completely. If planned<br />
objectives are significantly exceeded and the maximum performance<br />
factor is also achieved, the director’s fee can amount to<br />
2.6 times the target fee.<br />
The economic and personal targets of the Management<br />
Board members are agreed with the Management Board members<br />
in writing each year, based on recommendations made by<br />
the Supervisory Board’s Personnel Committee.<br />
Together with the plan established by the Supervisory<br />
Board, the personal targets form the basis for assessing the<br />
annual director’s fee. Thus all of the significant parameters for<br />
total compensation are established at the beginning of the<br />
financial year.<br />
At the end of a financial year, the Group results are used as<br />
the basis for calculating the director’s fee factor and personal<br />
performance factor for each member of the Management Board.<br />
The target income is attained if the Group performance goals<br />
as well as the individual targets have been fully met. The final<br />
decision is made by the Supervisory Board and prepared by the<br />
Personnel Committee.
32<br />
| DEUTSCHE BAHN GROUP<br />
The long-term incentive is determined according to the sustained<br />
increase in the value of the company. This measurement basis<br />
rewards the attaining and/or exceeding of mid-term operational<br />
earnings targets and their effect on the company’s value. The<br />
term of the plan will be four years, and it will be redrafted on a<br />
rolling basis each year.<br />
At the end of each planning period, the increased value<br />
attained in comparison with the business goals and the disbursement<br />
amount are determined.<br />
The target value of the long-term incentive plan introduced<br />
in <strong>2010</strong> is approximately two-thirds of the previous director’s<br />
fee. The disbursement amount for the long-term incentive plan<br />
has an upper limit and can vary between 0 % and 300 %. Claims<br />
from the long-term incentive plan are inheritable.<br />
In December <strong>2010</strong>, the Supervisory Board decided to supplement<br />
the plan requirements for the long-term incentive plan by<br />
adding a peer group comparison, beginning in the 2011 financial<br />
year. In the future, the disbursement amount of the long-term<br />
incentive plan will be modified according to the company’s<br />
external performance in comparison with a peer group.<br />
The members of the Management Board are entitled to an<br />
appropriate severance arrangement if the contract is terminated<br />
before the contractually agreed-upon termination date and no<br />
material cause exists for which the members of the Management<br />
Board themselves are responsible. The severance arrangement<br />
is based the remaining term of the contract, the agreed target<br />
compensation and, if applicable, the pension benefits already<br />
owed by DB <strong>AG</strong> for the remainder of the contract.<br />
In accordance with recommendations made by the PCGK,<br />
DB <strong>AG</strong> included a compensation cap in all Management Board<br />
contracts. According to this, payments made to a Management<br />
Board member upon premature termination of Management<br />
Board duties cannot, without good cause as defined by Article<br />
626 of the BGB (German Civil Code), exceed the value of two<br />
years’ salary, including variable compensation components.<br />
The members of the Management Board do not receive any<br />
additional compensation for mandates exercised in control<br />
bodies of other Group companies and affiliated companies.<br />
PENSION ENTITLEMENTS<br />
The Supervisory Board defined a general retirement age of 65.<br />
After leaving the company, the members of the Management<br />
Board are entitled to pension payments. A Management Board<br />
member is entitled to a lifelong pension if the term of employment<br />
ends due to permanent disability, or if the contract is<br />
terminated before the agreed-upon termination date or is not<br />
extended and no material cause exists, or if the Management<br />
Board member refuses to continue the contract under the same<br />
or more beneficial conditions.<br />
Company pension commitments equal a percentage of the<br />
basic compensation, based on how long the Management Board<br />
member has been with the company. Pension commitments<br />
include lifelong retirement and/or survivor benefits. There is<br />
no lump-sum option.<br />
Furthermore, DB <strong>AG</strong> has taken out a reinsurance policy<br />
covering company pension benefits for Management Board<br />
contracts concluded before January 1, 2009.<br />
CONTRACTUAL ANCILLARY BENEFITS<br />
As contractual ancillary benefits, the members of the Management<br />
Board are, among other things, entitled to a company car<br />
and driver for business and personal use, a personal first-class<br />
<strong>Bahn</strong>Card (<strong>Bahn</strong>Card 100 First) for all of the company’s rail<br />
routes, and standard insurance coverage. A housing allowance<br />
is granted for second homes as required for business purposes.<br />
These non-cash benefits, if they cannot be granted on a tax-free<br />
basis, are taxed as non-monetary benefits for which the Management<br />
Board members are individually responsible. In December<br />
<strong>2010</strong>, the Supervisory Board approved the assumption of costs<br />
by the company for any personal and building security measures<br />
necessitated by membership on the Management Board. Taxes<br />
on any resulting non-cash benefits will be paid by the company.<br />
Just like all members of the Group’s executive staff, Management<br />
Board members may choose to take part in the company’s<br />
deferred compensation program.<br />
The members of the Management Board are covered by<br />
liability insurance against financial losses (D&O insurance)<br />
incurred due to working for DB <strong>AG</strong>. In the <strong>2010</strong> financial year,<br />
this insurance was offered as a group insurance policy with the<br />
legally established deductible; it provides coverage for potential<br />
financial losses arising from carrying out Management Board<br />
activities.<br />
COMPENSATION OF THE MAN<strong>AG</strong>EMENT BOARD<br />
IN THE <strong>2010</strong> FINANCIAL YEAR<br />
The director’s fee for the previous financial year falls due at the<br />
end of the month in which the company’s <strong>Annual</strong> General Meeting<br />
takes place. The members of the DB <strong>AG</strong> Management Board will<br />
receive the following compensation for their duties during the<br />
year under review:
| CORPORATE GOVERNANCE REPORT 33<br />
Total compensation of the<br />
<strong>Annual</strong> income for <strong>2010</strong><br />
Management Board [ € thousand ]<br />
Fixed<br />
Variable<br />
Variable<br />
Benefits in<br />
Other 3)<br />
Total<br />
compensation<br />
compensation<br />
compensation<br />
connection with<br />
short-term 1)<br />
long-term 2)<br />
premature<br />
termination of<br />
duties<br />
ACTIVE MAN<strong>AG</strong>EMENT BOARD<br />
MEMBERS ON DECEMBER 31, <strong>2010</strong><br />
Dr. Rüdiger Grube 900 1,850 165 – 31 2,946<br />
Gerd Becht 650 1,150 105 – 23 1,928<br />
Dr. Volker Kefer 400 820 75 – 27 1,322<br />
Dr. Richard Lutz (since April 1, <strong>2010</strong>) 300 595 56 – 19 970<br />
Ulrich Weber 650 1,160 105 – 9 1,924<br />
MAN<strong>AG</strong>EMENT BOARD MEMBERS WHO<br />
LEFT DURING THE YEAR UNDER REVIEW<br />
Stefan Garber (up to March 31, <strong>2010</strong>) 138 – – 1,850 7 1,995<br />
Diethelm Sack (up to March 31, <strong>2010</strong>) 163 – – 213 4) 5 381<br />
TOTAL 3,201 5,575 506 1,850 121 11,466<br />
1)<br />
Pending decision by the Supervisory Board.<br />
2)<br />
Long-term variable compensation refers to the pension provisions for long-term incentives.<br />
3)<br />
Non-cash benefits accruing from travel benefits and usage of company cars as well as insurance and housing allowances.<br />
4)<br />
Mr. Sack received a prorated director’s fee for <strong>2010</strong> at the end of his Management Board contract.<br />
As compensation for the premature termination of his duties,<br />
Mr. Stefan Garber received a one-time severance payment of<br />
€ 1,850 thousand. Starting on April 1, <strong>2010</strong>, he will receive a<br />
company pension of € 550 thousand. Furthermore, should Mr.<br />
Garber receive income from independent or non-independent<br />
employment during the time between his departure from DB <strong>AG</strong><br />
and his 63rd birthday, the resulting income – if it exceeds<br />
€ 330 thousand annually – will be offset against his pension<br />
during this time. Mr. Diethelm Sack, who also stepped down<br />
from the Management Board in <strong>2010</strong>, did not receive any severance<br />
compensation. He concluded a consulting contract with<br />
DB <strong>AG</strong> lasting through December 31, 2011. With regard to the<br />
provisions made for pensions of departing members of the<br />
Management Board, only the payments agreed upon in the<br />
Management Board contract were granted.<br />
The existing D&O insurance policy will provide insurance coverage<br />
for a period of five years after the end of Management<br />
Board duties.<br />
No member of the Management Board received any benefits<br />
or promises of benefits from third parties related to his<br />
activities as a member of the Management Board during the<br />
year under review.
34<br />
| DEUTSCHE BAHN GROUP<br />
PENSION BENEFITS OF THE MAN<strong>AG</strong>EMENT BOARD<br />
IN THE <strong>2010</strong> FINANCIAL YEAR<br />
During the year under review, an amount totaling € 2,896<br />
thousand was added to the pension provisions.<br />
Addition to the pension provisions (service cost) 1)<br />
[ € thousand ]<br />
ACTIVE MAN<strong>AG</strong>EMENT BOARD MEMBERS<br />
ON DECEMBER 31, <strong>2010</strong><br />
<strong>2010</strong><br />
Dr. Rüdiger Grube 961<br />
Gerd Becht 761<br />
Dr. Volker Kefer 193<br />
Dr. Richard Lutz 2) (since April 1, <strong>2010</strong>) 36<br />
Ulrich Weber 899<br />
MAN<strong>AG</strong>EMENT BOARD MEMBERS WHO LEFT<br />
DURING THE YEAR UNDER REVIEW<br />
Stefan Garber (up to March 31, <strong>2010</strong>) 46<br />
Diethelm Sack 3) (up to March 31, <strong>2010</strong>) –<br />
TOTAL 2,896<br />
1)<br />
The service cost for Management Board members appointed during the<br />
year under review is based on estimated values; for part-time members of<br />
the Management Board, the amount is prorated.<br />
2)<br />
For new Management Board appointments from within the Group, the<br />
service cost for prior acceptances is not taken into account.<br />
3)<br />
Already funded.<br />
Provisions made for pensions of previous members of the Management<br />
Board are shown in total in the notes to the Group<br />
consolidated statements.<br />
Compensation of the Supervisory Board<br />
for the <strong>2010</strong> financial year<br />
Compensation of the Supervisory Board was most recently<br />
regulated by the <strong>Annual</strong> General Meeting decision on September<br />
21, <strong>2010</strong>. In addition to being reimbursed for their cash<br />
outlays and the value-added tax due on their compensation and<br />
cash outlays, the members of the Supervisory Board receive<br />
fixed annual compensation of € 20,000, as well as performancelinked<br />
annual compensation. The performance-linked compensation<br />
varies depending on the relationship between the<br />
operational results (EBIT) shown in the Group’s annual financial<br />
statements for the financial year and the comparable previous<br />
year’s figures, as well as attaining specific operational performance<br />
figures. The performance-linked compensation is limited<br />
to a maximum of € 13,000.<br />
The Chairman of the Supervisory Board receives compensation<br />
equal to twice the above figure, while his deputy receives compensation<br />
equal to one and a half times the above figure. Furthermore,<br />
compensation received by each member of the<br />
Supervisory Board increases by 25 % for being a member of a<br />
committee. The compensation increases by 100 % for being the<br />
chairman of the Executive Committee or the Audit and Compliance<br />
Committee, and by 50 % for being the chairman of the<br />
Personnel Committee. Membership and chairmanship of the<br />
committee to be formed in accordance with Article 27 Para. 3 of<br />
the MitbestG (Federal Codetermination Act) are not taken into<br />
consideration.<br />
In addition, the members of the Supervisory Board receive<br />
an attendance fee of € 250 for each meeting of the Supervisory<br />
Board or Supervisory Board committee they attend. In addition,<br />
Supervisory Board members also have the choice of receiving<br />
either a personal <strong>Bahn</strong>Card 100 First or five free train tickets.<br />
The members of the Supervisory Board are covered by<br />
financial loss liability insurance (D&O insurance) for risks associated<br />
with working for DB <strong>AG</strong>. This insurance is designed as a<br />
group insurance policy without a deductible and provides coverage<br />
for financial losses that may occur during the performance<br />
of Supervisory Board activities. In addition, a group accident<br />
insurance policy exists for members of the Supervisory Board.<br />
The company pays the premiums for these policies.<br />
Members of the Supervisory Board who were not members<br />
of the Supervisory Board for a full financial year receive onetwelfth<br />
of their compensation for every month or part of a month<br />
that they were members. The rule applies correspondingly to<br />
the increases in compensation for the Chairman of the Supervisory<br />
Board as well as his deputy, and to increased compensation<br />
for membership and chairmanship of a Supervisory Board<br />
committee.<br />
Payment of compensation takes place after the conclusion<br />
of the <strong>Annual</strong> General Meeting that voted to approve the Supervisory<br />
Board’s activities in the previous financial year.<br />
Taxes due on compensation received, including the personal<br />
<strong>Bahn</strong>Card 100 First or the five free train tickets, are the individual<br />
responsibility of each member of the Supervisory Board.<br />
Members of the Supervisory Board currently do not hold<br />
shares in the company, nor do they hold options that entitle<br />
them to purchase shares in the company.<br />
Subject to the approval of the activities of the Supervisory<br />
Board by the <strong>Annual</strong> General Meeting on April 5, 2011, the members<br />
of the Supervisory Board will receive the following compensation<br />
for their activities during the year under review:
03 GROUP<br />
INFORMATION<br />
FINANCIAL COMMUNICATION 38<br />
INVESTOR RELATIONS 38<br />
BOND ISSUES 38<br />
VALUE MAN<strong>AG</strong>EMENT 39<br />
RATING 39<br />
COMPLIANCE REPORT 40<br />
COMPLIANCE – UNDERSTANDING AND PRINCIPLES 40<br />
GREATER VALUE PLACED ON PRIVACY 41
DEUTSCHE BAHN CELEBRATES 175 YEARS<br />
OF RAILWAYS IN GERMANY 42<br />
ANNUAL REVIEW <strong>2010</strong> 44<br />
GROUP PROFILE 48<br />
GROUP GOVERNANCE 48<br />
OUR MARKETS 48<br />
OUR BUSINESS UNITS 50
38<br />
| DEUTSCHE BAHN GROUP<br />
Financial communication<br />
a Investor relations further intensified<br />
a Five bonds in three currencies issued<br />
a Ratings once again reconfirmed in year under review<br />
INVESTOR RELATIONS<br />
One of the major objectives of our investor relations work is to<br />
establish and maintain sustainable communications with investors,<br />
analysts and rating agencies. We therefore provide regular,<br />
comprehensive and prompt information regarding our financial<br />
activities and the development of DB Group.<br />
We notably intensified our investor relations activities<br />
during the year under review. During the course of events and<br />
one-on-one talks in Europe (Germany, France, Switzerland,<br />
Great Britain, the Netherlands and Italy) and Asia (Tokyo,<br />
Singapore, Hong Kong and Beijing) we engaged in active discussions<br />
with existing and potential new investors. In doing so we<br />
laid the foundation for the successful bond issues we floated<br />
during the year under review.<br />
After three euro-denominated bonds were issued in the<br />
previous year, we successfully accompanied the issuance of five<br />
bonds in <strong>2010</strong>: three euro bonds, one bond denominated in<br />
Japanese yen and another in Swiss francs. All of the bonds were<br />
greeted with great interest by international investors, with<br />
regional emphasis on investors in Germany, France, Switzerland<br />
and Japan.<br />
A further focal point during the year under review was the<br />
maintenance and further expansion of our A IR Web site [1].<br />
We publish all of our annual and interim reports in the Internet.<br />
Furthermore, the investor relations site also contains comprehensive<br />
information about DB Group, corporate presentations,<br />
answers to frequently asked questions, as well as extensive<br />
information about our capital market activities and our ratings.<br />
Moreover, a special newsletter allows subscribers to automatically<br />
receive the latest information via e-mail.<br />
If you wish to contact us, you can find all the needed information<br />
in the rear cover of this report or on our A IR Web site [1].<br />
BOND ISSUES<br />
ISIN Issuer Currency Volume (million) Coupon Maturity Term in years<br />
XS0515937406<br />
XS0524471355<br />
XS0549869989<br />
XS0554975325<br />
CH0120096398<br />
<strong>Deutsche</strong> <strong>Bahn</strong><br />
Finance B.V. EUR 500 3.500 June 2020 10<br />
<strong>Deutsche</strong> <strong>Bahn</strong><br />
Finance B.V. EUR 500 3.750 July 2025 15<br />
<strong>Deutsche</strong> <strong>Bahn</strong><br />
Finance B.V. JPY 47,100 1.130 October 2020 10<br />
<strong>Deutsche</strong> <strong>Bahn</strong><br />
Finance B.V. EUR 500 3.375 November 2022 12<br />
<strong>Deutsche</strong> <strong>Bahn</strong><br />
Finance B.V. CHF 750 1.750 June 2020 9.5<br />
During the year under review we tapped the capital market via<br />
our financing subsidiary <strong>Deutsche</strong> <strong>Bahn</strong> Finance B.V. (DB Finance),<br />
Amsterdam/the Netherlands for a total of € 1,500 million through<br />
the issuance of three benchmark Eurobonds; a benchmark bond<br />
denominated in Japanese yen with a volume of JPY 47,100 million<br />
and one benchmark bond denominated in Swiss francs for<br />
CHF 750 million. The main purpose of the bonds was to refinance<br />
one maturing bond with a total volume of € 1,000 million and<br />
to partially finance the amount paid to acquire Arriva.<br />
BOND ISSUES [ € billion ]<br />
<strong>2010</strong> 2.5<br />
2009 2.2<br />
2008 0.0<br />
| [1] A www.db.de/ir-e
| GROUP INFORMATION<br />
| Financial communication<br />
39<br />
The year under review was marked by a further improvement of<br />
overall global economic conditions, which generally supported<br />
the bond markets and provided particular support to DB Group.<br />
We floated euro denominated bond issues in June, July and<br />
October <strong>2010</strong> with terms of 10, 15 and 12 years, respectively.<br />
Each of these issues had a volume of € 500 million and was<br />
primarily sought after by investment funds and insurance firms<br />
located in France and Germany. During the year under review<br />
we issued two foreign currency bonds as part of our efforts to<br />
broaden our investor base: a ten-year bond for JPY 47,100 million,<br />
which met with great demand among Japanese investors, and a<br />
bond denominated in Swiss francs (CHF), which was also greeted<br />
with great interest. Following a first tranche of CHF 400 million<br />
issued in November, we went on to successfully float a second<br />
tranche for CHF 350 million. Both tranches have a term of nine<br />
and a half years and were mainly purchased by institutional<br />
investors. We entered into interest rate/currency swaps with<br />
correspondingly identical expiration dates to avoid risks arising<br />
from currency exchange rates.<br />
VALUE MAN<strong>AG</strong>EMENT<br />
Value management key figures [%] <strong>2010</strong> <strong>2010</strong><br />
2009 Target<br />
excl. DB Arriva<br />
Return on capital employed (ROCE) 6.0 6.4 5.9 10<br />
Redemption coverage 18.1 21.2 19.4 30<br />
Gearing 118 98 115 100<br />
Net financial debt /EBITDA (no unit) 3.6 3.1 3.4 2.5<br />
The objective of our financial management system is to expand<br />
our corporate value on a sustainable basis. Further information<br />
on A value management [1] can be found in the Group management<br />
report.<br />
We use the ROCE parameter (return on capital employed)<br />
as the key metric to reflect the development of our Group portfolio<br />
and for investment allocation. We use a figure of 9.6 %<br />
before taxes as our cost of capital based on a mid-term target<br />
capital structure.<br />
Additional key figures used in our value management<br />
system for controlling the level of debt are redemption coverage,<br />
gearing and net financial debt /EBITDA.<br />
RATING<br />
Ratings DB <strong>AG</strong> First issued Last<br />
Current ratings<br />
confirmation<br />
Short-term Long-term Outlook<br />
Moodyʼs May 16, 2000 November 26, <strong>2010</strong> P-1 Aa1 stable<br />
Standard & Poorʼs May 16, 2000 February 17, 2011 A-1+ AA stable<br />
Fitch February 17, 2009 May 13, <strong>2010</strong> F1+ AA stable<br />
During the year under review we were again in continual contact<br />
with the rating agencies’ analysts. The acquisition of A Arriva [2]<br />
played a major role in our discussions with the rating agencies.<br />
Directly after DB <strong>AG</strong> announced its intention to acquire Arriva,<br />
Moody’s and Standard&Poor’s (S &P) reconfirmed their ratings.<br />
Fitch also reconfirmed its good credit rating for DB <strong>AG</strong> during<br />
the year under review.<br />
The ratings issued by all three rating agencies have remained<br />
unchanged since they were first issued (Moody’s and S &P: in<br />
2000; Fitch: in 2009). The outlook for our three ratings is “stable.”<br />
We therefore now have three, unchanged, good ratings<br />
issued by three independent international rating agencies.<br />
The A rating agencies’ publications [3] regarding DB <strong>AG</strong><br />
may be found on our IR Web site.<br />
| [1] A Page 78 ff.<br />
| [2] A Page 60<br />
| [3] A www.db.de/rating-e
40<br />
| DEUTSCHE BAHN GROUP<br />
Compliance report<br />
a Decentral units added to compliance organization<br />
a Systematic compliance-risk management introduced<br />
a Group cornerstone agreement reached on protection of employee privacy<br />
COMPLIANCE – UNDERSTANDING AND PRINCIPLES<br />
Compliance is an integral part of DB Group’s corporate and<br />
management culture. We understand compliance to mean that<br />
all of our business activities fully comply with applicable laws<br />
and internal rules.<br />
We already defined these principles last year in a A Code<br />
of Conduct [1] that is binding for all employees, executives,<br />
managing directors and members of the Management Board.<br />
The purpose of the Code is to ensure that our dealings with<br />
customers, business associates, competitors, employees and<br />
the owner are based on integrity and fair and legal behavior.<br />
The Code of Conduct also reflects the significantly expanded<br />
understanding of what compliance means. While the main<br />
emphasis of compliance activities in the past was on investigating<br />
and prosecuting white-collar criminality, today’s understanding<br />
of compliance is broader and has a preventive focus.<br />
Redefined compliance organization<br />
During the course of the year under review our central compliance<br />
organization was almost completely restructured and will<br />
be further expanded by the addition of decentral units. The<br />
purpose of this was to ensure that compliance is firmly anchored<br />
where business actually takes place and responsibilities are<br />
located. The new regional contact persons will be able to better<br />
respond to local conditions and business-specific requirements.<br />
They will also bring a broader – and above all more individualized<br />
– focus, for example at our subsidiary companies in Germany<br />
or within the framework of consulting projects abroad. This<br />
move sets the signals for modern, globally oriented compliancerisk<br />
management. In addition to implementing the organizational<br />
and personnel changes, the major tasks handled during the year<br />
under review included the completion of an analysis examining<br />
weak areas for compliance, the structure of the whistle-blower<br />
management system, the continual further development of the<br />
training concept, as well as the introduction of a compliance-risk<br />
management system based on a systematic risk analysis.<br />
Introduction of compliance-risk analysis<br />
During the year under review we developed and installed a<br />
systematic compliance-risk analysis. Within the framework of a<br />
precisely targeted analysis of our compliance risks, all business<br />
units and selected companies across the Group were evaluated<br />
and classified. In addition to the fundamental business activities,<br />
the analysis covered basic issues related to corporate culture,<br />
A corporate governance [2] and very specific subjects such<br />
as corruption, property offenses, anti-trust law, environmental<br />
protection and privacy. The results present a comprehensive<br />
overview of risks facing the business units and certain subsidiary<br />
companies. Commensurate countermeasures were agreed on at<br />
the end of this process for the purpose of hindering or stopping<br />
white-collar crime, conflicts of interest and unfair competitive<br />
practices, among other issues.<br />
Compliance training expanded<br />
Within the framework of our prevention work we developed a<br />
comprehensive awareness-raising and training program for our<br />
employees in Germany and abroad. We use face-to-face events,<br />
workshops and numerous E-Learning modules to teach participants<br />
key legal requirements and internal guidelines in a practiceoriented<br />
manner. This is how we are anchoring our Group-wide<br />
standards of business behavior.<br />
Advisory services offered by the Compliance Help Desk<br />
team to employees and executives also provides them with<br />
greater certainty for handling various situations within the Group.<br />
During the year under review the Help Desk team received<br />
inquiries concerning a wide range of compliance-related issues<br />
from all Group areas.<br />
Focus on compliance with anti-trust law<br />
A separate unit staffed with specialized lawyers has been established<br />
for handling compliance issues related to anti-trust laws.<br />
This unit serves the entire Group. An updated guideline defining<br />
correct behavior vis-a-vis competitors was published in 22 languages<br />
during the year under review and sets uniform standards<br />
across the Group. Moreover, separate guidelines describe the<br />
special requirements involved in abiding with the provisions of<br />
anti-trust law in the various markets and business areas where<br />
we are active.<br />
| [1] A www.db.de/coc<br />
| [2] A Page 28 ff.
| GROUP INFORMATION<br />
| Compliance report<br />
41<br />
Executives and employees are made aware of anti-trust law issues<br />
and trained as part of Group-wide face-to-face training sessions.<br />
The training sessions are customized to meet the exact needs of<br />
the individual business unit where the training is being held.<br />
Our anti-trust lawyers trained about 3,500 employees in<br />
anti-trust law in 40 countries between 2008 and <strong>2010</strong>. As of the<br />
year under review the face-to-face training sessions have been<br />
expanded to cover the business units in the Passenger Transport<br />
division. In view of the advances made in liberalizing the markets,<br />
anti-trust law considerations also play an important role in<br />
international activities.<br />
Furthermore, more than 20,000 employees participated in<br />
an E-Learning program during the year under review. These<br />
Internet-based programs present the major rules of anti-trust<br />
law as it applies to specific business units.<br />
Our experts for anti-trust law compliance continuously<br />
advise employees from all Group companies regarding concrete<br />
issues related to anti-trust law, like developing cooperating<br />
agreements or formulating commercial conditions. Our compliance<br />
teams conduct risk analyses in Group companies whose<br />
business practices are likely to be impacted by anti-trust law.<br />
They also analyze the competitive situation in various markets<br />
for potential conflicts with anti-trust law. This way we can take<br />
effective action to counter possible weaknesses at an early stage.<br />
GREATER VALUE PLACED ON PRIVACY<br />
Another core element of our compliance work is the exemplary<br />
anchoring of privacy across the Group. This was significantly<br />
upgraded and newly positioned as a customer and employeeoriented<br />
quality feature. We established a fundamentally new<br />
privacy organization structure in the previous year, which has<br />
resulted in a growing sensitivity in the handling of person-related<br />
data and observing the related legal requirements.<br />
A new Group Privacy Officer (GPO) was appointed in May<br />
<strong>2010</strong>, who is responsible for privacy matters within the Group<br />
and reports directly to the Management Board. However, pursuant<br />
to the terms of the Privacy Act, the GPO acts autonomously.<br />
Employee privacy issues and customer privacy issues are handled<br />
by two separate departments which were especially established<br />
for these purposes. In the future the central privacy organization<br />
will be supported nationally by specialist personnel and authorized<br />
privacy organization representatives. Their task is to ensure<br />
the effective implementation of privacy rules in the individual<br />
operational and organizational units.<br />
Group works council agreement reached<br />
on employee privacy<br />
In addition to the updated organization and structure of the<br />
privacy section we also made a fundamental change in the way<br />
employee data is handled within the Group. Following intensive<br />
negotiations, representatives of the employee and employer<br />
sides signed a cornerstone paper on employee privacy on<br />
November 24, <strong>2010</strong>. This paper defines the various aspects needed<br />
to ensure that the privacy rights of employees are observed and<br />
also establishes the foundation for a fair and transparent Group<br />
privacy protection policy. This agreement represents a new start<br />
in view of the events that took place in 2009. It should contribute<br />
to restoring the trust of our employees, executives, business<br />
associates and customers.<br />
Regular and broad-based privacy audits will ensure that<br />
quality is being maintained in this area as they will check if the<br />
privacy rules are being observed across the Group. The resulting<br />
findings will also be made available to the representatives of<br />
interest groups in the future. Due to the regulating cycle of<br />
agreed measures and checks, privacy audits contribute towards<br />
ensuring the effectiveness of the measures and to a sustained<br />
improvement of the privacy level within Group companies.<br />
Privacy advisory board established<br />
The work of the Group privacy organization was complemented<br />
in May <strong>2010</strong> by the establishment of a privacy advisory board.<br />
The independent advisory body supports the Management Board<br />
in the area of privacy questions. The advisory board acts au -<br />
tonomously and consists of twelve members. Mr. Klaus-Dieter<br />
Hommel, Deputy Chairman, of the Railway and Transport Workers<br />
Union (EVG) will chair the advisory board. The privacy advisory<br />
board meets four times a year. Its members consist of employee<br />
representatives as well as privacy experts from the worlds of<br />
science, associations and business.
42<br />
| DEUTSCHE BAHN GROUP<br />
<strong>Deutsche</strong> <strong>Bahn</strong> celebrates 175 years<br />
of railways in Germany<br />
a <strong>Deutsche</strong> <strong>Bahn</strong> part of the tradition associated with 175 years of railways in Germany<br />
a This tradition also represents a commitment to the future for us<br />
a This is why we celebrated the anniversary with numerous highlights during <strong>2010</strong><br />
a Hundreds of thousands of people attended our numerous anniversary events<br />
KICK-OFF EVENT<br />
Railway history in Germany began 175<br />
years ago when the first steam-driven<br />
locomotive (the “Adler” or eagle) ran from<br />
Nuremberg to Fürth on December 7, 1835.<br />
Today, 175 years later, Germany has the<br />
densest railway network and the most<br />
extensive train service in the world.<br />
Dr. Rüdiger Grube, CEO and Chairman of<br />
the Management Board of DB <strong>AG</strong>: “Railways<br />
have always brought people together<br />
and thrilled them. They contributed to -<br />
ward the exchange of ideas and the rapid<br />
spread of progress. Today, we look back<br />
IT BEGAN WITH THE “ADLER”<br />
The locomotive from England, the train<br />
driver from England – the first run of a<br />
train on a German stretch of track was<br />
already a harbinger of the international<br />
ICE AS A ROLLING AMBASSADOR<br />
An ICE train served as a rolling ambassador<br />
for the “175 years of railways in Germany”<br />
celebrations across the nation. Covered<br />
with special anniversary artwork, the train<br />
was sent on its journey on March 4, <strong>2010</strong> in<br />
the historical Kaiserbahnhof (Emperor’s<br />
on a fascinating history, without omitting<br />
its darker pages. However, we are looking<br />
ahead: to the opportunities and challenges<br />
facing the integrated rail system in view<br />
of climate change and growing flows of<br />
traffic.”<br />
character that is increasingly indicative of<br />
rail transport today. The run of the Adler<br />
on December 7, 1835 from Nuremberg<br />
to Fürth at a speed of 35 km/h and 200<br />
passengers made the Franconian city the<br />
birthplace of the railway in Germany.<br />
Station) in Potsdam by Enak Ferlemann,<br />
Parliamentary State Secretary in the Federal<br />
Ministry of Transport, and DB CEO,<br />
Dr. Rüdiger Grube. Numerous guests from<br />
the worlds of politics and business<br />
atten ded the naming ceremony along<br />
with the Mayors of Nuremberg and Fürth,<br />
Dr. Ulrich Maly and Dr. Thomas Jung. The<br />
ICE spent the entire anniversary year<br />
traveling throughout Germany.
| GROUP INFORMATION<br />
| 175 years of railways in Germany<br />
43<br />
SPECIAL EXHIBIT IN<br />
DB MUSEUM NUREMBERG<br />
The railway museum (today: DB Museum)<br />
has been located in Nuremberg since<br />
1899. The museum was rebuilt in recent<br />
years and has permanent exhibits covering<br />
the his tory of the German railway<br />
from its begin nings through to the fall of<br />
the Berlin Wall.<br />
DB ANNIVERSARY TOUR<br />
As part of our DB Anniversary Tour, 15<br />
train station festivals took place between<br />
June and November <strong>2010</strong> in all German<br />
Federal states, offering live music, prize<br />
contests and information booths, and<br />
made the anniversary year known<br />
throughout Germany. Always on an entire<br />
Sunday this meant “Celebrate and win<br />
with us.”<br />
TICKET OFFERS<br />
We offered some very special price offers<br />
to our customers as part of the 175th anniversary<br />
of the railway in Germany celebrations.<br />
During the anniversary year our<br />
customers could join us in celebrating and<br />
travel throughout Germany with lowpriced<br />
tickets.<br />
About 200,000 visitors from around the<br />
world were attracted to its special railway<br />
anniversary exhibit in <strong>2010</strong>. Between July 7,<br />
<strong>2010</strong> and February 27, 2011 the special<br />
“Planet Railway” exhibit presented key<br />
historical and current railway subjects<br />
arranged in ten stages with productions<br />
and unique content.<br />
The DB Anniversary Tour offered a colorful<br />
program for the entire family.<br />
Attractive prizes were waiting for the<br />
visitors, including an Ameropa city vacation<br />
and a Mobility <strong>Bahn</strong>Card 100 at the<br />
end of the tour. Visitors received insights<br />
into the past, present and future of the<br />
railway. Information columns displayed<br />
news about DB’s employees, current<br />
mobility offers and climate protection.<br />
These offers included the Anniversary<br />
Ticket and two Anniversary Passes valid<br />
for either 175 hours or one month, with<br />
which 150,000 customers traveled during<br />
the anniversary year. The passes were<br />
valid from June 13 through August 31,<br />
<strong>2010</strong> and additionally on December 7, <strong>2010</strong>,<br />
the birthday of the railway in Germany.<br />
Holders of these passes could also visit<br />
the DB Museum in Nuremberg for free.<br />
ANNIVERSARY YEAR ENDS: A GRAND FINALE<br />
A grand finale ceremony on December 7, <strong>2010</strong> at the DB Mu -<br />
se um marked the end of the anniversary year celebrations.<br />
Exactly 175 years after the first journey of the “Adler” from<br />
Nuremberg to Fürth German Chancellor Dr. Angela Merkel<br />
gave the ceremonial address in front of numerous guests<br />
from industry, politics, culture and media. During the event<br />
our guests were able to look back at the success story of the<br />
railway and also catch a glimpse of the future of a mode of<br />
transport that is, like no other, positioned to solve the<br />
increasing mobility challenges.
44<br />
| DEUTSCHE BAHN GROUP<br />
<strong>Annual</strong> review <strong>2010</strong><br />
JANUARY<br />
FEBRUARY<br />
MARCH<br />
Opening of the RUHR.<strong>2010</strong> European<br />
Capital of Culture, for which we are one<br />
of the main sponsors.<br />
We conclude an agreement with Alstom<br />
to exchange all wheelsets in the ICE T fleet.<br />
A Page 83<br />
DB Group becomes a national sponsor<br />
of the FIFA Women’s World Cup 2011 in<br />
Germany.<br />
DB CEO Dr. Rüdiger Grube, Minister of<br />
Transport Peter Ramsauer and NRW Minister<br />
President Jürgen Rüttgers open the<br />
newly renovated Essen Central Station,<br />
a € 57 million project. The station served<br />
as an attractive entrance portal for<br />
RUHR.<strong>2010</strong>.<br />
DB Schenker operates air-freight transport<br />
of relief materials for the organization<br />
“Luftfahrt ohne Grenzen” (“Wings<br />
of Help”), to people in the earthquake<br />
catastrophe region in Haiti.<br />
We conclude a long-term electricity supply<br />
contract for electrical energy from the<br />
Märkisch-Linden wind farm.<br />
The various construction companies in DB<br />
Group are combined into DB <strong>Bahn</strong>bau<br />
Gruppe GmbH. This will allow our rail<br />
infrastructure services to be offered from<br />
a single source in the future.<br />
DB Schenker Rail establishes the Xrail<br />
alliance with six European freight rail<br />
companies in order to make the quality<br />
of trans-border single-wagon transport<br />
more reliable and customer-oriented.<br />
A Page 89<br />
We order 48 electrical trainsets for re gio nal<br />
transport in Berlin and Brandenburg at a<br />
cost of € 200 million.<br />
DB Schenker Logistics opens its first center<br />
for information technology in Nanjing,<br />
China in order to combine IT functions for<br />
the Asian-Pacific DB Schenker organization.<br />
We invest € 1.5 million in the 1,400-squaremeter<br />
center.<br />
We hold a ceremony in Potsdam celebrating<br />
the start of the “175 years of railways<br />
in Germany” anniversary year.<br />
A Page 42 f.<br />
Professor Dr. Dr. Utz-Hellmuth Felcht<br />
becomes the new Supervisory Board<br />
Chairman of DB <strong>AG</strong>.<br />
DB <strong>Bahn</strong> Urban and MAN Nutzfahr zeuge<br />
(commercial vehicles) sign a master agreement<br />
for 600 buses worth more than<br />
€ 150 million.<br />
DB <strong>Bahn</strong> Regional is awarded the contract<br />
to operate the Dresden S-<strong>Bahn</strong> (metro)<br />
starting in December <strong>2010</strong>. The contract<br />
has a volume of 3.1 million train-kilometers<br />
annually and a term of 17 years.<br />
A Page 82<br />
The Dresden S-<strong>Bahn</strong> (metro) will continue<br />
to be operated by DB <strong>Bahn</strong> Regional.<br />
The new Essen Central Station<br />
is ceremonially reopened.<br />
DB Schenker Rail is a member of Xrail, an alliance<br />
between six European freight rail companies.
| GROUP INFORMATION<br />
| <strong>Annual</strong> review<br />
45<br />
APRIL<br />
MAY<br />
JUNE<br />
Our long-distance trains transport up to<br />
30 % more passengers as the ash cloud<br />
restricts air travel. All available trains are<br />
in use, and additional employees are available<br />
at the stations to assist passengers.<br />
With the train schedule change, DB Regio<br />
Tyne&Wear in the UK inaugurates operation<br />
of the metro network in Newcastle,<br />
Sunderland and the surrounding areas.<br />
A Page 83<br />
Together with SJ, the Swedish national<br />
railway, DB Regio Sverige wins the tender<br />
for operating regional transport lines in<br />
the northern part of Sweden.<br />
A Page 82<br />
In Bergheim near Salzburg, Austria, the<br />
most modern freight forwarding terminal<br />
in DB Schenker’s European land transport<br />
network – with an investment volume of<br />
approximately € 26 million – starts its<br />
operations.<br />
As part of the anniversary year celebrating<br />
175 years of railways in Germany, we create<br />
three offers for our customers: the Anniversary<br />
Ticket and two Anniversary Passes<br />
which allow rail passengers to travel nationwide<br />
for a low price.<br />
DB Schenker Rail Bulgaria begins operations<br />
in Pirdop, Bulgaria. This expansion<br />
means that the DB Schenker Rail network<br />
is now present with its own national company<br />
in the growth region of Southeastern<br />
Europe.<br />
The new DB Schenker logistics terminal<br />
near the Bulgarian capital of Sofia starts<br />
operations. The terminal – one of the<br />
country’s most modern freight transport<br />
hubs – was built in Bozhurishte, 20 minutes<br />
outside the gates of Sofia, with an<br />
investment volume of € 10 million.<br />
The DB anniversary tour begins in Kiel,<br />
celebrating the rail anniversary at 15<br />
stations nationwide. A Page 42 f.<br />
DB Schenker Rail regularly offers a continuous<br />
container train, the “Moscovite,”<br />
from Duisburg to the Russian capital of<br />
Moscow. Travel time for the approximately<br />
2,200 km route is seven days.<br />
Paperless rail travel becomes an option –<br />
instead of presenting printed online<br />
tickets, travelers can show the conductor<br />
a picture-message confirmation on their<br />
cell phones.<br />
By the spring of 2011, DB Schenker rail will<br />
transport approximately 12,500 t of prefabricated<br />
concrete walls for multiple apartment<br />
complexes from Neubrandenburg to<br />
Sweden. DB Schenker Rail sends the first<br />
eight of more than 400 special containers<br />
in total to Scandinavia via rail.<br />
We offer three anniversary tickets to comme morate<br />
“175 years of railways in Germany.” Paperless travel with mobile tickets – the travel<br />
ticket is sent to your cell phone.<br />
DB Schenker’s newly opened freight forwarding<br />
terminal in Bergheim, Austria.
46<br />
| DEUTSCHE BAHN GROUP<br />
JULY<br />
AUGUST<br />
SEPTEMBER<br />
The special exhibition “Planet Railway”<br />
opens at the DB Museum in Nuremberg,<br />
presen ting a global perspective on trains<br />
from their beginnings and into the future.<br />
A Page 42 f.<br />
We invest approximately € 120 million to<br />
electrify the 73 km section from Reichenbach<br />
to Hof on the Dresden–Chemnitz–<br />
Hof–Nuremberg “Saxony-Franconia route.”<br />
DB <strong>Bahn</strong> Regional wins three tenders for<br />
local rail passenger transport: the Warnow<br />
network, the Werdenfels network in<br />
Bava ria, and the tender to operate the<br />
Hanover S-<strong>Bahn</strong> (metro). A Page 82<br />
DB Carsharing, our rental-car system, offers<br />
environmentally friendly electric cars for<br />
rail customers and the general public at<br />
Frankfurt central station. This allows for<br />
carbon-neutral mobility when transferring<br />
between rail and automobile transport.<br />
DB Schenker takes over another 20,000<br />
square meters of logistics space at the<br />
Industrie park Bremen. The hall is completely<br />
reno vated and upgraded.<br />
The vehicle show “Adler, Rocket&Co.”<br />
opens at the DB Museum Nuremberg, displaying<br />
nine groundbreaking locomotives<br />
from six European countries.<br />
The European Commission grants conditional<br />
approval for our purchase of British<br />
passenger transport company Arriva. With<br />
Arriva, we significantly expand our position<br />
in the European regional transport<br />
market. A Page 60<br />
Audi transports complete vehicles via<br />
carbon-neutral transport between Ingolstadt<br />
and Emden, using DB Schenker Rail’s<br />
Eco-Plus offer. A Page 115<br />
We expand our bonus program and introduce<br />
the free “bahn.bonus Card” customer<br />
card. This gives all rail passengers<br />
the opportunity to collect bahn.bonus<br />
points when they buy tickets. The card<br />
can be ordered online at www.bahn.de/<br />
bahnbonuscard.<br />
We launch our Customer and Quality Initiative<br />
and plan to make additional investments<br />
in quality and service over the next<br />
five years to increase reliability, improve<br />
comfort and service along the entire travel<br />
chain, and ensure sufficient customer<br />
information and good service in unusual<br />
situations. A Page 105<br />
Rail infrastructure operators DB Netz <strong>AG</strong><br />
and Réseau Ferré de France (RFF) agree<br />
to collaborate more closely in the areas<br />
of scheduling, environment and infrastructure<br />
improvements.<br />
Allianz Pro Schiene names Darmstadt<br />
the “Metropolitan station of the year.”<br />
Baden-Baden is given top scores for customer<br />
friendliness, making it the station<br />
of the year in the small-town station<br />
category.<br />
With just under 56,000 train-path applications,<br />
DB Netz <strong>AG</strong> sets a record for rail<br />
transport orders in the 2011 network<br />
schedule.<br />
The special exhibition “Planet Railway” at the<br />
DB Museum presents a history of railways.<br />
The awards ceremony for the winner of the<br />
“Small-town station of the year”: Baden-Baden.<br />
The Rocket locomotive from the “Adler,<br />
Rocket&Co.” vehicle exhibition.
| GROUP INFORMATION<br />
| <strong>Annual</strong> review<br />
47<br />
OCTOBER<br />
NOVEMBER<br />
DECEMBER<br />
We take an ICE train through the Eurotunnel<br />
to London for the first time and<br />
introduce the ICE 3 at London’s St. Pancras<br />
International station. We had previously<br />
conducted a successful test run in the<br />
Eurotunnel.<br />
The completely remodeled Alte Mainzer<br />
tunnels are reactivated after about four<br />
years of construction. Their cross-sections<br />
were expanded and they received a new<br />
reinforced-concrete shell.<br />
The “DB Navigator” iPhone application<br />
passes the 1-million download mark, further<br />
expanding its leading role in the travel<br />
category for Apple iTunes downloads.<br />
The “20 years of German unity” promotio nal<br />
ticket sold to commemorate the 20th anniversary<br />
of German reunification is a great<br />
success, with more than 360,000 trips sold.<br />
DB Schenker and Kraft Foods inaugurate<br />
an ultramodern 93,000-square-meter warehouse<br />
in Groveport (Columbus, Ohio), North<br />
America.<br />
Approximately six weeks of mediation<br />
talks in Stuttgart about the Stuttgart – Ulm<br />
rail project end with a final evaluation by<br />
Dr. Heiner Geißler. A Page 121<br />
Extreme winter hits many parts of Germany<br />
in late November leading to nu merous<br />
delays and train cancellations. The<br />
maximum speed for trains is lowered to<br />
200 km/h throughout Germany in order<br />
to prevent clumps of ice on the bottom<br />
of the cars from kicking up gravel as they<br />
fall off and damaging the vehicles.<br />
We create a broader nationwide presence<br />
with our new “ServiceStore DB” concept.<br />
More ServiceStore DB locations are opened<br />
at smaller and medium-sized stations, providing<br />
rail customers and residents a single<br />
source for all their travel needs ranging<br />
from tickets to travel supplies.<br />
We start up a new data processing center<br />
in Berlin-Mahlsdorf that is one of the most<br />
modern in Europe. We invest approximately<br />
€ 24 million in the new building.<br />
We celebrate the anniversary of “175 years<br />
of railways in Germany” with German<br />
Chancellor Dr. Angela Merkel at a ceremony<br />
in Nuremberg.<br />
A French TGV and a German ICE meet on<br />
the new rail bridge between Strasbourg<br />
and Kehl – we hold a ceremony to inaugurate<br />
the new bridge over the Rhine.<br />
We order 27 double-deck trains from<br />
Bombardier Transportation. They will be<br />
used in long-distance transport starting<br />
in 2014 and will allow the IC to be used as<br />
a double-decker train on some routes.<br />
A Page 84<br />
Following the pilot phase, we put the Querdurchs-Land<br />
(Across the Country) ticket<br />
back on the market. Single passengers and<br />
up to four additional persons can use it<br />
from Monday to Friday to travel throughout<br />
Germany on regional transport trains.<br />
We take an ICE to London for the first time.<br />
More ServiceStore DB locations are opened at<br />
small and medium-sized stations.<br />
An official ceremony is held to open the rail<br />
bridge between Kehl and Strasbourg.
48<br />
| DEUTSCHE BAHN GROUP<br />
Group profile<br />
a DB Group’s governance remains unchanged<br />
a New business unit as of 2011 financial year: DB Arriva<br />
a European passenger transport market gains in importance<br />
GROUP GOVERNANCE<br />
<strong>AG</strong> has been a stock corporation established in accordance<br />
with German law since it was first founded in 1994. The business<br />
portfolio of <strong>Deutsche</strong> <strong>Bahn</strong> Group (DB Group) consists of nine<br />
business units.<br />
Following the restructuring that took place in 2008, <strong>Deutsche</strong><br />
<strong>Bahn</strong> <strong>AG</strong> (DB <strong>AG</strong>) manages the DB Netze Track, DB Netze Stations<br />
and DB Netze Energy business units directly. The remaining six<br />
business units fall under the management of our fully owned<br />
subsidiary, DB Mobility Logistics <strong>AG</strong> (DB ML<strong>AG</strong>). Within the<br />
DB Group, DB <strong>AG</strong> and DB ML<strong>AG</strong> both function as management<br />
holding companies that lead the Group. Very close cooperation<br />
between the Management Boards of DB <strong>AG</strong> and DB ML <strong>AG</strong> is<br />
ensured by the fact that the membership of both boards is almost<br />
identical and because the boards hold joint meetings. Further<br />
details may be found in the A Corporate Governance report [1].<br />
This structure enables synergies between the individual companies<br />
to be realized.<br />
The business units are responsible for the conduct of business<br />
operations. Our structure is rounded out by central group and<br />
service functions, some of which are performed by DB <strong>AG</strong> while<br />
the others are performed by DB ML <strong>AG</strong>.<br />
An A overview of the holdings [2] may be found in the<br />
Group notes.<br />
OUR MARKETS<br />
DB Group provides national and international services, whose<br />
target markets are reflected in our Group brand appearance<br />
under “Mobility – Networks – Logistics.”<br />
We are active worldwide and represented in over 130 countries.<br />
Our aim in all relevant markets is to convince customers<br />
with the quality of our services and to further improve our earnings<br />
and financial strength.<br />
Our primary goal in passenger transport is to maintain our<br />
strong market position in Germany over the long term and sustainably<br />
reinforce our position in Europe.<br />
GROUP STRUCTURE (SINCE JANUARY 1, 2011)<br />
DEUTSCHE BAHN GROUP<br />
CEO and Chairman CFO Compliance, Privacy<br />
and Legal Affairs<br />
Personnel<br />
Rail Technology<br />
and Services<br />
Infrastructure<br />
DB MOBILITY LOGISTICS SUB-GROUP<br />
BUSINESS UNITS<br />
CEO and Chairman CFO Compliance, Privacy<br />
and Legal Affairs<br />
Personnel<br />
DB Netze Track<br />
DB Netze Stations<br />
Passenger Transport<br />
Transport and Logistics<br />
Rail Technology<br />
and Services<br />
DB Netze Energy<br />
Group functions<br />
BUSINESS UNITS<br />
Service functions<br />
DB <strong>Bahn</strong> Long-Distance<br />
DB Schenker Rail<br />
DB Services<br />
DB <strong>Bahn</strong> Regional<br />
DB Schenker Logistics<br />
DB Arriva<br />
| [1] A Page 28 ff. | [2] A Page 241 ff.
| GROUP INFORMATION<br />
| Group profile<br />
49<br />
Our takeover of A Arriva [1] during the year under review is<br />
a further sign that the European markets will also become increasingly<br />
significant for us in the future.<br />
The gradual opening of European markets represents an<br />
important strategic perspective for rail: in the area of longdistance<br />
rail passenger transport, the cross-border transport<br />
market has been open since <strong>2010</strong>. This will generate additional<br />
opportunities for rail transport that we plan to realize with<br />
competitive offers either on our own or in partnership with other<br />
railways.<br />
The liberalization of the European passenger transport<br />
markets is, however, progressing at different speeds across<br />
Europe. Germany is leading the rest of Europe in the liberalization<br />
of national long-distance rail passenger transport markets.<br />
National long-distance markets in other countries have not yet<br />
been opened in many cases.<br />
Tenders for regional and urban transport contracts are<br />
increasingly being opened for bids from all of Europe and we<br />
want to increasingly benefit from this situation in the future.<br />
Since we acquired Arriva we are active in the regional bus and/<br />
or rail transport business in 12 European countries and thus have<br />
a good platform for further growth.<br />
In Germany we have assumed dual responsibility for the<br />
rail mode of transport as our integrated Group structure, making<br />
us both the operator and leading user of the rail infrastructure.<br />
We want to further develop the rail mode of transport thereby<br />
additionally strengthening the transport infrastructure, which<br />
is so important for Germany as a business location. At the same<br />
time we create the prerequisites needed to master the increasing<br />
flows of traffic in Europe.<br />
Just as we did in the passenger transport markets, we also<br />
strategically positioned ourselves early on in the transport and<br />
logistics sector to meet current and future market demands:<br />
thus DB Schenker represents our international logistical performance<br />
capabilities in clearly defined market segments. Our<br />
extensive internationally oriented service portfolio in worldwide<br />
air/ocean freight and contract logistics, as well as a dense network<br />
in European land transport, enable us to take advantage<br />
of opportunities arising in strongly growing markets. This also<br />
allows us to ensure the future of rail freight transport in Germany<br />
as we integrate our German strengths into our high-performance,<br />
international logistics networks. The bottom line here is that we<br />
maintain customer contact in all of our markets while we open<br />
up new opportunities for growth.<br />
The demand for international logistics services is rising due<br />
to the increasing internationalization and cross-border orientation<br />
of production structures and material flows in our customers’<br />
markets. We are meeting these challenges with intermodal<br />
transport chains and integrated products and sector solutions.<br />
The European rail transport market has been completely opened<br />
RELEVANT MARKETS<br />
GERMANY<br />
a Long-distance transport<br />
a Rail infrastructure<br />
EUROPE<br />
a Land transport<br />
a Rail freight transport<br />
a Cross-border rail passenger<br />
transport<br />
a Regional and urban transport<br />
WORLD<br />
a Ocean freight<br />
a Air freight<br />
a Contract logistics<br />
a Rail-bound projects<br />
| [1] A Page 60
50<br />
| DEUTSCHE BAHN GROUP<br />
active in all significant countries with our own subsidiaries or<br />
partnerships.<br />
Our know-how is also increasingly in demand for the realization<br />
of rail projects worldwide.<br />
Our DB International subsidiary participates around the<br />
world in various roles in rail projects, such as the construction<br />
of a rail-bound transport system in Qatar.<br />
OUR BUSINESS UNITS<br />
Passenger Transport<br />
Mobility services are one of the core competencies of DB Group.<br />
Our DB <strong>Bahn</strong> Long-Distance, DB <strong>Bahn</strong> Regional and DB Arriva<br />
business units focus on providing the mobility services customers<br />
want.<br />
Our Passenger Transport division offers rail and bus transport<br />
as well as other increasingly important intermodal mobility<br />
products. We are developing our transport services with an eye<br />
on our customers’s needs and transforming them into comprehensive<br />
mobility services. This applies to both national and<br />
international mobility and concurrently involves optimizing the<br />
crossover points where passengers switch from one mode of<br />
transport to another. Our aim is to intelligently link rail transport<br />
offers to other modes of transport via a smoothly functioning<br />
crossover process. Already today, the CityT<br />
icket function of the<br />
<strong>Bahn</strong>Card and the supplemental booking possibility via City<br />
mobil when buying tickets make it easy for passengers to continue<br />
traveling at their destinations via public transport. Together<br />
with our business partners we are making the uncomplicated<br />
use of public transport at any time a reality for our customers<br />
thanks to our e-ticketing project called A Touch&Travel [1].<br />
Passenger Transport <strong>2010</strong> [%]<br />
65<br />
8<br />
27<br />
DB <strong>Bahn</strong> Long-Distance<br />
DB <strong>Bahn</strong> Regional<br />
(including DB <strong>Bahn</strong> Urban)<br />
DB Arriva<br />
Total revenues: € 13,606 million<br />
Based on our position in our home market, and the new Arriva<br />
activities we acquired during the year under review, we are currently<br />
one of the leading mobility providers in Europe. Against<br />
this backdrop, we are pursuing our goal of reinforcing our position<br />
as the leading provider of mobility services in Germany and<br />
further expanding our position in the rest of Europe.<br />
MARKET POSITIONS PASSENGER TRANSPORT 2009<br />
No. 2 in rail passenger transport in Europe<br />
[ based on revenues ]<br />
No. 1 in public local passenger transport<br />
in Europe [ based on revenues ]<br />
No. 2 provider of passenger transport<br />
services in Europe [ based on revenues ]<br />
1. SNCF 1. DB 1. SNCF<br />
2. DB 2. SNCF 2. DB<br />
3. Trenitalia 3. RATP 3. Air France-KLM<br />
4. NS 4. First Group 4. Lufthansa<br />
5. First Group 5. Transport for London 5. Trenitalia<br />
Data for competitors based on business /research reports and own calculations.<br />
| [1] A www.touchandtravel.de
| GROUP INFORMATION<br />
| Group profile<br />
51<br />
DB BAHN LONG-DISTANCE BUSINESS UNIT<br />
KEY FIGURES <strong>2010</strong><br />
The DB <strong>Bahn</strong> Long-Distance business unit offers national and<br />
cross-border long-distance rail transport services. Regularly<br />
scheduled daily service is the core business of long-distance<br />
transport. We want to convince customers of our offers and<br />
expand our market share by keeping our promise of providing<br />
quick and comfortable connections directly into cities at attractive<br />
prices. Furthermore, DB AutoZug also offers car transport<br />
and night train transports. Beyond our services in Germany we<br />
are gradually building up our international offerings.<br />
Improving the quality of our services and products is at the<br />
core of our activities along with the expansion of our competitiveness<br />
in an increasingly liberalized market environment. The<br />
stabilization and optimization of our vehicle fleet is the indispensable<br />
foundation for realizing this.<br />
As part of our efforts to increase our international share of<br />
market we particularly focus on further developing our international<br />
routes in cooperation with other European railways.<br />
DB BAHN REGIONAL BUSINESS UNIT<br />
As of January 1, 2011, all of our regional bus and rail transport<br />
activities in Germany, as well as cross-border regional transport<br />
services to and from Germany, were bundled together in the<br />
DB <strong>Bahn</strong> Regional business unit.<br />
a 125.7 million passengers<br />
a 36.0 billion pkm volume sold<br />
a € 3,729 million total revenues<br />
a € 117 million adjusted EBIT<br />
a 15,270 employees<br />
Our rail transport business offers connections to major<br />
metropolitan areas as well as rural destinations via our extensive<br />
regional transport network. Regionally positioned transport<br />
operations link planning and provision of services locally in<br />
cooperation with contracting agencies and transport associations.<br />
Our aim: an integrated local rail and bus transport offer<br />
designed to meet local transport needs. We have built a streamlined,<br />
market-aligned organizational structure based on the<br />
principles of customer orientation and profitability.<br />
Competition in the German rail passenger local transport market<br />
has been very tough for years. We want to secure our market<br />
position as the largest provider of local transport services in<br />
Germany through coordinated transport concepts, a modern<br />
fleet and convincing quality and good service.<br />
We are active in the bus transport segment with 22 different<br />
bus companies in Germany in the public road transport business,<br />
either serving our own commercial interests or on behalf of cities<br />
or counties. We have positioned ourselves with this business<br />
unit so that we will be able to realize opportunities as this market,<br />
which is still very fragmented, opens and develops. Additionally,<br />
we will participate in the liberalization of the long-distance bus<br />
transport market with own services offered.<br />
DB ARRIVA BUSINESS UNIT<br />
As of January 1, 2011 we bundled together all of our local and<br />
regional transport activities outside of Germany (with the exception<br />
of cross-border routes to and from Germany) in the new<br />
DB Arriva business unit. The business unit comprises Arriva’s<br />
bus and rail transports and our previous activities in Denmark,<br />
Great Britain and Sweden.<br />
DB Arriva’s range of services extend from bus transports<br />
in London, water buses in Denmark, through to extensive rail<br />
transport in Great Britain, the Netherlands and Scandinavia.<br />
DB Arriva is active in a total of 11 European countries: Denmark<br />
(bus and rail), Great Britain (bus and rail), Italy (bus), the<br />
Netherlands (bus and rail), Poland (rail), Portugal (bus), Sweden<br />
(bus and rail), Slovakia (bus), Spain (bus), the Czech Republic<br />
(bus) and Hungary (bus). In the 2011 financial year DB Arriva<br />
will begin bus services in its 12th country, Malta.<br />
DB Arriva’s core competencies include cooperating with<br />
national, regional and local contracting organizations as well as<br />
the fulfillment of transport contracts and meeting complex<br />
requirements demanded by contracting organization.<br />
The focus of the DB Arriva business unit is on continually<br />
improving its quality and service, winning (or retaining) transport<br />
contracts. And expanding its business, especially in the<br />
opening European markets.<br />
DB Arriva already has a good market position as the leading<br />
provider of bus transport in Denmark and is one of the leading<br />
providers of bus transport services in Great Britain, the Netherlands<br />
and Portugal.
52<br />
| DEUTSCHE BAHN GROUP<br />
Transport and Logistics<br />
We have positioned ourselves with a single market appearance<br />
under the DB Schenker brand as a strong partner to transport<br />
and logistics customers around the world.<br />
As a globally integrated logistics service provider, DB<br />
Schenker operates the leading freight railway in Europe.<br />
DB Schenker stands out from the rest because of its dense<br />
network of locations in the world’s most significant economic<br />
regions, in air and ocean freight, in European land transport,<br />
as well as in contract logistics and supply chain management.<br />
This combination of capabilities enables us to offer quick and<br />
efficient solutions for the various requirements of customers<br />
from trade and industry.<br />
We offer our customers worldwide solutions from bulk goods<br />
to parcels via all modes of transport along the entire logistics<br />
chain. We can do this by connecting our position in European<br />
rail transport and European land transport with our strong position<br />
in the worldwide air and ocean freight business as well as<br />
in contract logistics and supply chain management.<br />
Transport and Logistics <strong>2010</strong> [%]<br />
24<br />
76<br />
DB Schenker Logistics<br />
DB Schenker Rail<br />
Total revenues: € 18,894 million<br />
International markets are growing together and the outsourcing<br />
of complete service packages is advancing. These trends will<br />
continue in the next few years. This means that not only<br />
will transport needs increase, the demands facing all partners<br />
will also rise. In view of current and future customer requirements<br />
it is also necessary to integrate rail freight transport into<br />
comprehensive logistics offers. We oriented our activities to<br />
achieve this early on.<br />
MARKET POSITIONS TRANSPORT AND LOGISTICS 2009<br />
No. 1 in European rail freight transport<br />
[ based on tkm ]<br />
No. 1 in European land transport<br />
[ based on revenues ]<br />
No. 2 in worldwide air freight<br />
[based on t]<br />
1. DB Schenker 1. DB Schenker 1. DHL<br />
2. SNCF 2. DHL 2. DB Schenker<br />
3. PKP 3. Dachser 3. Kuehne + Nagel<br />
4. Rail Cargo Austria 4. DSV 4. Panalpina<br />
5. Trenitalia 5. Geodis<br />
No. 3 in worldwide ocean freight<br />
[based on TEU ]<br />
No. 5 in global contract logistics<br />
[ based on revenues ]<br />
1. DHL 1. DHL<br />
2. Kuehne + Nagel 2. CEVA Logistics<br />
3. DB Schenker 3. Kuehne + Nagel<br />
4. Panalpina 4. Wincanton<br />
5. DB Schenker<br />
Data for competitors based on business /research reports and own calculations.
| GROUP INFORMATION<br />
| Group profile<br />
53<br />
DB SCHENKER RAIL BUSINESS UNIT<br />
DB SCHENKER LOGISTICS BUSINESS UNIT<br />
KEY FIGURES <strong>2010</strong><br />
a 415.4 million t freight carried<br />
a 105.8 billion tkm volume sold<br />
a € 4,584 million total revenues<br />
a € 12 million adjusted EBIT<br />
a 32,618 employees<br />
KEY FIGURES <strong>2010</strong><br />
a 81 million shipments in European<br />
land transport<br />
a 1.2 million t air freight<br />
a 1.6 million TEU ocean freight<br />
a € 14,310 million total revenues<br />
a € 304 million adjusted EBIT<br />
a 58,671 employees<br />
Today, we are already Europe’s biggest provider of international<br />
network services in rail freight transport. The European market<br />
offers us great growth potential, especially on long and heavyvolume<br />
routes. This is why we have strategically positioned<br />
ourselves quite well in Europe with our own companies as well<br />
as with cooperating partners thus enabling us to also offer our<br />
customers a uniform level of quality in our international transport<br />
business.<br />
DB Schenker Rail consists of three regions: East, Germany/<br />
Central and West. The regions are supplemented by four centrally<br />
handled functions: production, sales, finance and human<br />
resources. Business activities in the regions are conducted by<br />
our own companies as required by the market either as full TOC,<br />
dedicated production or sales companies.<br />
Our range of products extends from open network systems<br />
for transport of single wagons or wagon groups, through to block<br />
trains as point-to-point transports, to selected additional logistical<br />
services (e.g. road/rail transshipment of bulk goods in railports,<br />
or maintenance services) and a full spectrum of services associated<br />
with combined transport. DB Schenker Rail has special know-how<br />
in the areas of iron, coal and steel (Montan) area, chemicals,<br />
petroleum-based products, agricultural products, forestry, consumer<br />
goods freight, building materials and waste disposal.<br />
Our presence in about 2,000 locations in over 130 countries enables<br />
us to assert ourselves as a global player in markets known for<br />
having rapid rates of growth, tough competition and consolidating<br />
at an increasing pace. We are one of the leading providers in the<br />
fields of European land transport, global air and ocean freight as<br />
well as contract logistics. Our aim is to hold and expand this<br />
position in the future. This is the reason why we further reinforced<br />
our networks systematically in the past few years by making<br />
major investments in logistics centers, our IT infrastructure and<br />
in acquisitions. At the same time, we were able to further optimize<br />
the cost-effectiveness and quality of our offers.<br />
Our land transport business connects key European business<br />
regions via our dense network of regularly scheduled transports.<br />
Our portfolio of services ranges from shipping parcels to lessthan-carload<br />
shipments through to partial and complete loads.<br />
In the area of air freight we offer the full spectrum of<br />
advanced and highly qualified services at a global level. We<br />
are also present around the world when it comes to offering<br />
customers the complete range of ocean freight services. Our<br />
strengths include our knowledge of special conditions in local<br />
markets plus intensive customer support coupled with our<br />
global know-how.<br />
Our long years of experience in the contract logistics business<br />
has enabled us to build a series of replicable and yet flexible<br />
standard services for various industries. The foundation of these<br />
services in our worldwide network of logistics centers is located<br />
at the key junctions of global flows of goods. Our customers<br />
expect a modular range of solutions from a logistics service<br />
provider as well as demand-oriented capacities at any time – for<br />
individual projects as well as global procurement and distribution<br />
concepts. Our supply chain management expertise enables<br />
us to develop integrated solutions that are tailor-made to our<br />
customers’ requirements and effectively link together the services<br />
of our individual carriers and our logistics centers.
54<br />
| DEUTSCHE BAHN GROUP<br />
Services<br />
DB SERVICES BUSINESS UNIT<br />
KEY FIGURES <strong>2010</strong><br />
The availability of reliable services is a central prerequisite for<br />
smooth provision of mobility and logistical services and thus<br />
for the competitiveness of rail transport.<br />
a € 3,114 million segment revenues<br />
a € 129 million adjusted EBIT<br />
a 25,131 employees<br />
DB Group companies are the main customers of the primarily<br />
transport-related infrastructure management and infrastructurerelated<br />
services. Non-Group business is aimed above all at optimizing<br />
capacity utilization, quality and price benchmarking, and<br />
the future positioning of the business unit’s supplementary<br />
infrastructure-related offers. The business unit consists of six<br />
different divisions:<br />
a DB Vehicle Maintenance offers comprehensive inspection<br />
and maintenance works as well as conversion, modernization,<br />
revision of rail vehicles and the reconditioning of<br />
components such as wheel sets, bogies or brakes at 15<br />
locations in Germany. DB Waggonbau Niesky is also active<br />
in producing freight wagons and components.<br />
a DB Systel, the IT and telecommunications service provider<br />
of DB Group, develops and operates as a full service provider<br />
of IT and telecommunications solutions for the travel and<br />
logistics market. The portfolio covers the entire IT valueadded<br />
chain: from consulting and conception to development<br />
right up to operation and support. Customers also<br />
include mobile telephone network and landline carriers,<br />
DSL providers and cable network operators. The range of<br />
services also includes high-security digital radio networks<br />
such as the GSM-R network.<br />
a DB Services is the nationwide leading system service provider<br />
for professional facility management and industrial<br />
services. The range of services includes professional technical<br />
and infrastructural facility management in commercial,<br />
administration, transport and industrial buildings. Furthermore,<br />
the passenger rail cars in operation are cleaned inside<br />
and out on a daily basis. DB services’ non-Group customers<br />
include shipping companies, airports and airlines.<br />
a DB Fleet Management is the mobility and fleet manager of<br />
DB Group and one of the leading suppliers with around<br />
26,000 vehicles across Germany. Furthermore, DB Fleet<br />
Management also carries out mobility and fleet management<br />
services for other companies and the German<br />
armed forces. With DB Carsharing we offer a comprehensive<br />
mobility network in 160 locations with about 2,200 vehicles.<br />
With the car sharing model Flinkster we are accommodating<br />
urban mobility needs. The range is rounded out by our<br />
bicycle rental system, Call a Bike.<br />
a DB Communication Technology is the specialist in area<br />
services in the technical sector. The range of services covers<br />
maintenance and repair of IT and network technology,<br />
safety engineering and multimedia passenger information<br />
systems. This also includes automation technology and<br />
media services.<br />
a DB Sicherheit (security) bundles security functions in<br />
DB Group and offers guard and security services for travelers,<br />
employees, goods, railway facilities and real estate.<br />
DB Sicherheit is the leading supplier in the public transport<br />
sector in Germany.<br />
Infrastructure<br />
A high-quality and reliable infrastructure is the central prerequisite<br />
for smooth rail transport and therefore the long-term<br />
competitiveness of rail transport.<br />
Infrastructure <strong>2010</strong> [%]<br />
13<br />
31<br />
56<br />
DB Netze Track<br />
DB Netze Energy<br />
DB Netze Stations<br />
Total revenues: € 8,125 million<br />
In order to optimize our services we have bundled our infrastructure<br />
expertise under the brand “DB Netze.” Free and easy access<br />
to the rail infrastructure in Germany, individual services and high<br />
reliability – this is what our business units DB Netze Track,<br />
DB Netze Stations and DB Netze Energy stand for. We establish<br />
the requirements for safe, reliable, efficient and environmentally<br />
friendly movement of passengers and goods via rail transport<br />
through our integrated infrastructure management system.
| GROUP INFORMATION<br />
| Group profile<br />
55<br />
DB NETZE TRACK BUSINESS UNIT<br />
DB NETZE STATIONS BUSINESS UNIT<br />
KEY FIGURES <strong>2010</strong><br />
a 1,032 million train-path kilometers<br />
a € 4,580 million total revenues<br />
a € 601 million adjusted EBIT<br />
a 39,849 employees<br />
KEY FIGURES <strong>2010</strong><br />
a 140.9 million station stops<br />
a € 1,044 million total revenues<br />
a € 217 million adjusted EBIT<br />
a 4,636 employees<br />
The DB Netze Track business unit is the service provider for the<br />
over 370 train operating companies (TOCs) – including 340 non-<br />
Group railways. All of them use the German rail network, which<br />
is about 33,600 km long and the largest in all of Europe. Due to<br />
its central location this network is highly significant for the whole<br />
transport economy in Europe.<br />
The German rail network has been open for use to all TOCs<br />
authorized in Germany without discrimination since 1994.<br />
DB Netz <strong>AG</strong> independently ensures non-discriminatory access<br />
to our infrastructure.<br />
The notable increase in usage by non-Group TOCs has been<br />
visible as a trend for years. In the interim, the non-Group TOCs hold<br />
a 19 % share of total demand for train path (previous year: 17 %).<br />
We create the foundation for high-performance and reliable<br />
rail transport with a high-quality rail network that is oriented<br />
towards the needs of TOCs. We ensure the safe operation of<br />
our rail infrastructure (long-distance/major metropolitan areas<br />
network, regional network, marshaling yards and maintenance<br />
facilities), the marketing of customer-oriented track usage offers<br />
and the preparation of schedules in close collaboration with<br />
the TOCs. In addition to this, we also carry out maintenance<br />
and repair work, further develop the rail infrastructure by<br />
making capital expenditures in the existing network, modern<br />
command and control technology. We also build new lines and<br />
upgrade old ones. The financing of the infrastructure by the<br />
Federal and the state governments plays a central role in all of<br />
these activities.<br />
Our passenger stations not only serve as gateways to the rail<br />
system, they also act as hubs linking various modes of transport<br />
together in addition to their roles as marketplaces and calling<br />
cards for cities and regions. The business unit’s activities encompass<br />
the operation of passenger stations as traffic stations as<br />
well as the development and marketing of train station space.<br />
We are responsible for ensuring non-discriminatory access to our<br />
infrastructure. The number of station stops of non-Group customers<br />
has been increasing for years. In addition to construction<br />
measures, emphasis is placed on comprehensive service competence,<br />
a high level of safety, good customer information and<br />
functional route management. Moreover, there is also the aspect<br />
of the rental business strengthening our earning power, especially<br />
in train stations that are highly frequented by customers.<br />
DB NETZE ENERGY BUSINESS UNIT<br />
KEY FIGURES <strong>2010</strong><br />
a 10,326 GWh traction current<br />
a 481 million l diesel<br />
a € 2,501 million total revenues<br />
a € 82 million adjusted EBIT<br />
a 1,536 employees<br />
The DB Netze Energy business unit bundles together the responsibility<br />
to provide TOCs with power derived from a range of<br />
energy sources with the technical know-how needed to perform<br />
this task. In addition to planning, maintenance, marketing and<br />
operation of technically complex energy networks, the sustainable<br />
generation and procurement of traction and stationary<br />
energy are also included in our range of services. As an independent<br />
energy manager we guarantee smooth operations and<br />
supply traction power and fuels on a non-discriminatory basis<br />
to all TOCs in Germany. Furthermore, we provide energy services<br />
for customers from industry, trade and the services sector.
04 GROUP<br />
MAN<strong>AG</strong>EMENT<br />
REPORT<br />
OVERVIEW 58<br />
ASSESSMENT OF THE ECONOMIC SITUATION BY THE MAN<strong>AG</strong>EMENT BOARD 59<br />
BUSINESS AND OVERALL CONDITIONS 60<br />
RESOURCES FROM THE ECONOMIC STIMULUS PACK<strong>AG</strong>ES ARE TAPPED 60<br />
CHANGES IN DB GROUP 60<br />
BUSINESS ENVIRONMENT 6 1<br />
POLITICAL ENVIRONMENT 64<br />
DEVELOPMENTS IN THE RELEVANT MARKETS 66<br />
BUSINESS PERFORMANCE 72<br />
MAJOR CHANGES IN YEAR-ON-YEAR COMPARISON 7 2<br />
DEVELOPMENT OF REVENUES 7 2<br />
DEVELOPMENT OF PROFITS 7 5<br />
VALUE MAN<strong>AG</strong>EMENT 78<br />
DEVELOPMENT OF BUSINESS UNITS 83<br />
PASSENGER TRANSPORT 83<br />
TRANSPORT AND LOGISTICS 89<br />
SERVICES 93<br />
INFRASTRUCTURE 94<br />
FINANCIAL SITUATION 97<br />
FINANCIAL MAN<strong>AG</strong>EMENT 97<br />
CASH FLOW STATEMENT 98<br />
NET FINANCIAL DEBT 98<br />
CAPITAL EXPENDITURES 100<br />
BALANCE SHEET 102<br />
STRATEGY 104<br />
ECONOMIC AND FINANCIAL CRISIS SUCCESSFULLY MASTERED 104<br />
VISION AND STRATEGY CONFIRMED 104<br />
CLEAR STRATEGIC THRUST 106<br />
INTEGRATED MOBILITY IN GERMANY AND POSITIONING IN EUROPE 107
EFFICIENT GLOBAL NETWORKS AND LOGISTICS EXPERTISE 108<br />
A SINGLE SOURCE FOR HIGH-QUALITY SERVICES 109<br />
GUARANTEEING A RELIABLE AND AFFORDABLE INFRASTRUCTURE 109<br />
SUSTAINABILITY 111<br />
EMPLOYEES 111<br />
ENVIRONMENT 114<br />
SOCIAL COMMITMENT 1 1 7<br />
TECHNOLOGY AND PROCUREMENT 118<br />
MASTER PLAN T FOR REORIENTING THE<br />
RAIL TECHNOLOGY AND SERVICES BOARD DIVISION 118<br />
TECHNOLOGY 118<br />
PROCUREMENT 120<br />
ADDITIONAL INFORMATION 121<br />
RISK REPORT 124<br />
RISK MAN<strong>AG</strong>EMENT WITHIN DB GROUP 124<br />
KEY RISK CATEGORIES AND INDIVIDUAL RISKS 125<br />
GENERAL STATEMENT REGARDING DB GROUP’S RISK SITUATION 128<br />
EVENTS AFTER THE BALANCE SHEET DATE 129<br />
OUTLOOK 131<br />
FUTURE DIRECTION OF DB GROUP 131<br />
ECONOMIC OUTLOOK 131<br />
ANTICIPATED DEVELOPMENT IN THE RELEVANT MARKETS 133<br />
ANTICIPATED DEVELOPMENT OF THE PROCUREMENT AND CAPITAL MARKETS 134<br />
ANTICIPATED DEVELOPMENT OF IMPORTANT BUSINESS CONDITIONS 135<br />
ANTICIPATED INCOME SITUATION 135<br />
ANTICIPATED FINANCIAL SITUATION 137<br />
ANTICIPATED DEVELOPMENT IN THE 2012 FINANCIAL YEAR 137<br />
OPPORTUNITIES REPORT 138<br />
OVERALL STATEMENT REGARDING THE ECONOMIC DEVELOPMENT OF DB GROUP 139
58<br />
| DEUTSCHE BAHN GROUP<br />
Overview<br />
a Positive effects from the world economy’s noticeable recovery during the <strong>2010</strong> financial year<br />
a Rail freight transport and worldwide logistics post significant rates of increase<br />
a Favorable forecast for the 2011 financial year<br />
Selected key figures [ € million ] <strong>2010</strong> 2009 Change<br />
absolute %<br />
Passengers rail and bus (million) 1) 2,734 2,708 +26 +1.0<br />
Volume sold rail passenger transport (million pkm) 1) 78,582 76,772 + 1,810 +2.4<br />
Volume sold rail freight transport (million tkm) 105,794 93,948 +11,846 +12.6<br />
Train kilometers on track infrastructure (million train-path km) 1,034 1,003 + 31 + 3.1<br />
Shipments in European land transport (thousand) 80,816 70,052 +10,764 +15.4<br />
Air freight volume (export) (thousand t) 1,225 1,032 +193 +18.7<br />
Ocean freight volume (export) (thousand TEU) 1,647 1,424 +223 +15.7<br />
Revenues 34,410 29,335 + 5,075 +17.3<br />
Revenues comparable 32,456 29,335 + 3,121 +10.6<br />
EBIT adjusted 1,866 1,685 +181 +10.7<br />
EBITDA adjusted 4,651 4,402 +249 + 5.7<br />
Net profit for the year 1,058 830 +228 +27.5<br />
ROCE 6.0 % 5.9 % – –<br />
Net financial debt as of Dec 31 16,939 15,011 + 1,928 + 12.8<br />
Net financial debt as of Dec 31 (excluding DB Arriva) 13,966 15,011 –1,045 –7.0<br />
Gross capital expenditures 6,891 6,462 + 429 + 6.6<br />
1)<br />
Excluding DB Arriva.<br />
During the year under review, <strong>Deutsche</strong> <strong>Bahn</strong> Group (DB Group)<br />
was once again able to achieve significant volume increases in<br />
all of the relevant markets, which allowed it to continue the<br />
growth trend that was interrupted in the previous year due to<br />
the economic and financial crisis.<br />
In particular, this applies to rail freight transport as well as<br />
to our worldwide transport and logistics activities, which incurred<br />
significant losses in some areas during the previous year. In the<br />
area of global ocean freight as well as in European land freight,<br />
the volumes for the year under review were once again higher<br />
than the pre-crisis level in 2008. Worldwide air freight nearly<br />
reached its pre-crisis level after a sharp decline in 2009. The<br />
main driver of this development was the significant improvement<br />
of the A macroeconomic environment [1], particularly in Asia<br />
and in our home market of Germany.<br />
The A performance of our business units for passenger<br />
transport [2], which during the previous year was affected only<br />
slightly by the negative environmental conditions, was also favorable.<br />
Increases were recorded in both long-distance and regional<br />
transport. Higher demand for train-path, particularly in rail freight<br />
transport, had a positive effect in the infrastructure area.<br />
The volume increases are reflected in a corresponding A revenue<br />
increase [3] across all business units.<br />
Significant effects on the profit, financial and asset situation<br />
during the year under review also result from the A change<br />
in the scope of consolidation [4]. Here, the acquisition of the<br />
British passenger transport company Arriva, concluded at the<br />
end of August <strong>2010</strong>, played a decisive role with a revenue contribution<br />
of about € 1 billion. After this acquisition, there were<br />
also changes made to the A organizational structure [5] of<br />
DB Group that will take effect starting in the 2011 financial year.<br />
The A development of profits [6] was positive overall in<br />
the year under review, though somewhat lessened by the<br />
restricted vehicle availability, the unusual weather conditions<br />
and the significantly higher maintenance costs for vehicles and<br />
infrastructure.<br />
Our Group-wide reACT program, initiated during the previous<br />
year, moved into the implementation phase during the year<br />
under review after the completion of the conceptual work. The<br />
results from the further implementation of the project were as<br />
positive as expected for the year under review, and the targets<br />
were met.<br />
| [1] A Page 61 ff.<br />
| [2] A Page 85 ff. | [3] A Page 72 ff.<br />
| [4] A Page 72<br />
| [5] A Page 84<br />
| [6] A Page 75 ff.
| GROUP MAN<strong>AG</strong>EMENT REPORT<br />
| Overview<br />
59<br />
Detailed information about the performance of the individual<br />
business units may be found in the A chapter “Business<br />
units” [1].<br />
In contrast to the previous year, DB Group’s overall development<br />
was hardly influenced by A special items [2] during the<br />
year under review. The adjusted profit measures and the<br />
A adjusted profit and loss statement [2] do not include the<br />
special items for the year under review and the previous year.<br />
Despite the significantly lower number of special items, the<br />
development of A net profit for the year [3] was clearly<br />
positive for the year under review.<br />
The development of our ROCE A value management key<br />
figure [4] was hampered in the year under review by the complete<br />
inclusion of Arriva’s capital employed, together with adjusted<br />
EBIT contributions that were accounted for only proportionally.<br />
Excluding the Arriva acquisition, the ROCE figure rose to 6.4 %.<br />
As of December 31, <strong>2010</strong>, A net financial debt [5] was<br />
significantly higher than the same year-ago figure due to the<br />
Arriva acquisition. The acquisition also affected the development<br />
of the A value management key figures of redemption coverage<br />
and gearing [6]. Excluding the acquisition, we were once<br />
again able to reduce our net financial debt significantly, by about<br />
€ 1 billion.<br />
DB Group also had very smoothly functioning access to<br />
capital markets during the year under review and was able to<br />
obtain outside capital for refinancing expiring debts and for<br />
acquiring Arriva, at attractive conditions.<br />
Our A capital expenditure activities [7] were also at a<br />
high level in the year under review. Gross capital expenditures<br />
increased noticeably in the year under review. In the area of rail<br />
infrastructure, the additional resources from the A economic<br />
stimulus packages [8] were also felt.<br />
ASSESSMENT OF THE ECONOMIC SITUATION<br />
BY THE MAN<strong>AG</strong>EMENT BOARD<br />
On the basis of the development in the year under review, the<br />
Management Board of <strong>Deutsche</strong> <strong>Bahn</strong> <strong>AG</strong> (DB <strong>AG</strong>) considers the<br />
economic situation of DB Group to be positive.<br />
During the year under review, DB Group once again reported<br />
increases in revenues, operating earnings and ROCE, both on a<br />
comparable basis and after taking changes in the scope of consolidation<br />
into account.<br />
Using a comparable basis, the development of DB Group in<br />
the year under review – with the exception of revenue development<br />
– corresponds to the forecast made in our 2009 annual<br />
report for the <strong>2010</strong> financial year. The area of revenue development<br />
reflected the development of the economic conditions,<br />
which was much more favorable than we projected and led to<br />
greater revenue growth than expected.<br />
Our strategic approach proved to be solid during the crisis,<br />
and during the year under review it made a significant contribution<br />
towards our substantial recovery. Following the notable<br />
effects of the financial and economic crisis in the previous year,<br />
DB Group was able to resume the growth trend that was established<br />
in the years up to 2008.<br />
Our analyses show that the long-term megatrends in our<br />
markets (globalization, climate change and resource scarcity,<br />
liberalization and deregulation as well as demographic change)<br />
will continue to define the basis of our strategy, and should have<br />
a positive effect on our business development. The A strategic<br />
objectives [9] of DB Group will therefore remain unchanged.<br />
Business development of DB Group was favorable at the<br />
beginning of the 2011 financial year allowing the Management<br />
Board to confirm its expected forecast at the time of preparing<br />
the <strong>2010</strong> annual report. Based on the current perspective, the<br />
Management Board assumes that the revenues and adjusted<br />
EBIT will continue to develop and improve according to the<br />
statements made in the A outlook [10].<br />
| [1] A Page 83 ff. | [2] A Page 75 f.<br />
| [7] A Page 100 ff. | [8] A Page 60<br />
| [3] A Page 76<br />
| [9] A Page 104 ff.<br />
| [4] A Page 78 ff. | [5] A Page 98 f.<br />
| [10] A Page 131 ff.<br />
| [6] A Page 80 f.
60<br />
| DEUTSCHE BAHN GROUP<br />
Business and overall conditions<br />
a Successful takeover of the passenger transport company Arriva<br />
a Notable economic recovery seen in <strong>2010</strong><br />
a Transport markets resume growth<br />
RESOURCES FROM THE ECONOMIC STIMULUS<br />
PACK<strong>AG</strong>ES ARE TAPPED<br />
In order to counter the effects of the economic crisis and save<br />
employment in Germany, the Federal Republic of Germany<br />
approved an economic stimulus program that was to run until<br />
2011. Additional information on this subject may be found on<br />
page 121 of the DB Group’s 2009 <strong>Annual</strong> <strong>Report</strong>.<br />
Economic Stimulus Package I, containing € 620 million,<br />
stopped at the end of <strong>2010</strong>. Economic Stimulus Package II,<br />
containing about € 775 million, will remain in the implementation<br />
phase for another year. All of the orders were placed in the<br />
market during the year under review. A total of about € 699 million<br />
was drawn down from both of the economic stimulus packages.<br />
The main emphasis of capital expenditures made in<br />
conjunction with the economic stimulus packages was placed<br />
on accelerating requirement plan projects within the DB Netze<br />
Track business unit (including upgrading the Nuremberg-Erfurt<br />
line) and modernization measures (improving the appearance,<br />
weather protection features, safety and passenger information)<br />
at small and mid-sized train stations in the DB Netze Stations<br />
business unit.<br />
CHANGES IN DB GROUP<br />
Changes in the DB <strong>AG</strong> Management Board<br />
Stefan Garber laid down his mandate as a member of the Management<br />
Board of DB <strong>AG</strong>, with responsibility for the Infrastructure<br />
division effective March 31, <strong>2010</strong>. He was succeeded on April 1,<br />
<strong>2010</strong> by Dr. Volker Kefer, who had already served as the provisional<br />
head of the Infrastructure division since December 9, 2009, for<br />
the remaining term of his existing appointment. Dr. Volker Kefer<br />
will also remain responsible for the Rail Technology and Services<br />
division that he also heads as member of the Management Board<br />
of DB Mobility Logistics <strong>AG</strong> (DB ML<strong>AG</strong>).<br />
Diethelm Sack resigned his mandate as member of the<br />
Management Board of DB <strong>AG</strong> and CFO effective March 31, <strong>2010</strong>.<br />
He was succeeded by Dr. Richard Lutz, who was appointed a<br />
member of the DB <strong>AG</strong> Management Board for a term of three<br />
years as of April 1, <strong>2010</strong>. Dr. Richard Lutz was appointed to<br />
concurrently serve as a member of the Management Board and<br />
CFO of DB ML<strong>AG</strong>.<br />
Corporate Governance report<br />
The A Corporate Governance report [1], which also contains<br />
the compensation report, is part of the group management<br />
report.<br />
Acquisition of the British passenger<br />
transport company Arriva<br />
On May 18, <strong>2010</strong> we submitted a binding offer to the shareholders<br />
of the British passenger transport company Arriva Plc (Arriva),<br />
Sunderland/Great Britain, to acquire all of the shares in Arriva<br />
thereby fully taking over the company.<br />
On June 17, <strong>2010</strong> 85.1 % of Arriva’s shareholders representing<br />
90.4 % of the company’s outstanding shares voted to accept our<br />
takeover offer. In accordance with British takeover law, once the<br />
acceptance level of 75 % has been reached all shareholders are<br />
bound to accept the takeover offer. Following the Court hearings<br />
on August 24 and 26, <strong>2010</strong> and the registration of the court<br />
orders, the Scheme of Arrangement whereby DB Group acquired<br />
all of the shares of Arriva took effect on August 27, <strong>2010</strong>. The<br />
listing of Arriva’s shares was cancelled on August 31, <strong>2010</strong>. As<br />
of this date Arriva became a fully owned subsidiary of DB UK<br />
Holding Limited, Doncaster/Great Britain, and a part of DB<br />
Group. As of September 1, <strong>2010</strong> Arriva has been fully included<br />
into the scope of consolidation with the exception of Arriva<br />
Germany.<br />
Per commitments made to the EU Commission, DB Group<br />
had to sign a legally binding agreement with an appropriate<br />
buyer to divest all of Arriva’s activities in Germany by December<br />
11, <strong>2010</strong>. On December 8, <strong>2010</strong> the Supervisory Board approved<br />
an agreement to sell Arriva Germany Group to a consortium<br />
consisting of Ferrovie dello Stato, an Italian railway company,<br />
which also served as consortium manager, and Cube Transport<br />
SCA, a Luxemburg-based infrastructure fund. On February 16,<br />
2011 the European Commission approved the selected buyers<br />
and further stated that they had no cartel-related objections to<br />
the purchase thus clearing the way for the deal to be closed and<br />
fully concluded on February 25, 2011.<br />
| [1] A Page 28 ff.
| GROUP MAN<strong>AG</strong>EMENT REPORT<br />
| Business and overall conditions<br />
61<br />
Squeeze-out at DB Schenker Rail Polska<br />
During the year under review DB Group extended a voluntary<br />
takeover offer to the minority shareholders of DB Schenker Rail<br />
Polska S.A., Jaworzno/Poland; DB Schenker Rail Rybnik S.A.,<br />
Rybnik /Poland and DB Schenker Rail Zabrze S.A., Zabrze/Poland,<br />
to raise the percentage of shares held in all three companies to<br />
well over 95 %. Following a successfully executed squeeze-out<br />
arrangement, we subsequently increased our stakes to 100 % in<br />
each of the companies and became the sole owner of these three<br />
companies.<br />
Our globally oriented freight forwarding and logistics activities<br />
were favorably influenced, in particular, by notable gains seen<br />
in capital spending, industrial production as well as global trade.<br />
This in turn led to a significant expansion of our business activities.<br />
We grew at least as fast as the market in those markets<br />
that are relevant for our business, and we also returned to precrisis<br />
levels in these markets.<br />
Development of GDP reflects the<br />
economic and financial crisis<br />
Consolidation of activities in Hungary<br />
During the year under review we used the opportunity to obtain<br />
the remaining 50 % of shares in each of the two joint ventures in<br />
Hungary: MASPED-RAILOG and Masped-Schenker. We then merged<br />
the activities of all our Hungarian companies into Schenker Nemzetközi<br />
Szallitmanyozasi es Logisztikai Kft, Budapest /Hungary.<br />
BUSINESS ENVIRONMENT<br />
Management Board evaluation of<br />
the business environment<br />
The continuing recovery of the global economy in <strong>2010</strong> sparked<br />
growth in our key markets and therefore on the development<br />
of our business.<br />
During the year under review we noted that the prices of<br />
two commodities (oil and coal) of importance to our development<br />
were driven higher by economic growth. The year under<br />
review was also marked by a weaker euro due, in particular, to<br />
the refinancing difficulties experienced by individual countries<br />
within the Eurozone.<br />
The vast majority of our activities in the passenger transport<br />
sector are highly dependent on economic developments within<br />
our home market, Germany. During the year under review these<br />
developments were supported by the favorable change in the<br />
labor market and rising incomes. Within this environment our<br />
rail passenger transport business once again developed favorably.<br />
With the takeover of Arriva the European passenger transport<br />
market will play an increasingly important role for us in the future.<br />
Within the rail freight transport sector the strong development<br />
seen in key industries like the steel (Montan) industry,<br />
along with sharp gains in combined transport, which were<br />
driven, in particular, by the dynamic upturn in Germany, led to<br />
a strong recovery – despite not reaching the pre-crisis level.<br />
On an overall basis, however, our rail freight transport business<br />
did get back on track for growth following the collapse seen<br />
in the crisis year of 2009.<br />
Change in gross domestic product<br />
<strong>2010</strong> 2009<br />
(GDP) [%]<br />
World 1) +4.0 –2.3<br />
USA +2.9 –2.6<br />
China +10.3 +9.2<br />
Japan +4.0 –6.3<br />
Eurozone +1.7 –4.1<br />
Germany +3.6 –4.7<br />
1)<br />
Total selected industrial and emerging countries.<br />
Data for 2009/<strong>2010</strong> is based on information available on February 22, 2011.<br />
Source: Consensus Forecasts, FERI, Federal Statistical Office, Germany.<br />
The global economy recovered sharply in <strong>2010</strong> posting a 4 % rate<br />
of growth. However, the pace slackened during the year under<br />
review. Global trade returned to its pre-crisis level as it expanded<br />
by 13.5 %. Economic performance noted in the emerging Asian<br />
and Latin-American markets posted substantially higher growth<br />
rates than the industrialized nations and were significantly higher<br />
than their pre-crisis levels. Performance seen in rapidly growing<br />
economies like China and India were key forces driving the<br />
expansion of the global economy. The industrialized nations<br />
were less dynamic as their recovery was more moderate. Although<br />
their economic performance was significantly higher than in the<br />
depths of the financial crisis, in most cases they had not yet<br />
returned to their pre-crisis levels. The pace of economic growth<br />
slowed towards the middle of <strong>2010</strong> due to the expiration of<br />
economic stimulus programs and necessary measures taken by<br />
governments to consolidate their budgets. The unchanged tense<br />
situation in the financial and real estate sectors, rising levels of<br />
government debt, and, in some cases, high unemployment<br />
dampened economic growth in many industrialized countries.
62<br />
| DEUTSCHE BAHN GROUP<br />
The pace of economic growth in the USA slowed notably after<br />
the first half of the year <strong>2010</strong> due to the expiration of the government’s<br />
economic stimulus program and inventory buildup. The<br />
gross domestic product (GDP) of the USA rose by 3 %, mainly as<br />
a result of increased consumer spending that represents about<br />
70 % of total economic output in the USA. The situation in the<br />
labor market remained tense as the unemployment rate was<br />
stuck at a historically high level due to sluggish job growth.<br />
Capital expenditures, and especially spending for plant and<br />
equipment, expanded strongly due to the effects of pent-up<br />
demand and more attractive refinancing conditions offered to<br />
companies. The foreign trade sector did not generate much<br />
good news as imports grew somewhat larger than exports.<br />
Asia retained its status as the fastest-growing region. A<br />
more restrictive lending policy was imposed in China in the<br />
second half of the year. Together with higher interest rates and<br />
the cautious appreciation of the exchange rate in conjunction<br />
with the expiry of economic stimulus programs, this move led<br />
to the desired cooling-off of the Chinese economy. Exports<br />
contracted during the course of the year due to weaker demand<br />
in the USA. Despite the slower pace of growth, the Chinese GDP<br />
remained at a high level as it grew by 10.3 %. Therefore China<br />
replaced Japan as the second-largest economy in the world.<br />
The recovery in Japan weakened in the second half of <strong>2010</strong> as<br />
economic growth slowed due to the higher yen, which in turn<br />
stifled exports. Domestic demand contracted due to expiring<br />
economic stimulus programs. Additionally higher unemployment<br />
dampened consumer spending. Nevertheless, GDP exceeded<br />
the previous year’s level by 4 %.<br />
GDP rose by 1.7 % in the Eurozone. Growth was primarily<br />
driven by the strong development of the German economy. The<br />
recovery of Europe’s economy was primarily burdened by the<br />
end of economic stimulus programs and government spending<br />
cuts taken to consolidate their budgets. The low level of interest<br />
rates favorably influenced consumer spending and capital expenditures<br />
for plant and equipment. The French economy recovered<br />
from the recession at a steady pace that, however, was only<br />
average compared to the rebound seen in the other Eurozone<br />
countries. Consumer spending expanded and posted a positive<br />
contribution to growth although it was held back by high unemployment<br />
and weak development of disposable income. Although<br />
the level of gross capital expenditures recovered moderately, it<br />
stayed in the year under review below the 2009 level. Exports<br />
mirrored the recovery of the global economy and expanded<br />
substantially. Imports also rose significantly. A clearly restrictive<br />
fiscal policy burdened economic recovery in Great Britain along<br />
with the darkening situation in the foreign trade sector. Despite<br />
the very moderate increase in real incomes, and a barely improved<br />
situation in the labor market, private spending rose as consumers<br />
brought forward purchases ahead of the planned increase in the<br />
value-added tax rate starting at the beginning of 2011.<br />
Development noted in the new EU member countries was<br />
uneven. GDP noted for Poland, the Czech Republic and Slovakia<br />
rose sharply in comparison to the previous year due the recovery<br />
of industrial production – especially the very important automobile<br />
sector. In contrast, the Baltic states, Hungary, Romania<br />
and Bulgaria were all burdened by heavy levels of government<br />
and consumer debt as well as the resulting need to consolidate<br />
the economy. Domestic demand was hobbled by sinking real<br />
disposable incomes, high unemployment and tight credit.<br />
Germany’s GDP rose by 3.6 %, which was the fastest pace<br />
among all of the Eurozone countries. The German economy<br />
par tic ularly benefited from the sharp increase in global trade.<br />
The breadth of the recovery gained increasingly during the<br />
course of the year. In addition to double-digit growth in foreign<br />
trade, domestic demand also rose as consumer spending and<br />
capital expenditures by the business sector expanded notably.<br />
Production in the manufacturing industry, especially the heavily<br />
export-dependent chemical, automotive and machine-making<br />
industries, posted substantial gains due to strong (foreign)<br />
demand. The steel industry also benefited from the favorable<br />
development of its customers as steel production surged by<br />
34 % to nearly 44 million tons. The situation in the labor market<br />
tracked the economic recovery and improved continually. Since<br />
May <strong>2010</strong> the number of people employed and employees subject<br />
to social security contributions was higher than the same yearago<br />
level. Short-time working arrangements in force declined<br />
steadily over the year. The average number of persons employed<br />
during the year rose by about 0.5 %. The good labor market and<br />
income situation supported consumer spending which increased<br />
slightly. Driven by sharp rise in prices for oil-based products,<br />
the cost of living in Germany rose by 1.1 % over the previous<br />
year, while fuel prices rose by 11 % over the same year-ago period.<br />
Mixed development in the energy market<br />
Developments in the energy market were mixed during the year<br />
under review. Internationally traded products like crude oil and<br />
coal developed differently than nationally or regionally traded<br />
products like power and emissions rights. The prices for crude<br />
oil and coal were driven by a surprisingly strong growth of the<br />
global economy and continued to rise for part of the year, while,<br />
in contrast, future prices noted on the German power market<br />
declined.
| GROUP MAN<strong>AG</strong>EMENT REPORT<br />
| Business and overall conditions<br />
63<br />
While crude oil prices were mainly determined by general sentiment<br />
in the capital markets during the first half of <strong>2010</strong>, fundamental<br />
data played a greater role in driving prices during the<br />
second half of <strong>2010</strong>. Although the supply situation in <strong>2010</strong><br />
was noticeably favorable based on average figures for the past<br />
five years it did, however, successively worsen towards the end<br />
of <strong>2010</strong>. In the interim, some market players anticipate that a<br />
possible supply gap could occur in 3 to 5 years. This could in fact<br />
happen if current growing demand – mainly driven by emerging<br />
markets – continues unabated. Demand in the industrialized<br />
countries has also stabilized and rose during the final months<br />
of the year under review due to the early onset of winter. While<br />
the trading range for North Sea Brent oil in the first ten months<br />
of <strong>2010</strong> took place almost solely between 70 and 85 USD/barrel<br />
(bbl), it was trading above 90 USD/bbl at the end of <strong>2010</strong>. The<br />
average price for the year was over 80 USD/bbl, which was the<br />
second-highest annual average price of all times. The weakness<br />
of the euro compared to the USD exacerbated the higher prices<br />
when converted into euros.<br />
Prices noted for 50-hertz power (base load electricity) on<br />
the futures market developed unevenly during the year under<br />
review. Prices fell in the first quarter, rose in the second quarter<br />
and then fell again in the second half of the year. Contract<br />
prices for delivery in 2011 remained in a range between € 45 and<br />
€ 55/MWh during the year under review and stabilized at<br />
€ 50/MWh at the end of the year. In contrast to crude oil and<br />
coal, which reached historic averages in recent years, the average<br />
annual price for futures contracts for base load electricity<br />
remained at the previous year’s level and below the level seen<br />
in the years 2006 to 2008. In contrast to futures prices, spot<br />
prices climbed during the course of the year and experienced<br />
significantly lower volatility.<br />
During the year the coal markets posted the sharpest recovery<br />
among the energy markets. The spot market in Rotter dam rose<br />
by about 50 % while the future markets gained about 10 %. The<br />
coal markets were driven by heavy demand from India and China<br />
and at the end of <strong>2010</strong> coal prices were almost 100 % over the<br />
average noted for the years 2004 to 2006. In contrast, prices for<br />
CO 2 emissions rights showed little movement and were € 13/t<br />
at the beginning of the year and moved between € 14 and € 16/t<br />
at the end of <strong>2010</strong>.<br />
Euro faces severe test<br />
Following the global economic and financial crisis in 2009, which<br />
mainly hit banks, the main focus of problems shifted to individual<br />
countries during the year under review. Refinancing problems<br />
also arose in certain countries due to economic stimulus programs,<br />
numerous guarantee commitments and capital contributions to<br />
banks by individual governments. During the first half of <strong>2010</strong><br />
the value of the euro fell from USD 1.43 per euro to USD 1.19.<br />
Confidence in the euro returned in the second half of <strong>2010</strong> after<br />
the Eurozone countries, together with the European Central Bank<br />
(ECB) and the International Monetary Fund (IMF), were able to<br />
prevent the threatened insolvency of Greece. The euro once<br />
again advanced to over USD 1.40. This development was supported<br />
by a further easing of monetary policy in the USA. However,<br />
during the remaining course of the year Greece, Ireland,<br />
Portugal and Spain, in particular, faced increasing refinancing<br />
pressures. The euro retreated again as speculative pressures rose<br />
casting greater doubt about the financial situation in Ireland and<br />
Portugal during the year under review. At the end of <strong>2010</strong> the<br />
value of the euro had again declined to USD 1.34.<br />
Bond markets reflect sovereign debt crisis<br />
Developments in the sovereign bond markets have been driven<br />
by the increasing refinancing problems facing individual countries.<br />
The gap in yields paid by sovereign bonds issued within<br />
the Eurozone widened substantially during the year under review.<br />
While countries that were particularly affected by the economic<br />
and financial crisis were forced to accept higher refinancing<br />
costs, financially strong Eurozone countries saw the rates they<br />
paid continue to decline. The yield for ten-year German Federal<br />
bonds (bunds) fell to an all-time low of 2.09 % in August <strong>2010</strong> and<br />
then rebounded up to 3.0 % at the end of year. On one hand, a<br />
favorable economic outlook motivated investors to shift their<br />
money over to riskier asset classes, and on the other it was<br />
feared that a continuation of the sovereign debt crisis and related<br />
support measures could even drag down the stable Eurozone<br />
countries.<br />
The volume of new corporate bonds issued in the Eurozone<br />
fell by half to € 149 billion in comparison to the previous year.<br />
This change was due in part to the large liquidity cushions that<br />
companies had built in the previous year as well as the impact<br />
of the lower volume of M& A activities in the market. In contrast,<br />
companies that tapped the primary markets, and very creditworthy<br />
companies in particular, realized historically low financing<br />
costs. This development was supported by the fact that many<br />
investors regarded top-rated corporate bonds as safer than<br />
sovereign bonds.
64<br />
| DEUTSCHE BAHN GROUP<br />
POLITICAL ENVIRONMENT<br />
A report covering regulatory issues and the further development<br />
of the European legal framework in the railway sector is also<br />
contained in our annual A Competition <strong>Report</strong> [1].<br />
Regulatory environment for rail transport<br />
in Germany<br />
During the year under review the Federal Network Agency for<br />
Electricity, Gas, Telecommunications, Post and Railroads (Bundesnetzagentur<br />
für Elektrizität, Gas, Telekommunikation, Post und<br />
Eisenbahnen; BNetzA), as well as the Federal Railways Agency<br />
(Eisenbahnbundesamt; EBA) continued to regulate access to the<br />
railway infrastructure in Germany and monitor observance of<br />
guidelines regarding the unbundling of infrastructure and transport<br />
services within their respective areas of responsibility.<br />
NEW STATION PRICING SYSTEM STARTS IN 2011<br />
On January 1, 2011 DB Station& Service <strong>AG</strong> introduced a new<br />
A station pricing system [2]. The BNetzA had previously issued<br />
a ruling regarding the existing system wherein they formulated<br />
what they believed were station prices that were consistent with<br />
the law. Despite the successful appeal against this ruling in<br />
expedited legal proceedings, the new pricing system reflects<br />
the BNetzA’s demands. This meant that the BNetzA did not<br />
object to the introduction of the new prices. However, additional<br />
explanations of certain elements were required and must be<br />
submitted in 2011.<br />
The new pricing system results in shifts in state-related<br />
charges for local rail passenger transport, which will lead to additional<br />
costs for some Federal states and reduced costs for others.<br />
DB Station& Service <strong>AG</strong> is negotiating with the Federal states to<br />
explore ways to balance out the increased/decreased costs.<br />
REGIONAL FACTOR ENDS AS OF 2012 SCHEDULE<br />
BNetzA and DB Netz <strong>AG</strong> reached a settlement on August 18,<br />
<strong>2010</strong> ending court proceedings to eliminate the regional factor<br />
as a part of the train-path pricing system. The parties agreed to<br />
enter into a contract governed by public law wherein DB Netz <strong>AG</strong><br />
agrees to reduce the regional factors as of the 2011 schedule<br />
year and eliminate them entirely as of the start of the 2012 schedule<br />
year. In return, the administrative proceedings before the BNetzA<br />
were closed. In this case adjustments to the train-path pricing<br />
system intended to offset the end of the regional factors will<br />
again lead to higher or lower prices for the individual Federal<br />
states. This is why DB Netz <strong>AG</strong> is also negotiating with the<br />
Federal states to explore ways to balance out the changed costs.<br />
PRICES FOR TRACTION CURRENT TRANSMISSION LINES<br />
SUBJECT TO ENERGY INDUSTRY LAW<br />
In a final ruling made on November 9, <strong>2010</strong>, the German Federal<br />
Supreme Court ruled that fees for the use of traction current<br />
transmission lines are to be regulated in accordance with energy<br />
industry law. Based on the terms of this ruling, DB Energy GmbH<br />
must have their usages fees approved – retroactively to October<br />
2005 – by the BNetzA. The Federal agency will examine the fees<br />
using standards employed by the energy industry. DB Energy<br />
GmbH will have to establish procedures to meet the comprehensive<br />
reporting process required by energy industry law in<br />
order to meet the regulatory requirements.<br />
EXPERT OPINION TO DETERMINE COST OF CAPITAL<br />
IN RAILWAY INFRASTRUCTURE SECTOR<br />
With respect to fee regulation the BNetzA submitted in May<br />
<strong>2010</strong> for consultation an expert opinion they had commissioned<br />
for the purpose of better defining the permissible extent of<br />
access charges in the future entitled “Determination of cost of<br />
capital in the railway sector.” We participated in the consultations<br />
and commissioned A NERA Economic Consulting [3],<br />
an independent consulting firm, to prepare an expert opinion,<br />
which we published along with a statement of opinion in June<br />
<strong>2010</strong>. The purpose of the expert opinion is to define the return<br />
on capital that a railway infrastructure enterprise may earn.<br />
Discussions with the BNetzA will be continued during the course<br />
of 2011.<br />
DB NETZ <strong>AG</strong> MAY NO LONGER BE REPRESENTED<br />
BY DB <strong>AG</strong>’S LAWYERS IN ALL CASES<br />
In a final ruling made on May 18, <strong>2010</strong>, the German Federal<br />
Administrative Court ruled that as of December 1, <strong>2010</strong> DB Netz<br />
<strong>AG</strong> may no longer be advised or represented by the DB <strong>AG</strong> legal<br />
department in issues regarding access to the railway network<br />
and the train-path prices associated with this access. With this<br />
ruling the Court confirmed a 2006 decision of the EBA. In addition<br />
to monitoring the implementation of requirements directly arising<br />
from the Court’s ruling and which must be met by a set date, the<br />
EBA is also examining the ruling to determine if other measures<br />
are needed to strengthen the independence of DB Netz <strong>AG</strong>.<br />
| [1] A www.db.de/competitionreport<br />
| [3] A www.db.de/nera-e<br />
| [2] A www.dbnetze.com
| GROUP MAN<strong>AG</strong>EMENT REPORT<br />
| Business and overall conditions<br />
65<br />
Further development of relevant legal framework<br />
RECAST VERSION OF FIRST RAILWAY PACK<strong>AG</strong>E<br />
On September 17, <strong>2010</strong> the European Commission submitted a<br />
proposal for the recast of the first European railway package.<br />
The proposed new version also contains a stricter regulation of<br />
service facilities, wider authority for regulatory agencies as well<br />
as detailed requirements for infrastructure financing and trainpath<br />
usage fees. A further liberalization of the rail passenger<br />
transport sector is not foreseen. The lawmaking process is<br />
currently underway (first reading of the law) in the Council and<br />
the European Parliament. It is anticipated that the legislation<br />
will be passed during the course of 2011. We welcome the recast<br />
as it contributes towards the creation of uniform conditions for<br />
rail transport across Europe. It is, however, important to ensure<br />
that no disproportionate encroachment on the member state’s<br />
budgetary powers or the entrepreneurial independence of the<br />
train operating companies takes place.<br />
LIBERALIZATION OF RAIL PASSENGER TRANSPORT<br />
Directive 2007/58/EC obligates all EU member states to open<br />
their markets for cross-border rail passenger transport as of<br />
January 1, <strong>2010</strong>, although the terms of the Directive do, however,<br />
provide member states leeway to limit market access. On<br />
December 28, <strong>2010</strong> the EU Commission published a directive<br />
pertaining to this leeway whereby it may only be possible to<br />
limit the liberalization guidelines under very restrictive circumstances.<br />
The liberalization of the market in Germany was completed<br />
significantly earlier than the date when the directive took<br />
effect. Furthermore, the German implementation concept for<br />
Directive 2007/58/EG does not contain any possibility to restrict<br />
access to the market. Although the recast version of the first<br />
European railway package does not foresee any further steps<br />
towards liberalization, the EU Commission has, however,<br />
announced that it will submit in 2012 a legislation proposal to<br />
further liberalize rail passenger transport in Europe.<br />
REGULATION FOR A EUROPEAN RAIL FREIGHT<br />
TRANSPORT NETWORK<br />
On November 9, <strong>2010</strong> the EU regulation regarding the creation<br />
of a European rail network for more competitive freight transport<br />
took effect. Per the terms of the regulation, DB Netz <strong>AG</strong> is obligated<br />
to participate in the establishment of internationally staffed<br />
management structures in three European freight corridors within<br />
the next three to five years. The primary purpose of the regulation<br />
is to achieve better cross-border coordination of capacity<br />
and transport management as well as closer collaboration in the<br />
areas of capital expenditures and construction planning.<br />
The critical issue here is that train-path must be kept clear for<br />
international freight transports even though it cannot be assured<br />
that the track will actually be used as planned. This can lead to<br />
a substantial reduction in network capacity due to the lack of<br />
track availability for other freight or passenger transports, and<br />
cause additional costs if the track is not used. This regulation<br />
can have extensive effects on the coordination between the<br />
European infrastructure operators and the future structure of<br />
timetables in the passenger and freight transport sectors. The<br />
EU Commission is currently working on a handbook to guide the<br />
implementation of the regulation, which they would like to<br />
approve in the first quarter 2011. DB Netz <strong>AG</strong> is intensively<br />
working on ways to limit the negative effects of the regulation<br />
on operations.<br />
EU COMMISSION PREPARING TRANSPORT POLICY<br />
STRATEGY THROUGH TO 2020<br />
The EU Commission plans to submit a new White Book during<br />
the first half of 2011 wherein they define their transport policy<br />
through to the year 2020. We welcome the main points of the<br />
content that have emerged thus far. Along with the integration<br />
of transport modes and networks – including greater inclusion<br />
of rail – the main topics are climate protection, more efficient<br />
use of energy, and promoting competition by reducing regulatory,<br />
administrative and technical barriers. In addition, the<br />
Commission also addresses different financing models for the<br />
transport sector, and the internalization of external costs.<br />
NEW TRANS-EUROPEAN TRANSPORT<br />
NETWORK GUIDELINES<br />
The EU Commission has initiated a fundamentally new approach<br />
to its previous policy concerning the development of a trans-<br />
European transport network (TEN-V). Plans call for new directives<br />
to be published in the first half of 2011 wherein the TEN-V and<br />
the selection criteria for projects will be recast. The intention<br />
is to achieve better integration of all modes of transport through<br />
means such as the inclusion of intermodal interfaces (e.g. harbors,<br />
airports), new principles regarding targeted use of EU<br />
subsidies, and a stronger focus on a so-called core network,<br />
which still needs to be redefined.
66<br />
| DEUTSCHE BAHN GROUP<br />
STRUCTURING EMISSIONS TRADING AS OF 2013<br />
The amended version (RL 2009/29/EC) of Directive 2003/87/EC<br />
regarding the trading of emissions rights took effect in May<br />
2009. Per the terms of the new directive the energy industry<br />
will have to obtain all of their certificates via auction as of 2013.<br />
In addition to the current burden facing electrically powered<br />
rail transport, this complete auction process means that the cost<br />
burden arising from trading carbon dioxide (CO 2 ) emissions<br />
allowances will rise further as of 2013. This will lead to another<br />
substantial increase in the price of traction current. Other modes<br />
of transport are unaffected, or only marginally affected by<br />
CO 2 emissions trading: road transport and shipping are still<br />
not subject to CO 2 emissions trading despite the fact that they<br />
also emit CO 2 . Per the terms of Directive 2008/101 /EC, only air<br />
transport within the EU, as well as to and from Europe, will<br />
be included in CO 2 emissions trading as of 2012, however this<br />
segment will only have to obtain 15 % of its CO 2 certificates via<br />
auction.<br />
DEVELOPMENTS IN THE RELEVANT MARKETS<br />
Passenger transport<br />
GERMAN PASSENGER TRANSPORT MARKET<br />
German passenger transport market<br />
Growth rates<br />
Market share<br />
[ % based on volume sold ]<br />
<strong>2010</strong> 2009 <strong>2010</strong> 2009<br />
Rail passenger transport +2.4 –1.5 10.1 9.8<br />
DB Group +2.2 –1.6 9.4 9.2<br />
Non-Group railways + 5.0 +0.3 0.7 0.7<br />
Public road passenger transport –0.5 –1.0 9.5 9.6<br />
DB Group –0.5 +0.7 1.1 1.1<br />
Motorized individual transport 0.0 0.0 79.1 79.3<br />
Air transport (domestic) +2.2 –3.6 1.3 1.3<br />
TOTAL MARKET +0.2 –0.3 100.0 100.0<br />
Data for 2009/10 is based on information and estimates available on February 22, 2011.<br />
The total German passenger transport market recorded a slight<br />
gain in volume sold in <strong>2010</strong> thereby connecting to the robust<br />
development noted in 2009.<br />
While the rise in demand noted in the rail passenger and<br />
in domestic air transport sectors was driven by favorable overall<br />
economic conditions in Germany coupled with gains in both<br />
employment figures and disposable real income levels, the public<br />
road passenger transport segment continued its downward<br />
trend. Despite the 11 % rise in fuel prices in <strong>2010</strong> and the special<br />
boost resulting from the government’s “cash for clunkers” stimulus<br />
program in 2009, the dominant motorized individual transport<br />
sector was able to retain its previous year’s position, even<br />
though car sales were about 25 % lower. Rail was the only mode<br />
of transport to expand its intermodal share of market in <strong>2010</strong>.<br />
The rail passenger transport segment in Germany was able<br />
to post substantial gains in volume sold over the previous year’s<br />
figure. Driven by a favorable market environment, A demand<br />
noted by DB Group companies [1] rose by 2.2 % over the same<br />
year-ago period. This gain was mainly due to four factors: our<br />
offers and schedule measures were well accepted; the positive<br />
development of our international transports; the restrictions on<br />
air transport due to the outbreak of volcanic ash in the spring<br />
of <strong>2010</strong>; and the harsh winter weather experienced at the beginning<br />
and the end of the year under review.<br />
We estimate that the performance of non-Group railways<br />
rose by about 5 % due to their taking over additional lines in the<br />
regional transport segment. Their share of the rail passenger<br />
transport market in Germany rose slightly. In total, the rail passenger<br />
transport sector was able to regain the share of market<br />
it lost in <strong>2010</strong> and currently has a market share of just over 10 %.<br />
Volume sold in the public road passenger transport segment<br />
once again declined marginally and was 0.5 % below the previous<br />
year’s level. Despite lower schoolchildren and trainees traffic,<br />
demand for scheduled transport rose due in part to the shift in<br />
transport away from the S-<strong>Bahn</strong> (metro) Berlin to bus transport.<br />
Total results were, however, dampened by the decline in the<br />
non-scheduled service segment, which represents about onethird<br />
of volume sold. Volume sold by our bus companies tracked<br />
| [1] A Page 85 ff.
| GROUP MAN<strong>AG</strong>EMENT REPORT<br />
| Business and overall conditions<br />
67<br />
this overall market development. The many years of decline seen<br />
in the public road passenger transport segment led to a drop of<br />
its share of market to 9.5 %.<br />
Domestic German air transport, which was heavily hit by<br />
the economic and financial crisis in the previous year, benefited<br />
substantially from the economic recovery and recorded a sharp<br />
rise in demand despite the handicaps seen in the first third of<br />
<strong>2010</strong> (pilot strike at Lufthansa, volcanic ash clouds) and the<br />
unexpected onset of severe winter weather in December. Volume<br />
sold in <strong>2010</strong> rose by 2.2 % while market share remained at the<br />
previous year’s level.<br />
EUROPEAN PASSENGER TRANSPORT MARKET<br />
In addition to the end of government economic stimulus programs<br />
in most countries, the European passenger transport market<br />
was also affected by the tense budgetary situation in Europe.<br />
This increased pressure on the contracting organizations to cut<br />
their costs even further.<br />
In view of the different levels of liberalization within European<br />
countries, certain countries are experiencing increasing<br />
competition while, in contrast, growth is being hindered in other<br />
nations because of unchanging difficult access to their markets.<br />
The market for cross-border transports in Europe tended<br />
to develop hesitantly since it was liberalized in early <strong>2010</strong>. This<br />
is mainly due to high access barriers including high investment<br />
levels, state-sponsored protectionism, high fees to access rail<br />
networks, and technical hindrances. Based on our internal calculations,<br />
the overall rail passenger transport market in Europe<br />
in <strong>2010</strong> remained almost at the previous year’s level.<br />
The negative effects of the economic and financial crisis on<br />
the rail passenger transport market were still notably present<br />
in some European countries in <strong>2010</strong>. Volume sold by the stateowned<br />
Spanish railway, Renfe, declined again by about 3 %. The<br />
rate of unemployment in Spain hit a peak of about 20 % thereby<br />
more than doubling within three years. The situation was different<br />
in Great Britain, the third-largest rail passenger transport<br />
market in Europe after France and Germany. After volume sold<br />
in the UK almost stagnated in the previous year, they rose by a<br />
strong single-digit rate of growth during the year under review<br />
despite a sluggish increase in real incomes and a barely improved<br />
situation in the labor market.<br />
The economic situation in the Netherlands was also marked<br />
by a moderate increase in income levels and even a slight increase<br />
in unemployment compared to the same year-ago figure. Nonetheless,<br />
volume sold within the rail passenger transport sector<br />
rose, which was not lastly due to the start of service on the<br />
high-speed line from Amsterdam to Brussels via Rotterdam.<br />
Development noted in the already heavily liberalized rail<br />
markets in Denmark and Sweden posted different results. Driven<br />
in part by greater consumer spending, the Danish economy grew<br />
by about 2 %. The drop in employment slowed during the year<br />
as the unemployment rate fell slightly. Therefore the rail passenger<br />
transport sector was not able to increase its volume sold<br />
in <strong>2010</strong>, as the volume sold stayed at the level of 2009. The<br />
Swedish economy posted a broad recovery from the crisis as<br />
GDP rose by 4 % supported by strong contributions made by<br />
consumer and government spending as well as capital expenditures<br />
and foreign trade. Although the economic rebound had a<br />
favorable impact on the labor market as employment steadily<br />
increased in the second half of the year, this was not reflected<br />
in the volume sold by the rail passenger transport segment,<br />
which in fact remained below the previous year’s level in <strong>2010</strong>.<br />
This was due to numerous factors including the high number of<br />
trains that were cancelled due to severe winter weather at the<br />
start of <strong>2010</strong>.
68<br />
| DEUTSCHE BAHN GROUP<br />
Freight transport<br />
GERMAN FREIGHT TRANSPORT MARKET<br />
German freight transport market [ % based on volume sold ] Growth rates Market share<br />
<strong>2010</strong> 2009 <strong>2010</strong> 2009<br />
Rail freight transport +12.0 –17.1 17.2 16.5<br />
DB Group 1) +11.2 –20.8 12.9 12.4<br />
Non-Group railways +14.3 –3.7 4.3 4.1<br />
Road freight transport +5.4 –9.9 70.1 71.3<br />
Inland waterway transport +13.0 –13.4 10.1 9.5<br />
Long-distance pipelines +2.0 +1.8 2.6 2.7<br />
TOTAL MARKET +7.1 –11.2 100.0 100.0<br />
1) DB Schenker Rail Deutschland <strong>AG</strong> and RBH Logistics GmbH.<br />
Data for 2009/10 is based on information and estimates available on February 22, 2011.<br />
Following the collapse seen in the 2009 crisis year, the German<br />
freight transport market (rail, road, inland waterway transport<br />
and long-distance pipelines) recovered in <strong>2010</strong>. The economic<br />
rebound was accompanied by robust foreign trade figures as<br />
well as higher production volumes for crude steel and the manufacturing<br />
sector. This was offset by comparatively moderate<br />
development noted for the construction industry, which is of<br />
particular importance for the road freight transport segment.<br />
In light of these overall conditions and against the background<br />
of the different degrees of impact of the baseline effects<br />
of the previous year’s declines on performance figures it is<br />
understandable why the different modes of transport did not<br />
participate equally in the recovery. A glance at volume sold and<br />
market share shows that the development seen in the previous<br />
year has been almost completed reversed. As a result of the<br />
above-average increase of volume sold the inland waterway<br />
transport and rail freight transport were able to regain market<br />
share. In contrast, road freight transport, which had previously<br />
recorded the smallest decline in volume sold, was only able to<br />
post less-than-average development and lost the majority of the<br />
market share gains it had achieved in 2009. The market continued<br />
to be marked by high levels of intense inter- and intra-modal<br />
competition.<br />
After the rail freight transport segment had already managed<br />
to once again post a slight gain at the end of 2009, the<br />
pace of its recovery picked up notably in <strong>2010</strong>. After having seen<br />
monthly growth rates of up to 25 %, volume sold surged by nearly<br />
12 % to 107.3 billion ton kilometers (tkm). Following the 17.1 %<br />
collapse in the previous year, the level of volume sold was still<br />
a good 7 % below the pre-crisis level seen in 2008. Growth was<br />
primarily driven by the above-average development of container<br />
and Montan (coal /coke, iron ore, steel, scrap material) transports,<br />
which had fallen sharply during the crisis. Gains posted<br />
by these types of transports already represented almost 90 %<br />
of the performance increase. The combined railroad transport<br />
(CT), which had contracted by nearly 13.5 % in 2009, posted a<br />
gain of about 18 % thereby already surpassing its pre-crisis level.<br />
This development was supported by stronger foreign trade<br />
results, the recovery of important industries and the expansion<br />
of available offers. The recovery was reflected in both the<br />
maritime and continental CT sectors. While the automotive and<br />
fertilizer segments also posted notable gains, development<br />
noted for agricultural products, food and specialty food products,<br />
as well as petroleum-based products and construction materials,<br />
was weak.<br />
Following the sharp decline noted in the previous year,<br />
A volume sold by DB Group companies [1] rose by 11.2 % to<br />
80.5 billion tkm, although this was still about 12 % below the<br />
pre-crisis level.<br />
After getting off to a slow start in <strong>2010</strong> development of<br />
non-Group railways, which only posted a 3.7 % decline in 2009,<br />
also grew at an extremely dynamic rate of 14.3 %. Growth was<br />
mainly supported by a sharp expansion of container transports<br />
which represented almost half of total volume sold. Furthermore,<br />
transports of coal /coke, iron and steel, goods, which in comparison<br />
are not yet involved in high levels of intramodal competition<br />
compared to other industries, developed at an above-average<br />
rate, as well as automotive traffic. The intramodal market’s share<br />
rose to 25.1 % (previous year: 24.6 %).<br />
The rebound in the road freight transport sector (German<br />
and foreign trucks – including cabotage transports in Germany)<br />
was slightly below average in <strong>2010</strong> as volume sold increased<br />
disproportionately by about 5.4 %. On one hand, the baseline<br />
effect was not that pronounced due to the relatively minor<br />
| [1] A Page 90
| GROUP MAN<strong>AG</strong>EMENT REPORT<br />
| Business and overall conditions<br />
69<br />
decline seen in the previous year, and on the other the weatherrelated<br />
limitations noted in the construction industry in the first<br />
quarter of <strong>2010</strong> had a negative effect. The weak development<br />
seen in other industries (e.g. food and specialty foods) dampened<br />
the rise in demand. Although the previous year’s contraction in<br />
foreign trade resulted in an above-average decline in the performance<br />
of foreign trucks, which dominate cross-border transports,<br />
the situation turned around during the year under review. With<br />
a gain of about 10 % in volume sold, foreign trucks again posted<br />
significantly better growth than their German competitors. Based<br />
on the road toll (Maut) statistics compiled by the Federal Agency<br />
for Freight Transport, trucks from Southeastern Europe, in particular,<br />
were able to increase their road performance on German<br />
toll roads to far above average in some instances. This is notable<br />
because the same group had to absorb high double-digit losses<br />
in 2009. Gains in market share won by road transport, which were<br />
more than one percentage point for a total share of 71 % in the<br />
previous year, declined to 70.1 % in <strong>2010</strong>.<br />
The recovery noted for inland waterway transport at the<br />
2009/<strong>2010</strong> end of the year period came to an abrupt halt in<br />
February <strong>2010</strong> due to inclement weather conditions as performance<br />
plummeted by over 18 %. However, the situation improved<br />
again substantially as of March <strong>2010</strong> and posted unexpectedly<br />
strong development in the following months. In contrast to<br />
previous years, water levels were sufficient to permit shipping<br />
in the summer months, which, combined with the economic<br />
recovery, enabled inland waterway transport to boost its volume<br />
sold in <strong>2010</strong> by 13 %. Accordingly, the negative trend previously<br />
noted in the development of this sector’s market share was also<br />
stopped as it expanded to a little more than 10 %. Growth was<br />
driven by the sharp increase of shipments originating outside<br />
of Germany. Based on cargo categories, the strongest gains<br />
were noted for transports of iron ore, scrap material, coal and<br />
coke, as well as chemical products and containers.<br />
EUROPEAN RAIL FREIGHT TRANSPORT<br />
Following a drop of over 18 % in the previous year caused by<br />
the crisis, our current calculations foresee that volume sold in<br />
the European rail freight transport sector rose by about 8.5 %<br />
in <strong>2010</strong>, which was more than figures for land transport and<br />
less than inland waterway transport. Growth was partially<br />
driven by a strong increase in container transports, which again<br />
proved to be an engine driving growth due to the dynamic<br />
development of foreign trade in many countries. Furthermore,<br />
the recovery also lifted the iron and steel (Montan) industry<br />
which had collapsed in the previous year. The economic rebound<br />
was especially visible in steel production as important customer<br />
industries, such as the automotive industry, were able to once<br />
again expand their production notably. Most of the major<br />
European railways were even able to record double-digit gains<br />
in demand for transport services. However, one of the exceptions<br />
was the state-owned Italian railway, Trenitalia Cargo, which,<br />
despite a comparatively moderate recovery of the Italian<br />
economy, again posted substantial losses following the almost<br />
30 % plunge it recorded in the previous year. This development<br />
is, however, primarily due to the cuts made in single wagon<br />
transports.<br />
GREAT BRITAIN<br />
A change took place in the British rail freight transport market<br />
in 2009: domestic intermodal transports surpassed the historically<br />
dominant coal transports in the final quarter to become<br />
the biggest transport sector. This development continued in the<br />
first half of <strong>2010</strong>. During the second quarter of <strong>2010</strong> coal transports<br />
hit their lowest level since 2001 as gas prices remained<br />
lower than the price of coal and power plants reduced their<br />
stocks of coal. On an overall basis the coal transports were about<br />
25 % below the previous year’s level, as the transport demand<br />
remained weak in the second half of <strong>2010</strong>.<br />
Whilst transports of building materials, metals and containers<br />
recovered from the economic crisis, international transports<br />
and shipments of oil remained stable at the low level seen during<br />
the crisis. Overall demand for rail transport was also almost<br />
unchanged in comparison to the same year-ago period, thereby<br />
remaining below the pre-crisis level noted in 2008. Development<br />
of volume sold by DB Schenker Rail (UK) tracked the overall<br />
rail market.<br />
POLAND<br />
The Polish economy once again developed at an above-average<br />
rate compared to the rest of Europe in <strong>2010</strong>. Above all, production<br />
rose sharply in key industries: automotive, metals, chemicals<br />
and paper. Poland’s role as a classical exporter of coal is shifting<br />
over to being an importer. Since 2009, imports of coal exceeded<br />
exports due to the closure of coal mines. This trend continued<br />
in the year under review.<br />
Railways were able to at least slow the downwards trend<br />
seen in recent years and slightly increase their market share of<br />
the total market, which is dominated by trucks. After a 16 % drop<br />
in the Polish rail freight transport market in the previous year,<br />
which was a bit weaker than the European average, the market
70<br />
| DEUTSCHE BAHN GROUP<br />
notably improved again in <strong>2010</strong> and grew at an above-average<br />
rate of about 15 %. The rail freight transport market in Poland<br />
remains dominated by state-owned PKP Cargo. In the previous<br />
year PKP Cargo responded to the crisis by cutting prices sharply<br />
and was thus able to further expand its volume sold and leading<br />
market position during the year under review. The demand for<br />
transport service noted by DB Schenker Rail Polska, the secondstrongest<br />
railway company in the Polish rail freight transport<br />
market, also rose. However, our share of market declined slightly.<br />
FRANCE<br />
France’s foreign trade and industrial production rebounded<br />
sharply in <strong>2010</strong> as production of crude steel, which had dropped<br />
by about 28 % in the previous year, recovered strongly by about<br />
25 %. The production of cars gained by about 10 %, while car<br />
exports climbed by nearly 25 %. Total production noted for the<br />
manufacturing industry rose by about 5 %. Following the greater<br />
than 20 % collapse in the rail freight transport market’s performance<br />
in the previous year, volume sold in <strong>2010</strong> remained<br />
unchanged and therefore significantly below the European<br />
average. The main reason for this is the high number of working<br />
days that were lost to strikes. The very slow progress of liberalization<br />
also plays a decisive role and is reflected in the share<br />
of the transport market held by rail. Rail’s share of the transport<br />
market fell in the previous year and, in contrast to Germany,<br />
could not increase in <strong>2010</strong>. The share of the French rail freight<br />
transport market held by our subsidiary company, Euro Cargo<br />
Rail, remained almost unchanged.<br />
EUROPEAN LAND TRANSPORT<br />
Driven by the overall economic recovery, the European land<br />
transport market once again recorded a steady increase in<br />
demand since February <strong>2010</strong>. Due to the drop in the number of<br />
carriers and the adjustment made to the volume of shipping<br />
space that took place in the previous year, the notable reduction<br />
in available capacity led to bottlenecks in the carrier market<br />
until mid-<strong>2010</strong>. This, in turn, had substantial influence on the<br />
carriers’ prices, which also posed a further burden on freight<br />
forwarders in addition to rising costs (e.g. above-average increase<br />
in the price of diesel fuel).<br />
Due to the targeted price policy used by the freight forwarders<br />
in the previous year, the price level noted at the start of <strong>2010</strong> was<br />
relatively low and did not rise significantly over the entire year<br />
as competition remained very intense. In order to realize further<br />
cost savings, especially in the first half of <strong>2010</strong>, some frequencies<br />
were reduced in the freight forwarders’ networks.<br />
Based on revenues, which fell by almost 20 % in the depressed<br />
land transport market in the previous year, the market rebounded<br />
by about 8 % in <strong>2010</strong>. We grew at a faster rate than the market<br />
average. DB Schenker was therefore able to retain its position<br />
as the leader in the European land transport market.<br />
AIR FREIGHT<br />
The previous year’s decline of over 10 % in volume transported<br />
posed a challenge to all players in the air freight market. The<br />
collapsing market led to reductions in network capacity by air<br />
freight forwarding companies and, above all, the airlines.<br />
Numerous airplanes were taken out of service to remove surplus<br />
capacity from the market. However, these measures were not<br />
enough to avoid a sharp drop in shipping rates. A substantial<br />
stabilization in shipping volumes was once again observed<br />
since the fourth quarter of 2009. Driven by strong development<br />
in Asia, overall development of the air freight market was very<br />
favorable and also continued into <strong>2010</strong>. While routes between<br />
Asia and North America or Europe, as well as inner-Asian routes,<br />
posted strong increases in tonnage shipped, volume shipped<br />
from North America to Europe as well as the domestic air freight<br />
business within the USA posted less than average growth.<br />
On an overall basis the market gained by 20.6 % over the<br />
previous year and could surpass the pre-crisis levels. This significant<br />
recovery exceeded expectations and led to capacity bottlenecks<br />
and sharp rises in rates, especially in the first half of <strong>2010</strong>.<br />
Many of the previously decommissioned airplanes were brought<br />
back to service in order to meet heavy demand. DB Schenker<br />
Logistics also benefited from the rapid recovery. DB Schenker<br />
Logistics grew at the same pace as the market and was thus able<br />
to retain its market position and to almost reach the pre-crisis<br />
level it had attained in 2008.<br />
OCEAN FREIGHT<br />
The ocean freight market also posted very favorable development<br />
in <strong>2010</strong>. Volumes and freight rates on all trade routes<br />
recovered notably since mid-2009. This made it possible for the<br />
shipping companies to offset nearly all of the heavy losses they<br />
incurred in the previous year. This was mainly due to the shipping<br />
companies’ forward-looking capacity management measures<br />
that enabled them to push through higher rates by restricting<br />
cargo space and equipment. It is anticipated that global container<br />
volume for <strong>2010</strong> expanded by about 13 %. On key routes from<br />
Asia to Europe the increase in container volume was about 23 %,<br />
nearly 17 % from Asia to North America, and about 7 % on inner-<br />
Asian transport.
| GROUP MAN<strong>AG</strong>EMENT REPORT<br />
| Business and overall conditions<br />
71<br />
The approximately 16 % increase in volume over the previous<br />
year posted by DB Schenker Logistics in <strong>2010</strong> was once again<br />
substantially stronger than the figure recorded for the total<br />
market. DB Schenker Logistics thereby asserted its market position.<br />
Both the total market as well as DB Schenker Logistics have<br />
already surpassed their pre-crisis levels seen in 2008.<br />
CONTRACT LOGISTICS<br />
After the market for Contract Logistics/Supply Chain Management<br />
(SCM) declined in the previous year based on revenues by<br />
about 5.4 % due to the global recession, strong growth was once<br />
again achieved in the year under review.<br />
The contract logistics market is thus more resistant than the<br />
transport markets due to its longer-term contractual relationships<br />
and the outsourcing rate, which is still increasing. During the year<br />
under review, capacity utilization continued to rise, and good<br />
order volumes were seen both domestically and internationally.<br />
Production volumes for all of the core industries at DB Schenker<br />
Logistics (automotive, consumer and electronics) were significantly<br />
higher than in the previous year.<br />
Favorable development was noted in all of the key countries<br />
and regions, especially in the emerging markets. With revenue<br />
growth of 14 %, DB Schenker Logistics developed much more<br />
strongly overall than the total market, which grew by about 6 %<br />
and was thus able to maintain its market position.<br />
Rail infrastructure in Germany<br />
Selected key figures<br />
<strong>2010</strong> 2009 Change<br />
DB rail infrastructure in Germany<br />
absolute %<br />
Train operating companies 370 353 + 17 + 4.8<br />
DB Group 30 30 – –<br />
Non-Group railways 340 323 + 17 + 5.3<br />
Train-path demand (million train-path km) 1,033.5 1,002.6 + 30.9 + 3.1<br />
DB Group 838.1 832.2 + 5.9 + 0.7<br />
Non-Group railways 195.4 170.4 +25.0 +14.7<br />
Share of non-Group railways 18.9 17.0 – –<br />
Station stops (million) 143.9 143.3 + 0.6 + 0.4<br />
DB Group 121.9 123.3 –1.4 –1.1<br />
Non-Group railways 22.0 20.0 +2.0 + 10.0<br />
Against the background of the open access to the market that<br />
has been in effect since 1994, a large number of train operating<br />
companies (TOC) use our rail infrastructure in Germany. In<br />
comparison to the previous year, the number of non-Group TOCs<br />
has continued to grow. No other country in the EU has a rail<br />
transport market that is more competitive than Germany’s.<br />
In <strong>2010</strong>, track demand increased by a total of about 3 % in<br />
comparison with the previous year due to the strong recovery<br />
in rail freight transport and a slight increase in rail passenger<br />
transport. The proportion of non-Group railways continued to<br />
rise during the year under review.<br />
The number of station stops was also slightly higher than the<br />
previous year’s level.<br />
Due to the competitive situation facing goods and services<br />
offered in train stations vis-à-vis offers available in the total<br />
retail trade market, the development of revenues generated by<br />
retail trade and food stores is also significant for our train stations,<br />
since the rental possibilities and the resulting revenues<br />
both depend on the earnings situation of our commercial space<br />
tenants. Total real retail trade revenues in Germany increased<br />
by about 1 % during the year under review. At the same time,<br />
rental income recorded by our stations also rose during the year<br />
under review.
72<br />
| DEUTSCHE BAHN GROUP<br />
Business performance<br />
a Revenues rise sharply by about 17% to € 34.4 billion (11% comparable basis)<br />
a Adjusted EBIT improves to € 1.9 billion<br />
a Inclusion of DB Arriva has considerable impact<br />
MAJOR CHANGES IN YEAR-ON-YEAR COMPARISON<br />
The development of expenses and income was also influenced<br />
by changes made to the scope of consolidation during the year<br />
under review. Detailed information to the A changes in the<br />
Group [1] are contained in the Notes section.<br />
The following changes are relevant for comparative purposes<br />
at business unit level and are explained to the extent required<br />
in the following statements:<br />
a DB Schenker Rail Polska, a Polish company, has been included<br />
in the consolidated financial statements since<br />
August 1, 2009 and is carried under the DB Schenker Rail<br />
business unit.<br />
a The British company A Arriva [2] has been included in the<br />
consolidated financial statements since September 1, <strong>2010</strong><br />
(with the exception of Arriva Germany) and is carried under<br />
the newly established A DB Arriva business unit [3].<br />
a An organizational change necessitated an adjustment in the<br />
previous year’s figures for the DB <strong>Bahn</strong> Regional and DB<br />
<strong>Bahn</strong> Urban business units. The Berlin and Hamburg S-<strong>Bahn</strong>s<br />
(metros) were transferred to the DB <strong>Bahn</strong> Regional business<br />
unit effective January 1, <strong>2010</strong>. They had been previously<br />
carried under the DB <strong>Bahn</strong> Urban business unit where they<br />
had formed the S-<strong>Bahn</strong> division. The previous year’s figures<br />
were adjusted accordingly.<br />
DEVELOPMENT OF REVENUES<br />
Revenues [ € million ] <strong>2010</strong> 2009 Change<br />
absolute %<br />
DB Group 34,410 29,335 + 5,075 +17.3<br />
Effects from changes in the scope of consolidation – 1,286 – –1,286 –<br />
Effects from changes in exchange rates – 668 – –668 –<br />
DB GROUP — COMPARABLE 32,456 29,335 3,121 + 10.6<br />
Group revenues grew again significantly during the year under<br />
review in comparison to the same year-ago figure. This change<br />
was primarily driven by the substantial economic recovery and<br />
the subsequent revival of our relevant A transport and logistics<br />
markets [4]. These results were flanked by favorable results<br />
noted for the passenger transport segment, especially because<br />
of higher volume sold, and by our infrastructure business due<br />
to the return of a notable increase in demand in the rail freight<br />
transport segment.<br />
Effects arising from major acquisitions were generated by<br />
Arriva with € 1,046 million and DB Schenker Rail Polska with<br />
€ 129 million. Adjusted for these effects the revenue growth<br />
posted was 12.9 %.<br />
Furthermore, we recorded favorable exchange rate effects of<br />
€ 668 million, which were mainly generated by the DB Schenker<br />
Logistics business unit.<br />
REVENUES [ € billion ]<br />
<strong>2010</strong> 34.4<br />
2009 29.3<br />
2008 33.5<br />
Adjusted for the effects of exchange rate changes and changes<br />
in the scope of consolidation, our revenues grew by 10.6 %.<br />
| [1] A Page 155 ff. | [2] A Page 60<br />
| [3] A Page 88<br />
| [4] A Page 70 f.
| GROUP MAN<strong>AG</strong>EMENT REPORT<br />
| Business performance<br />
73<br />
Total revenues by business unit [ € million ] <strong>2010</strong> 2009 Change<br />
absolute %<br />
DB <strong>Bahn</strong> Long-Distance 3,729 3,565 + 164 + 4.6<br />
DB <strong>Bahn</strong> Regional 7,559 7,587 – 28 – 0.4<br />
DB <strong>Bahn</strong> Urban 1,272 1,252 +20 +1.6<br />
DB Schenker Rail 4,584 4,055 + 529 +13.0<br />
DB Schenker Logistics 14,310 11,292 +3,018 +26.7<br />
DB Services 1,274 1,237 + 37 + 3.0<br />
DB Netze Track 4,580 4,369 +211 + 4.8<br />
DB Netze Stations 1,044 1,025 +19 +1.9<br />
DB Netze Energy 2,501 2,308 + 193 + 8.4<br />
Other 864 796 + 68 + 8.5<br />
Consolidation –8,353 –8,151 –202 +2.5<br />
DB GROUP (EXCLUDING ARRIVA) 33,364 29,335 + 4,029 + 13.7<br />
DB Arriva 1,046 – +1,046 –<br />
DB GROUP 34,410 29,335 + 5,075 + 17.3<br />
thereof concession fees (rail) 4,370 4,489 –119 –2.7<br />
Revenues developed favorably in almost all of the business units.<br />
Gains were recorded in all business units with the exception of<br />
DB <strong>Bahn</strong> Regional.<br />
The DB <strong>Bahn</strong> Long-Distance business unit posted notably<br />
higher total revenues due to higher volume sold as well as price<br />
measures.<br />
Total revenues posted by the DB <strong>Bahn</strong> Regional business<br />
unit declined slightly as the unit was unable to fully compensate<br />
for declining concession fees arising from lower volume sold<br />
stemming from tenders lost in the previous year in Germany,<br />
and reductions in services offered by the S-<strong>Bahn</strong> (metro) Berlin.<br />
Despite lower passenger numbers, revenues earned by the<br />
DB <strong>Bahn</strong> Urban business unit rose slightly due, in particular, to<br />
higher substitute transports.<br />
As a result of the economic recovery and the related gains<br />
in volume sold, the sharpest increases in total revenues were<br />
posted by the DB Schenker Logistics and DB Schenker Rail business<br />
units following notable declines seen in the previous year.<br />
Revenues developed favorably in all business units within<br />
our Infrastructure division.<br />
Total revenues posted by the DB Netze Track business unit rose<br />
due to greater demand for track as well as pricing measures.<br />
Total revenues recorded by the DB Netze Stations business<br />
unit increased as a result of pricing measures and higher rental<br />
income.<br />
Revenues noted for the DB Netze Energy business unit were<br />
favorably influenced by stronger sales of energy services and<br />
traction current.<br />
Detailed information about the performance of the individual<br />
business units may be found in the chapter A Development<br />
of business units [1].<br />
Based on a breakdown of external revenues by business<br />
units, business units in the Passenger Transport division saw<br />
their share decline from 42 to 39 %. The percentage held by the<br />
DB <strong>Bahn</strong> Long-Distance business unit fell from 12 to 10 %, while<br />
DB <strong>Bahn</strong> Regional saw its share contract from 26 to 22 %. The DB<br />
<strong>Bahn</strong> Urban business unit retained its 4 % share of total revenues,<br />
while the new DB Arriva business unit posted a 3 % share for the<br />
year under review based on its less-than-one-year inclusion. In<br />
contrast, the share held by the DB Schenker Logistics business<br />
unit rose from 38 to 41 %, while DB Schenker Rail’s share remained<br />
unchanged at 13 %. DB Schenker Logistics retained its position<br />
as the primary revenue driver followed by DB <strong>Bahn</strong> Regional.<br />
| [1] A Page 83 ff.
74<br />
| DEUTSCHE BAHN GROUP<br />
External revenues by region [ € million ] <strong>2010</strong> 2009 Change<br />
absolute %<br />
Germany 21,393 19,930 +1,463 +7.3<br />
Europe (excluding Germany) 8,664 6,245 +2,419 + 38.7<br />
North America 2,099 1,472 + 627 + 42.6<br />
Asia /Pacific 1,780 1,371 + 409 +29.8<br />
Rest of world 474 317 +157 + 49.5<br />
DB GROUP 34,410 29,335 + 5,075 + 17.3<br />
The effects of the global economic recovery noted in <strong>2010</strong> were<br />
also visible in the regional breakdown of revenues and led to<br />
increased revenues in all regions. This development was flanked<br />
by the first-time inclusion of Arriva which impacted on results in<br />
the rest of Europe. Revenues generated in Germany climbed by<br />
7.3 %, but not as strongly as in the other regions due to the comparatively<br />
stable development noted for the passenger transport<br />
and infrastructure business units.<br />
The share of revenues generated outside of Germany rose<br />
accordingly from 32 % in the previous year to 38 % during the<br />
year under review.<br />
EXTERNAL REVENUES STRUCTURE <strong>2010</strong><br />
By region [%] By division [%] By business unit<br />
<strong>2010</strong> 2009<br />
[%]<br />
39<br />
DB <strong>Bahn</strong> Long-Distance 10 12<br />
62<br />
DB <strong>Bahn</strong> Regional 22 26<br />
DB <strong>Bahn</strong> Urban 4 4<br />
DB Arriva 3 –<br />
54<br />
DB Schenker Rail 13 13<br />
2<br />
1<br />
5 6<br />
25<br />
6<br />
DB Schenker Logistics 41 38<br />
DB Services 0 0<br />
Germany<br />
Passenger Transport<br />
DB Netze Track 3 3<br />
Europe (excluding Germany)<br />
Asia /Pacific<br />
Transport and Logistics<br />
Infrastructure<br />
DB Netze Stations 1 1<br />
North America<br />
Other<br />
DB Netze Energy 2 2<br />
Rest of world<br />
Other 1 2
| GROUP MAN<strong>AG</strong>EMENT REPORT<br />
| Business performance<br />
75<br />
DEVELOPMENT OF PROFITS<br />
2009 Change<br />
Excerpt from adjusted statement of income [ € million ] <strong>2010</strong> thereof further<br />
adjustments 1) absolute %<br />
Revenues 34,410 1,954 29,335 + 5,075 +17.3<br />
Inventory changes and internally produced<br />
and capitalized assets 2,207 0 1,936 +271 +14.0<br />
Other operating income 2,636 78 2,327 + 309 + 13.3<br />
TOTAL INCOME 39,253 2,032 33,598 + 5,655 + 16.8<br />
Cost of materials –19,134 –977 –15,295 –3,839 +25.1<br />
Personnel expenses –11,583 –616 –10,648 – 935 + 8.8<br />
Other operating expenses –3,885 –279 –3,253 – 632 +19.4<br />
EBITDA ADJUSTED 4,651 160 4,402 +249 +5.7<br />
Adjusted EBITDA margin 13.5 % – 15.0 % – –<br />
Depreciation –2,785 –106 –2,717 – 68 +2.5<br />
EBIT ADJUSTED 1,866 54 1,685 + 181 + 10.7<br />
Adjusted EBIT margin 5.4 % – 5.7 % – –<br />
1)<br />
Adjustments of effects from changes in the scope of consolidation and changes in exchange rates.<br />
Total income rose significantly by about 17 %, or € 5,655 million,<br />
and was driven by the favorable development of revenues along<br />
with higher results from other operating income.<br />
Effects from changes in exchange rates and the scope of<br />
consolidation resulted in higher revenues as well as almost equal<br />
increases in the individual expense items.<br />
The cost of materials recorded for the year under review<br />
was notably higher than in the previous year. The change was<br />
driven by higher intermediate inputs made by the DB Schenker<br />
Logistics business unit due to higher prices and volumes, as<br />
well as higher maintenance costs (due to reasons including<br />
the severe winter weather experienced at the start and the end<br />
of the year under review). Furthermore, higher maintenance<br />
costs for vehicles were incurred by the DB <strong>Bahn</strong> Long-Distance,<br />
DB <strong>Bahn</strong> Regional (especially for the S-<strong>Bahn</strong> (metro) Berlin)<br />
and DB Schenker Rail (especially for the reactivation of freight<br />
cars) business units. The percentage increase in the cost of<br />
materials was greater than the gain noted for income.<br />
Personnel expenses were 8.8 % higher than the same yearago<br />
figure. The increase was particularly influenced by effects<br />
stemming from changes in the scope of consolidation, wage<br />
increases and higher numbers of employees, especially in the<br />
DB <strong>Bahn</strong> Long-Distance and DB Schenker Logistics business units.<br />
Other operating expenses rose at a less than proportionate<br />
rate compared to the rate noted for income growth. This was<br />
notably influenced by effects related to changes in the scope of<br />
consolidation along with the increase of other services purchased.<br />
In total the development of the adjusted EBITDA figure for the<br />
year under review was favorable (a gain of 5.7 % to € 4,651 million).<br />
Depreciation was slightly higher than the same year-ago figure<br />
due to effects stemming from the changes in the scope of consolidation.<br />
The adjusted EBIT figure also improved during the year under<br />
review (+10.7 % to € 1,866 million).<br />
The adjusted EBITDA and EBIT margins declined slightly<br />
during the year under review. This was primarily due to the strong<br />
increase in revenues posted by the DB Schenker Logistics business<br />
unit, where, in comparison to the more capital-intensive activ i ties<br />
of the other business units, lower margins were recorded.<br />
Special items [ € million ] <strong>2010</strong><br />
Release of personnel-related provisions 140<br />
Provisions for technology-related risks raised –141<br />
Revaluation of property-related risks –40<br />
Other –8<br />
TOTAL –49<br />
In contrast to the previous year the development of the EBIT<br />
figure during the year under review was barely influenced by<br />
special items. Total special items had a slightly negative<br />
(€ – 49 million) effect compared to the previous year when they<br />
were a significantly favorable € + 523 million. Special items posted<br />
during the year under review primarily involved the release of<br />
provisions made, or adjustments for personnel-related measures,<br />
or technology-related risks in the areas of vehicles and rail infrastructure,<br />
as well as risks arising from the valuation of properties.
76<br />
| DEUTSCHE BAHN GROUP<br />
Special items [ € million ] 2009<br />
Property sales, Stuttgart 21 639<br />
New evaluation of risks arising from<br />
legacy ecological burdens 600<br />
Technical risks – 331<br />
Restructuring and personnel<br />
adjustment measures – 450<br />
Other 65<br />
TOTAL 523<br />
Special items recorded in the previous year resulted primarily<br />
from the conclusion of the financing agreement for the Stuttgart<br />
21 project and the resulting realization of income from the sale<br />
of properties in previous years as well as the reevaluation of<br />
risks for ecological legacy contamination and claims for restitution.<br />
These were offset by charges due to restructuring and<br />
personnel adjustment measures, as well as obligations to<br />
eliminate technical problems that occurred in the areas of<br />
vehicles and the infrastructure.<br />
Excerpt from statement of income [ € million ] <strong>2010</strong> 2009 Changes<br />
absolute %<br />
Revenues 34,410 29,335 + 5,075 +17.3<br />
Inventory changes and internally produced and capitalized assets 2,207 1,936 +271 +14.0<br />
Other operating income 3,120 3,864 –744 –19.3<br />
TOTAL INCOME 39,737 35,135 + 4,602 + 13.1<br />
Cost of materials –19,314 –15,627 –3,687 +23.6<br />
Personnel expenses –11,602 –11,115 – 487 + 4.4<br />
Depreciation –2,912 –2,825 –87 +3.1<br />
Other operating expenses –4,092 –3,360 –732 +21.8<br />
TOTAL EXPENSES –37,920 – 32,927 – 4,993 +15.2<br />
EBIT 1,817 2,208 –391 –17.7<br />
Financial result –917 –821 –96 +11.7<br />
PROFIT BEFORE TAXES ON INCOME 900 1,387 – 487 –35.1<br />
Taxes on income 158 –557 +715 –<br />
NET PROFIT 1,058 830 +228 +27.5<br />
Due to the immaterial change in the net sum of special items,<br />
the development of the unadjusted results was influenced by<br />
the same drivers as the adjusted results.<br />
In comparison with the same year-ago period special items<br />
had an effect on other operating income as the unadjusted<br />
development of this item was negative during the year under<br />
review. These results reflect income from the one-time effects<br />
of releasing provisions in the previous year.<br />
Accordingly, the development of the unadjusted key EBITDA<br />
and EBIT figures is notably different: both figures deteriorated<br />
unadjusted stronger than adjusted due to the reduction of<br />
income. As a result, EBIT fell by 17.7 % to € 1,817 million.<br />
The development of the EBIT figure also affected profits<br />
before taxes on income, which declined by about 35.1 % to<br />
€ 900 million.<br />
In comparison to the previous year taxes on income improved<br />
during the year under review by about € 715 million because<br />
of a significant deferred tax asset due to better expectations<br />
following the overall economic recovery. Net profit for the year<br />
rose by € 228 million to € 1,058 million.<br />
Net results attributable to minority interests was € 19<br />
million (previous year: € 9 million). Thus, in total the described<br />
development resulted in a significantly higher net profit for<br />
the year to shareholders of DB <strong>AG</strong> of € 1,039 million (previous<br />
year: € 821 million). This led to an increase in earnings per share<br />
to € 2.42 for the year under review (previous year: € 1.91).
| GROUP MAN<strong>AG</strong>EMENT REPORT<br />
| Business performance<br />
77<br />
Operating income by business units<br />
EBITDA adjusted by business unit [ € million ] <strong>2010</strong> 2009 Change<br />
absolute %<br />
DB <strong>Bahn</strong> Long-Distance 481 504 –23 – 4.6<br />
DB <strong>Bahn</strong> Regional 1,229 1,407 –178 –12.7<br />
DB <strong>Bahn</strong> Urban 132 146 –14 – 9.6<br />
DB Schenker Rail 302 107 +195 –<br />
DB Schenker Logistics 478 371 +107 +28.8<br />
DB Services 287 297 –10 –3.4<br />
DB Netze Track 1,524 1,472 + 52 + 3.5<br />
DB Netze Stations 343 342 +1 + 0.3<br />
DB Netze Energy 165 182 –17 – 9.3<br />
Other/Consolidation –422 –426 +4 –0.9<br />
DB GROUP (EXCLUDING DB ARRIVA) 4,519 4,402 +117 +2.7<br />
DB Arriva 132 – +132 –<br />
DB GROUP 4,651 4,402 +249 + 5.7<br />
EBIT adjusted by business unit [ € million ] <strong>2010</strong> 2009 Change<br />
absolute %<br />
DB <strong>Bahn</strong> Long-Distance 117 141 –24 –17.0<br />
DB <strong>Bahn</strong> Regional 729 899 –170 –18.9<br />
DB <strong>Bahn</strong> Urban 62 71 – 9 –12.7<br />
DB Schenker Rail 12 –189 +201 –<br />
DB Schenker Logistics 304 199 + 105 + 52.8<br />
DB Services 129 125 + 4 +3.2<br />
DB Netze Track 601 558 + 43 +7.7<br />
DB Netze Stations 217 217 – –<br />
DB Netze Energy 82 103 –21 –20.4<br />
Other/Consolidation –442 –439 –3 +0.7<br />
DB GROUP (EXCLUDING DB ARRIVA) 1,811 1,685 +126 +7.5<br />
DB Arriva 55 – +55 –<br />
DB GROUP 1,866 1,685 + 181 + 10.7<br />
In comparison to the same year-ago period the development of<br />
adjusted results differed at the business unit level. Gains in the<br />
adjusted EBITDA and adjusted EBIT figures were recorded for<br />
the DB Schenker Rail, DB Schenker Logistics and DB Netze Track<br />
business units. In contrast, adjusted results posted by the passenger<br />
transport business units were weaker. Results in the Infrastructure<br />
business units were mixed.<br />
Stronger earnings driven by higher volume sold in the DB<br />
<strong>Bahn</strong> Long-Distance business unit were countervailed by additional<br />
charges on the expense side including higher maintenance<br />
costs and rental fees for vehicles. This led to a decline in total<br />
adjusted results.<br />
The DB <strong>Bahn</strong> Regional business unit was considerably burdened<br />
to a major extent by limitations in service noted at the S-<strong>Bahn</strong><br />
(metro) Berlin and reduced revenues due to lost volume sold in<br />
Germany.<br />
Higher personnel expenses and contractor fees had a negative<br />
effect on results posted by the DB <strong>Bahn</strong> Urban business<br />
unit. In total, these events led to a notably reduced development<br />
of adjusted results.
78<br />
| DEUTSCHE BAHN GROUP<br />
The adjusted results of the DB Schenker Rail and DB Schenker<br />
Logistics business units rose significantly due to the strong<br />
increase in revenues driven by the economic recovery. During<br />
the year under review the DB Schenker Rail business unit was<br />
able to once again record a slightly favorable adjusted EBIT figure.<br />
The DB Services business unit improved its adjusted EBIT<br />
due mainly to higher levels of maintenance services provided.<br />
Despite extensive winter services and higher maintenance<br />
costs, adjusted earnings posted by DB Netze Track business unit<br />
rose due to higher train-path revenues and additional revenues<br />
earned by the construction firms. While adjusted results recorded<br />
for the DB Netze Stations business unit were similar to the previous<br />
year’s figures, they were lower at the DB Netze Energy business<br />
unit for reasons including higher prices paid to procure energy.<br />
The item Other/consolidation showed adjusted results at<br />
the same year-ago level.<br />
Detailed information about the performance of the individual<br />
business units may be found in the chapter A Development<br />
of business units [1].<br />
VALUE MAN<strong>AG</strong>EMENT<br />
on the figures of the balance sheet and the adjusted statement<br />
of income. The appropriateness of results can be only judged in<br />
context of the assets that need to be financed and the cost of<br />
capital. The key goal here, in particular, is to ensure that the<br />
company’s ability to invest in its core business is secured on a<br />
sustainable basis.<br />
Our value-oriented controlling concept is anchored in a key<br />
metrics system consisting of operating value drivers and company-specific<br />
influencing factors. The purpose of the operating<br />
value drivers is to control our market activities using key volume<br />
and price figures that are critical for our success and the efficiency<br />
of our production process as measured by key capacity utilization<br />
figures. The definition varies by business unit. The scope<br />
and level of details used are based on individual requirements.<br />
Volume and price drivers primarily affect the adjusted EBIT figure<br />
as the key metric at the core of our value management concept.<br />
Company-specific influencing factors and indicators are employed<br />
as underlying metrics in order to manage the company on an<br />
anticipatory and controllable value-oriented basis. Capacity<br />
utilization serves as the metric used to optimize the cost and<br />
capital efficiency of the business units. Our goal here is to obtain<br />
the best possible use of capital employed.<br />
We use return on capital employed (ROCE) targets to<br />
manage the DB Group and the individual business units, taking<br />
the nature and risk of each operating business into consideration.<br />
We measure the performance of our business activities against<br />
the ROCE. Furthermore, we also use these targets as a basis for<br />
planning purposes and our capital expenditure programs.<br />
To enable better comparability of accounting periods we<br />
use EBIT that has been adjusted for special items incurred during<br />
the financial year to calculate our ROCE. Capital employed represents<br />
the interest-bearing operational capital carried on the<br />
balance sheet that DB Group needs to sustain.<br />
ROCE [ € million or % ] <strong>2010</strong><br />
<strong>2010</strong><br />
2009 Change<br />
effective excl. DB Arriva<br />
absolute %<br />
EBIT adjusted 1,866 1,811 1,685 +126 +7.5<br />
÷ Capital employed as of December 31 31,312 28,236 28,596 –360 –1.3<br />
ROCE 6.0 % 6.4 % 5.9 % – –<br />
During the year under review the ROCE figure rose by 0.1 percentage<br />
points reflecting the almost equal increase in the A adjusted<br />
EBIT figure<br />
[2] and capital employed. The increase in capital<br />
employed is primarily due to the complete inclusion of capital<br />
employed from Arriva as of December 31, <strong>2010</strong>. In contrast, the<br />
adjusted EBIT figure for the year only partially reflects the favorable<br />
results of Arriva during the year under review because Arriva<br />
was only included in the scope of consolidation since September<br />
1, <strong>2010</strong>. Excluding DB Arriva the ROCE increased to 6.4 %.<br />
ROCE [%]<br />
<strong>2010</strong> 6.0<br />
2009 5.9<br />
2008 8.9<br />
| [1] A Page 83 ff.<br />
| [2] A Page 75 ff.
| GROUP MAN<strong>AG</strong>EMENT REPORT<br />
| Business performance<br />
79<br />
Derivation of capital employed from the balance sheet<br />
[ € million ]<br />
BASED ON ASSETS<br />
<strong>2010</strong> <strong>2010</strong><br />
excl. DB Arriva<br />
2009 Change<br />
absolute %<br />
Property, plant and equipment /intangible assets 42,027 38,628 39,509 – 881 –2.2<br />
+ Inventories 916 877 814 + 63 +7.7<br />
+ Trade receivables 3,877 3,657 3,030 + 627 +20.7<br />
+ Receivables and other assets 1,171 763 689 +74 +10.7<br />
– Receivables from financing –139 –76 –29 –47 –<br />
+ Income tax receivables 99 98 150 – 52 –34.7<br />
– Trade liabilities –4,286 –3,942 –3,267 –675 +20.7<br />
– Other liabilities –3,436 –3,162 –3,183 +21 –0.7<br />
– Income tax liabilities –146 –91 –60 –31 +51.7<br />
– Other provisions –6,256 –6,062 – 6,419 + 357 – 5.6<br />
– Deferred income –2,515 –2,454 –2,638 +184 –7.0<br />
CAPITAL EMPLOYED 31,312 28,236 28,596 – 360 –1.3<br />
As a minimum, the ROCE target is set at the level of the weighted<br />
average cost of capital (WACC) before taxes. The cost of capital<br />
is derived in conformity with capital market conditions taking<br />
the sustainable nature of our control concept into consideration.<br />
We estimate DB Group’s long-term cost of capital to be 9.6 %<br />
before taxes based on the mid-term target capital structure.<br />
DB Group’s long-term ROCE target was set at 10.0 %.<br />
Cost of capital [%] Equity Net financial<br />
debt<br />
Retirement benefit<br />
obligations<br />
Risk-free interest rate 1) 3.5 3.5 3.5<br />
Market risk premium 5.0 – –<br />
x Beta factor 1.1 – –<br />
+ Risk surcharge 2) 5.7 0.9 0.9<br />
Cost of capital after taxes 9.2 4.4 4.4<br />
x Tax factor 3) 1.44 1.03 1.00<br />
Cost of capital before taxes 13.2 4.5 4.4<br />
Weighting 59 37 4<br />
Cost of capital before taxes (WACC) 9.6<br />
1)<br />
Based on the yield trend of ten-year bunds taking into consideration the long-term orientation of the cost of capital concept.<br />
2)<br />
Risk premium for net financial debt and retirement benefit obligations based on current spreads for new issues of benchmark bonds issued by DB Group<br />
compared to bunds with comparable terms to maturity; adjustment for corresponding terms with risk-free investments based on internal calculations.<br />
3)<br />
Based on a total taxation rate of 30.5 %; the tax factor for net financial debt reflects the trade tax (Gewerbesteuer) on the attributable financing costs.<br />
Remaining taxes are assigned to the cost of equity.<br />
Target values [%] DB Group DB ML Group Infrastructure<br />
Cost of capital before taxes 9.6 10.2 8.0<br />
Minimum target return 10.0 14.0 8.0
80<br />
| DEUTSCHE BAHN GROUP<br />
The purpose of the ROCE concept is to secure the Group’s financing<br />
ability. This is primarily determined by the required amount of<br />
capital expenditures and repayment of outstanding debt.<br />
The ROCE goal was not achieved during the year under review.<br />
The deviation from the target value was 4.0 percentage points<br />
(excluding Arriva: 3.6 percentage points).<br />
Controlling debt<br />
The key figures for controlling the level of debt are redemption<br />
coverage (ratio of operating cash flow to adjusted net financial<br />
debt, i.e. including present value of liabilities from operating<br />
leases), gearing (the ratio of net financial debt to equity) and<br />
net financial debt /EBITDA (ratio of net financial debt to adjusted<br />
EBITDA).<br />
We strive for a level of debt commensurate with our good credit<br />
ratings. As in the previous year, our mid-term goal for redemption<br />
coverage is 30 %. Our target for gearing remains unchanged<br />
at an equity to net debt ratio of 1:1. The mid-term target for the<br />
net financial debt /EBITDA ratio is 2.5.<br />
2009 Change<br />
[ € million ] <strong>2010</strong> <strong>2010</strong><br />
excl. DB Arriva 3) absolute %<br />
EBIT adjusted 1,866 1,811 1,685 +126 +7.5<br />
+ Net operating interest 1), 2) –752 –735 –689 –46 +6.7<br />
+ Depreciation 2) 2,785 2,708 2,717 – 9 – 0.3<br />
OPERATING CASH FLOW 3,899 3,784 3,713 +71 +1.9<br />
Net financial debt 16,939 13,966 15,011 –1,045 –7.0<br />
+ Present value of operating leases 4,610 3,876 4,105 –229 – 5.6<br />
÷ ADJUSTED NET FINANCIAL DEBT 21,549 17,842 19,116 –1,274 – 6.7<br />
REDEMPTION COVER<strong>AG</strong>E 18.1 % 21.2 % 19.4 % – –<br />
Financial debt 18,553 15,290 16,510 –1,220 –7.4<br />
– Cash and cash equivalents and receivables from financing 1,614 1,324 1,499 –175 –11.7<br />
NET FINANCIAL DEBT 16,939 13,966 15,011 – 1,045 –7.0<br />
÷ Equity 14,316 14,262 13,066 +1,196 +9.2<br />
GEARING 118 % 98 % 115 % – –<br />
Net financial debt 16,939 13,966 15,011 –1,045 –7.0<br />
÷ EBITDA adjusted 4,651 4,519 4,402 + 117 +2.7<br />
NET FINANCIAL DEBT/EBITDA 3.6 3.1 3.4 – –<br />
1)<br />
To properly determine redemption coverage we utilize net operating interest by eliminating those components of net interest income/expense related to<br />
the compounding of non-current liabilities and provisions and the reversal of deferred income.<br />
2)<br />
Adjusted for special items.<br />
3)<br />
Excluding financing of acquisition of Arriva.<br />
REDEMPTION COVER<strong>AG</strong>E [%]<br />
<strong>2010</strong> 18.1<br />
2009 19.4<br />
2008 22.5<br />
GEARING [%]<br />
<strong>2010</strong> 118<br />
2009 115<br />
2008 131
| GROUP MAN<strong>AG</strong>EMENT REPORT<br />
| Business performance<br />
81<br />
Redemption coverage was below the same year-ago figure as of<br />
December 31, <strong>2010</strong>. The change was due to the acquisition-related<br />
increase in net financial debt, which was fully reflected at<br />
December 31, <strong>2010</strong> while the operating cash flow generated by<br />
Arriva was only taken into consideration on a proportionate<br />
basis from September 1, <strong>2010</strong> onwards. Furthermore, the present<br />
value of operating leases increased sharply. This change is due<br />
in part to the fact that Arriva pays firmly contracted fees for<br />
train-path usage that are carried as operating leases. Excluding<br />
Arriva the redemption coverage figure rose to 21.2 %.<br />
Gearing deteriorated during the year under review as<br />
increased net financial debt could only be offset by an increase<br />
in equity capital. Excluding DB Arriva, gearing improved to 98 %.<br />
The metric net financial debt /EBITDA deteriorated. This<br />
change is also due to the acquisition-related increase in net<br />
financial debt, which was fully reflected in the figure at<br />
December 31, <strong>2010</strong>, while the adjusted EBITDA could only be<br />
partially reflected as of September 1, <strong>2010</strong>. Excluding Arriva<br />
the metric improved to 3.1.<br />
Volume, price and capacity utilization<br />
as operating value drivers<br />
The metrics we use to control the DB <strong>Bahn</strong> Long-Distance business<br />
unit are the volume sold and the specific rate of revenues;<br />
additional important value drivers used by the DB <strong>Bahn</strong> Regional<br />
and DB Arriva business units are volume produced and concession<br />
fees. We generally use the load factor, specific cost rates,<br />
as well as function and facility-related productivity and usage<br />
levels to measure cost and capital efficiency. The macroeconomic<br />
factors influencing the key value drivers within the passenger<br />
transport segment are the number of persons employed in<br />
Germany and disposable income.<br />
The metrics used to determine if price and volume targets<br />
are being met in the DB Schenker Rail business unit are, again,<br />
volume sold and the specific rate of revenues. We use capacity<br />
utilization (tons per train), the empty car ratio, specific cost<br />
rates, productivity, the capacity utilization ratio and frequency<br />
of operation of resources involved in the production process<br />
to control cost and capital efficiency in this unit. The key macroeconomic<br />
factors here are the production levels noted for<br />
crude steel and the manufacturing industry, as well as imports<br />
and exports.<br />
Control metrics used for the DB Schenker Logistics business<br />
unit are gross profit margin and the operating value driver of<br />
volume shipped in the air and ocean freight segments measured<br />
in tons or TEU. We also use the volume of shipments in the<br />
European land transport sector as an additional metric. The<br />
underlying macroeconomic factors influencing the DB Schenker<br />
Logistics business unit are the individual regional GDP growth<br />
figures, as well as global trade.<br />
The operating value drivers volume produced and station<br />
stops are used to control the DB Netze Track and DB Netze<br />
Stations business units. The development of these value drivers<br />
is indirectly affected by factors influencing rail passenger and<br />
freight transport sectors.<br />
Development of orders<br />
Services provided by DB Group are generally transacted within<br />
a time horizon of a few hours or days. As a result, the volume<br />
of incoming orders is not used as a control metric by most of<br />
the business units. The main exceptions here are the DB <strong>Bahn</strong><br />
Regional and DB Arriva business units where the conclusion of<br />
long-term transport contracts with the Federal states’ contracting<br />
authorities is of great importance in Germany. In the rest of<br />
Europe the key factor driving the development of business at<br />
the two business units is long-term contracts with franchisors.<br />
As of December 31, <strong>2010</strong> the volume of revenues secured<br />
by long-term contacts (concession fees) in the DB <strong>Bahn</strong> Regional<br />
business unit was € 28.3 billion.<br />
We expect the DB Arriva business unit to generate revenues<br />
(including farebox revenues) of about € 12 billion from contracting<br />
organizations and concessions.<br />
In general, the sale of tickets in the DB <strong>Bahn</strong> Long-Distance<br />
business unit directly results in revenues, which are recognized<br />
as such in a timely manner.<br />
The DB Schenker Rail and DB Schenker Logistics business<br />
units also enter into general contracts with customers who<br />
have a continual need for transport services or transport and<br />
logistical services.<br />
Incoming orders recorded by the DB Netze Track business<br />
unit generally refer to train-path assigned to train operating<br />
companies, where a distinction is made between scheduled and<br />
non-scheduled transports.<br />
The DB Netze Stations business unit has a similar structure<br />
wherein contracts are concluded with train operating companies<br />
for station stops, and long-term rental agreements are<br />
made for space within train stations. Incoming orders at the<br />
DB Netze Energy business unit refer to incoming orders from<br />
train operating companies to obtain energy. The infrastructure<br />
business units generate the majority of their revenues with<br />
intra-Group customers.<br />
The DB Services business unit also primarily provides services<br />
to intra-Group customers.
82<br />
| DEUTSCHE BAHN GROUP<br />
TENDERS IN RAIL AND BUS TRANSPORT<br />
RAIL TRANSPORT (DB BAHN REGIONAL)<br />
Tenders won in rail transport <strong>2010</strong> Term Volume<br />
Country<br />
million train km<br />
S-<strong>Bahn</strong> (metro) Hanover 12 /2012–12 /2020 8.5 Germany<br />
Warnow 12/2011–12 /2024 4.0 Germany<br />
Werdenfels 12/2013–12 /2025 4.1 Germany<br />
MWNK (partial networks Main-Weser and Kinzigtal) 12/2012–12 /2024 4.3 Germany<br />
S-<strong>Bahn</strong> (metro) Dresden 12 /2012–12 /2027 3.1 Germany<br />
RB 51, 63 and 64 (Single lot NRW) 12 /2011–12 /2026 3.0 Germany<br />
Central German network S-<strong>Bahn</strong> (metro) 12/2013–12 /2025 9.0 Germany<br />
Norrtåg-network 08 /2012–08 /2018 4.7 Sweden<br />
German ordering organizations concluded 19 (previous year: 21) tender<br />
procedures during the year under review and awarded a total of 62 million train<br />
kilometers (previous year: 64 million train kilometers). We participated in 17<br />
(previous year: 21) of the procedures involving a total of 61 million train<br />
kilometers (previous year: 64 million train kilometers). We won eight of the<br />
procedures (previous year: 11 procedures) or 62 % of the awarded train kilometers<br />
(previous year: 77 %). Of the train kilometers put up for bids, 79 %<br />
were previously operated by DB Group companies. Based on the volume of<br />
contracted business (train kilometers over the term of the contract) we<br />
recorded a 65 % success ratio (previous year: 78 %).<br />
Within the European market we (excluding Arriva) bid for tenders in<br />
Sweden and Great Britain that were ended during the year under review. Of<br />
these tender procedures we won one in Sweden.<br />
BUS TRANSPORT (DB BAHN URBAN)<br />
During the year under review a total of about 33 million commercial vehicle<br />
kilometers (bus km) were awarded in Germany (previous year: 31 million<br />
bus km) in 62 procedures. Of the awarded commercial vehicle kilometers, 14 %<br />
had previously been operated by DB Group companies.<br />
During the year under review we participated in 24 tender procedures (previous<br />
year: 39 tenders) having a total volume of 13 million bus km (previous year:<br />
18 million bus km). We won 34 % (previous year: 41 %) of the procedures we<br />
participated in.<br />
BUS AND RAIL TRANSPORT (DB ARRIVA)<br />
Tenders won in <strong>2010</strong> Term Volume million<br />
train km /bus km<br />
Country<br />
BUS TRANSPORT<br />
London (25 separate lines) each 5 years 23.9 Great Britain<br />
Malta and Gozo 07/2011–07/2021 24.7 Malta<br />
RAIL TRANSPORT<br />
Zwolle–Emmen and Almelo–Vechtdallijnen 12/2012–12 /2027 2.9 The Netherlands<br />
Kujawy–Pomerania 12/<strong>2010</strong>–12 /2020 2.1 Poland<br />
During the year under review DB Arriva again participated in tender procedures<br />
across Europe and was able to post numerous successes.<br />
A comparatively large portion of our concessions in the London bus market<br />
was put out for bids by the franchisor during the year under review of which<br />
we were able to win the majority once again.
| GROUP MAN<strong>AG</strong>EMENT REPORT<br />
| Business performance<br />
| Development of business units<br />
83<br />
Development of business units<br />
a Service restrictions hamper development of passenger transport business<br />
a Transport and Logistics division benefits from strong economic recovery<br />
a Infrastructure business units note substantially heavier demand from non-Group customers<br />
PASSENGER TRANSPORT<br />
a The acquisition of A Arriva [1] strengthened our market<br />
position in the European passenger transport sector.<br />
a During the year under review DB <strong>Bahn</strong> Regional and DB<br />
Arriva again won a number of A tenders [2] in Germany<br />
and in the rest of Europe.<br />
a After winning the tender to operate the Tyne and Wear Metro<br />
in Newcastle, UK, in 2009, DB Regio UK began operations in<br />
April <strong>2010</strong>. The contract has a term of seven years and represents<br />
an annual volume of 5.8 million train kilometers.<br />
a We signed a master agreement with MAN Commercial<br />
Vehicles (Nutzfahrzeuge) to purchase 600 buses worth<br />
more than € 150 million for our bus transport business in<br />
Germany. During the year under review we ordered 250 urban,<br />
coach and interurban buses under the master agreement.<br />
a We began to implement additional measures to improve<br />
customer service and further increase the stability and<br />
robustness of our operations as part of our A customer<br />
and quality initiative program [3].<br />
a The e-Ticketing pilot project, A Touch&Travel [4], was<br />
successfully completed during the year under review and<br />
will be integrated into normal operations as of 2011.<br />
a The number of <strong>Bahn</strong>Cards in circulation rose by 5 % over the<br />
same year-ago figure to 4.3 million cards as of December 31,<br />
<strong>2010</strong>. Activities to win new customers, such as the test<br />
<strong>Bahn</strong>Card 25 and the Fan <strong>Bahn</strong>Card 25, played a major role<br />
in expanding the number of cards.<br />
a Once again we saw good demand for our A bahn.corporate<br />
Umwelt-Plus (Environment Plus) offer [5] for CO 2 -free<br />
travel during the year under review. The offer is based on<br />
the procurement of addition traction current generated<br />
from renewable sources of energy.<br />
Additional information<br />
ICE FLEET AVAILABILITY REMAINS RESTRICTED<br />
Restricted availability of our ICE fleet (due to notably reduced<br />
intervals for maintenance and ultrasound inspections) again<br />
limited operations, and in some cases considerably, during the<br />
year under review. The lack of a normal reserve of 15 to 20 trains<br />
meant that we were unable to offset the effects of the severe<br />
weather conditions in <strong>2010</strong>, which exacerbated the situation.<br />
In the previous year we made a commitment to the Federal<br />
Railway Authority (EBA) to stop operating series 411 /415 ICE T<br />
vehicles with fully activated tilt technology. We also committed<br />
ourselves to conduct ultrasound inspections of the wheel set axles<br />
on the Stuttgart to Zurich line (Line 87) in far shorter intervals of<br />
20,000 kilometers and every 30,000 kilometers on the remaining<br />
network. Per a binding ruling by the EBA on March 16, <strong>2010</strong>, these<br />
intervals were reduced to 14,000 km for Line 87 and 21,000 km for<br />
the remaining network.<br />
<strong>AG</strong>REEMENT REACHED WITH MANUFACTURERS<br />
FOR REPLACEMENT OF ICE AXLES<br />
In October 2009 we reached a mutually agreeable solution with<br />
Siemens and Bombardier for the replacement of ICE 3 drive axles.<br />
By the end of February <strong>2010</strong> we had also reached a mutually<br />
agreeable solution with Alstom to exchange all wheel sets of the<br />
ICE T trains. The manufacturers are currently developing and<br />
testing new drive axles for the ICE 3 as well as wheel sets and<br />
drive axles for the ICE T on their own responsibility. The wheel<br />
set axles will then have to be approved by the Federal Railways<br />
Agency. Approval procedures for the ICE 3 drive axles have already<br />
begun. Following successful approvals, we will jointly agree with<br />
the manufacturers on implementing the exchange of axles and<br />
the corresponding time plan. A total of about 1,200 ICE 3 drive<br />
axles are affected, as well as about 2,100 ICE T axles.<br />
| [1] A Page 60 | [2] A Page 82<br />
| [5] A www.bahn.de/bahncorporate<br />
| [3] A Page 105<br />
| [4] A www.touchandtravel.de
84<br />
| DEUTSCHE BAHN GROUP<br />
IC DOUBLE-DECK COACHES ORDERED FOR<br />
LONG-DISTANCE TRANSPORT<br />
We ordered 135 double-deck coaches from Bombardier Transportation<br />
for Intercity (IC) transport in the rail passenger longdistance<br />
transport. The order consists of 27 trains with five cars<br />
each. We also ordered new series 146.2 locomotives. The doubledeck<br />
coaches and locomotives have a total value of about<br />
€ 60 million. The new double-deck coaches can be delivered in a<br />
relatively short time as they were already agreed on in an existing<br />
master agreement.<br />
The double-deck coaches are a further development of the<br />
proven vehicles already used in regional transport. This move<br />
means that we can add new vehicles to selected IC lines within<br />
the coming three years and offer our customers comprehensive<br />
long-distance transport service across the nation.<br />
CHANGES IN THE STRUCTURE OF BUSINESS UNITS<br />
Following the acquisition of A Arriva [1] we altered the management<br />
structure within the Passenger Transport board division<br />
to include the new DB Arriva business unit. As of January 1, 2011,<br />
this business unit will contain all regional transport activities<br />
outside of Germany. Furthermore, all internationally related tasks<br />
(excluding cross-border routes) will also be assigned to the<br />
DB Arriva business unit.<br />
In the future, the DB <strong>Bahn</strong> Regional business unit will solely<br />
be responsible for regional transport activities in Germany.<br />
The previous DB <strong>Bahn</strong> Urban business will be absorbed by the<br />
DB <strong>Bahn</strong> Regional business unit.<br />
FEDERAL COURT OF JUSTICE (BGH) RULES ON<br />
TRANSPORT CONTRACT WITH VRR<br />
At the end of 2009 the Rhine-Ruhr transport association (Verkehrsverbund<br />
Rhein-Ruhr; VRR) and DB Group agreed to A modify<br />
the existing transport agreement [2].<br />
At the beginning of the year under review, Abellio Rail NRW<br />
GmbH and Wersus Public Passenger Transport Ltd. submitted<br />
applications to the contracting authority (Vergabekammer) in<br />
Münster to initiate revision proceedings to partially or fully void<br />
the modified agreement.<br />
The application by Wersus Public Passenger Transport Ltd.<br />
was rejected as unjustified by both the contracting authority in<br />
Münster and the Higher Regional Court in Düsseldorf. In contrast,<br />
the application submitted by Abellio Rail NRW GmbH was<br />
ac cept ed as justified by both the contracting authority in Münster<br />
and the Higher Regional Court in Düsseldorf. Per a ruling of the<br />
Higher Regional Court in Düsseldorf dated July 21, <strong>2010</strong>, the Court<br />
submitted the application to the Federal Court of Justice because<br />
it wanted to differ from the existing decision made by the Higher<br />
Regional Court in Brandenburg in 2003, which postulated that<br />
local rail passenger transport contracts are not required to be<br />
awarded through a tendering process. Oral proceedings were<br />
held before the Federal Court of Justice on December 7, <strong>2010</strong> and<br />
the Court announced its A decision [3] on February 8, 2011.<br />
Mofair e.V., a special interest group including Abellio, has<br />
claimed in several letters directed to the EU Commission that<br />
transport contracts between VVR and DB Group companies<br />
contained impermissible subsidies. In response to these letters,<br />
the EU Commission submitted a request, that was answered by<br />
the Federal Republic of Germany. DB Group believes that the<br />
agreement contains no such impermissible subsidies.<br />
RESTRICTIONS ON OPERATIONS OF S-BAHN (METRO)<br />
BERLIN CONTINUE<br />
Operations of the S-<strong>Bahn</strong> (metro) Berlin have been restricted<br />
since July 2009 due to a significant reduction in the number of<br />
available vehicles. The situation at the S-<strong>Bahn</strong> (metro) Berlin<br />
was exacerbated in December 2009 because of additional measurements<br />
that had become necessary for all series 481 vehicles<br />
due to corresponding EBA requirements, as well as a great<br />
number of construction-related engine disturbances that had<br />
occurred in series 481 vehicles. Concurrently, more than 150 series<br />
481 train units were not operating because of defective engines<br />
caused by drifting snow and condensation. As a result, the<br />
schedule could not be improved as planned at the start of<br />
December 2009.<br />
In order to stabilize the situation it was decided to operate<br />
with a reduced level of scheduled services. Substitute transports<br />
were organized to lessen the effects of the reductions. Although<br />
the number of available quarter-trains continually increased<br />
until June <strong>2010</strong>, no further improvements to the offered services<br />
were achieved since then. During the year under review services<br />
worth € 72 million were provided to customers to compensate<br />
them for service limitations stemming from technical difficulties.<br />
The vehicle availability situation remains very tight due<br />
to numerous overlapping technical problems. During talks<br />
be tween DB Group and the two Federal states, Berlin and<br />
Brandenburg, in early November <strong>2010</strong> concerning the additional<br />
use of available S-<strong>Bahn</strong> (metro) vehicles, it was agreed that<br />
“stability takes priority over volume” and that the valid schedule<br />
of service in effect since June <strong>2010</strong> would remain unchanged<br />
through the <strong>2010</strong>/2011 winter period.<br />
| [1] A Page 60<br />
| [2] A 2009 <strong>Annual</strong> <strong>Report</strong> Page 122<br />
| [3] A Page 130
| GROUP MAN<strong>AG</strong>EMENT REPORT<br />
| Development of business units<br />
85<br />
Despite previous measures taken to prepare for winter, severe<br />
weather conditions in December <strong>2010</strong> caused a significant reduction<br />
in vehicle availability as vehicles were sidelined because of<br />
the weather. Despite all of the additional measures taken to<br />
expand the capacities of local maintenance facilities, the number<br />
of available vehicles fell continuously during December <strong>2010</strong> due<br />
to the extraordinarily high number of disturbances.<br />
<strong>AG</strong>REEMENT REACHED TO MODIFY S-BAHN (METRO)<br />
BERLIN TRANSPORT CONTRACT<br />
At the end of June <strong>2010</strong> we reached an agreement with the Berlin<br />
Senate to modify the current S-<strong>Bahn</strong> (metro) Berlin transport<br />
contract due to the continued limitations in service experienced<br />
since July 2009. The modified contract was signed in October<br />
<strong>2010</strong>. The key issues covered were defined quality benchmarks<br />
for punctuality, cleanliness and customer satisfaction, as well<br />
as an exact definition of the number of quarter-trains to be<br />
operated. If the benchmarks for punctuality, cleanliness and<br />
customer satisfaction are not met the concession fee may be<br />
reduced (penalty payment) in accordance with the agreed-upon<br />
conditions. Furthermore, penalties will also be incurred if the<br />
agreed number of quarter-trains are not operated. The annual<br />
cap on the amount of penalties was raised.<br />
DB <strong>Bahn</strong> Long-Distance business unit<br />
Selected key figures [ € million ] <strong>2010</strong> 2009 Change<br />
absolute %<br />
Passengers rail (million) 125.7 122.7 + 3.0 +2.4<br />
Volume sold rail (million pkm) 36,026 34,708 + 1,318 + 3.8<br />
Load factor (%) 48.0 45.1 – –<br />
Total revenues 3,729 3,565 + 164 + 4.6<br />
thereof external revenues 3,602 3,435 + 167 + 4.9<br />
EBITDA adjusted 481 504 –23 – 4.6<br />
EBIT adjusted 117 141 –24 –17.0<br />
Gross capital expenditures 48 47 + 1 +2.1<br />
Employees (FTE as of December 31) 15,270 15,043 +227 +1.5<br />
PERFORMANCE DEVELOPMENT<br />
Development noted for the DB <strong>Bahn</strong> Long-Distance business<br />
unit during the year under review was favorably influenced by<br />
increased demand. This was mainly driven by the good market<br />
acceptance of our offers and schedule measures, favorable<br />
development of the international routes and the restrictions to<br />
air travel seen in the spring of <strong>2010</strong> due to clouds of volcanic<br />
ash. Furthermore, the onset of severe winter weather at the<br />
start and end of the year under review also played a key role. In<br />
line with the increase in the mean travel distance, we noted<br />
increases in the number of passengers (from 122.7 million to<br />
125.7 million), volume sold (from 34,708 to 36,026 million pkm)<br />
and the load factor (from 45.1 % to 48.0 %) in <strong>2010</strong>.<br />
BUSINESS DEVELOPMENT<br />
Favorable effects arising from the development of performance<br />
coupled with pricing effects led to a noticeable increase in<br />
revenues. Accordingly, both total revenues and external revenues<br />
rose during the year under review. The reduction noted for other<br />
operating income was due in particular to lower cross-border<br />
transports, lower vehicle leasing income received from individual<br />
customers, as well as lower income from the sale of vehicles.<br />
On the expenses side we recorded slightly greater-thanproportionate<br />
increases in the cost of materials due to sharp<br />
increases in maintenance costs and measures to increase vehicle<br />
availability which more than offset lower energy expenses due<br />
to the lower charges for traction current. Increases were also<br />
noted for personnel expenses (caused by higher numbers of<br />
personnel and increased wages), and other operating expenses<br />
(higher marketing costs and expenses related to the expansion<br />
of passenger rights).<br />
Results reflect the € 23 million decline in adjusted EBITDA<br />
to € 481 million and a € 24 million drop in the adjusted EBIT figure<br />
to € 117 million. The additional revenues were unable to offset<br />
the higher personnel expenses and the significant increase in<br />
the cost of materials and other expenses.
86<br />
| DEUTSCHE BAHN GROUP<br />
Gross capital expenditures were slightly above the same year-ago<br />
figure. The change was due to the expansion of the ICE workshop<br />
in Frankfurt-Griesheim, where maintenance on multi-system<br />
trains takes place, as well as the procurement of ultra-sound<br />
testing equipment. The main emphasis of capital expenses made<br />
during the year under review may be found in the chapter A<br />
Capital expenditures [1].<br />
The number of employees increased in comparison to the same<br />
figure noted on December 31, 2009. The change was primarily<br />
driven by an increase in maintenance personnel due to shorter<br />
intervals for ultrasound tests, and additional staff in the onboard<br />
service area.<br />
DB <strong>Bahn</strong> Regional business unit<br />
Selected key figures [ € million ] <strong>2010</strong> 2009 Change<br />
absolute %<br />
Passengers rail (million) 1,820 1,781 + 39 +2.2<br />
Volume sold rail (million pkm) 42,435 41,971 + 464 +1.1<br />
Volume produced rail (million train-path km) 525.1 525.0 + 0.1 –<br />
Total revenues 7,559 7,587 – 28 – 0.4<br />
thereof external revenues 7,482 7,509 – 27 – 0.4<br />
thereof concession fees 4,273 4,474 –201 – 4.5<br />
EBITDA adjusted 1,229 1,407 –178 –12.7<br />
EBIT adjusted 729 899 –170 –18.9<br />
Gross capital expenditures 212 407 –195 – 47.9<br />
Employees (FTE as of December 31) 29,008 28,668 + 340 +1.2<br />
An organizational change necessitated an adjustment in the<br />
previous year’s figures for the DB <strong>Bahn</strong> Regional and DB <strong>Bahn</strong><br />
Urban business units. The Berlin and Hamburg S-<strong>Bahn</strong>s (metros)<br />
were transferred to the DB <strong>Bahn</strong> Regional business unit effective<br />
January 1, <strong>2010</strong>. They had been previously carried under the DB<br />
<strong>Bahn</strong> Urban business unit where they had formed the S-<strong>Bahn</strong><br />
division. The previous year’s figures were adjusted accordingly.<br />
PERFORMANCE DEVELOPMENT<br />
The favorable development of performance of rail transport<br />
noted during the year under review was driven by the inauguration<br />
of service of the Tyne and Wear Metro in Newcastle as well<br />
as the increase in volume sold for the S-<strong>Bahn</strong> (metro) Hamburg.<br />
Declines were caused by lower performance related to tenders<br />
lost in the previous years. The total number of passengers carried<br />
rose by 2.2 %, and volume sold by 1.1 %, while volume produced<br />
remained at the same year-ago level.<br />
BUSINESS DEVELOPMENT<br />
Despite the higher number of passengers and the favorable<br />
development of volume sold, total and external revenues declined<br />
slightly. Revenues were negatively influenced by reduced concession<br />
fees for reasons including lost tenders, which we were<br />
unable to fully offset with additional farebox revenues, as well<br />
as A service restrictions experienced at the S-<strong>Bahn</strong> (metro)<br />
Berlin [2]. In contrast, the inauguration of service on the Tyne<br />
and Wear Metro line had a favorable effect.<br />
On the expenses side we incurred a slight increase in the<br />
cost of materials. Price and volume-driven reductions in expenses<br />
for energy and train-path were offset by higher costs for transport<br />
services purchased (partly due to the procurement of<br />
substitute transports), higher maintenance expenses as well as<br />
our A customer and quality initiative program [3] that was<br />
launched during the year under review. Personnel expenses were<br />
slightly higher due mainly to higher wages as well as the inauguration<br />
of service on the Tyne and Wear Metro.<br />
Additional charges were caused by penalty fees paid by the<br />
S-<strong>Bahn</strong> (metro) Berlin.<br />
Depreciation was slightly below the same year-ago figure.<br />
The change was partly due to shifts in vehicle delivery dates.<br />
The decrease in revenues and the additional cost burden<br />
caused both the adjusted EBITDA (decline of € 178 million to<br />
€ 1,229 million) as well as the adjusted EBIT figure (decline of<br />
€ 170 million to € 729 million) to fall significantly.<br />
| [1] A Page 100 ff. | [2] A Page 84 f.<br />
| [3] A Page 105
| GROUP MAN<strong>AG</strong>EMENT REPORT<br />
| Development of business units<br />
87<br />
Gross capital expenditures were significantly below the same<br />
year-ago figure due to lower additions of new vehicles as delivery<br />
dates were moved back. The main emphasis may be found in<br />
the chapter A Capital expenditures [1].<br />
The number of employees rose by 1.2 %. This change was especially<br />
influenced by start of operations at Tyne and Wear Metro,<br />
which resulted in an additional 499 employees.<br />
DB <strong>Bahn</strong> Urban business unit<br />
Selected key figures [ € million ] <strong>2010</strong> 2009 Change<br />
absolute %<br />
Passengers bus (million) 731.9 747.6 – 15.7 – 2.1<br />
Volume sold bus (million bus km) 8,394 8,446 – 52 – 0.6<br />
Volume produced bus (million bus km) 612.1 599.6 +12.5 +2.1<br />
Total revenues 1,272 1,252 +20 +1.6<br />
thereof external revenues 1,227 1,219 + 8 + 0.7<br />
EBITDA adjusted 132 146 –14 – 9.6<br />
EBIT adjusted 62 71 – 9 –12.7<br />
Gross capital expenditures 91 57 +34 + 59.6<br />
Employees (FTE as of December 31) 9,009 8,972 + 37 + 0.4<br />
An organizational change necessitated an adjustment in the<br />
previous year’s figures for the DB <strong>Bahn</strong> Regional and DB <strong>Bahn</strong><br />
Urban business units. The Berlin and Hamburg S-<strong>Bahn</strong>s (metros)<br />
were transferred to the DB <strong>Bahn</strong> Regional business unit effective<br />
January 1, <strong>2010</strong>. They had been previously carried under the DB<br />
<strong>Bahn</strong> Urban business unit where they had formed the S-<strong>Bahn</strong><br />
division. The previous year’s figures were adjusted accordingly.<br />
PERFORMANCE DEVELOPMENT<br />
The bus transport business declined during the year under review.<br />
In comparison to the same year-ago figures the number of passengers<br />
fell by 2.1 % and volume sold dropped by 0.6 %. Volume<br />
produced gained by 2.1 %. The increase in volume produced was<br />
driven by a greater volume of services provided as substitute<br />
transports for rail transport during the year under review. The<br />
development of performance was negatively influenced by<br />
performance losses in Germany and lower numbers of schoolchildren.<br />
Favorable effects stemmed in part from tenders won,<br />
especially in Denmark that took effect as of mid-2009, as well<br />
as the inauguration of the Nuremberg–Prague connection in<br />
August 2009.<br />
BUSINESS DEVELOPMENT<br />
In total, earnings contracted despite slightly higher revenues.<br />
Higher revenues from substitute transport services offset the<br />
lower number of passengers as well as the reduction in service<br />
on low-margin routes. Other operating income rose slightly due<br />
to the sale of buses.<br />
On the expenses side, the increase in personnel expenses<br />
and cost of materials were burdens due to higher maintenance<br />
expenses and costs for contracted services.<br />
Despite the increase in revenues, higher total expenses led<br />
to a significant € 14 million decline in adjusted EBITDA to € 132<br />
million and a € 9 million drop in EBIT to € 62 million.<br />
Gross capital expenditures in the period under review<br />
amounted to € 91 million and were significantly above the same<br />
year-ago levels. The change was mainly driven by the additional<br />
modernization of our bus fleet. The main emphasis may be found<br />
in the chapter A Capital expenditures [1].<br />
The number of employees rose in comparison to the same<br />
figure at December 31, 2009, as the newly won routes required<br />
us to hire additional personnel.<br />
| [1] A Page 100 ff.
88<br />
| DEUTSCHE BAHN GROUP<br />
DB Arriva business unit<br />
Selected key figures [ € million ]<br />
<strong>2010</strong> included<br />
<strong>2010</strong><br />
2009<br />
Change<br />
in consolidated (pro forma) 1) (pro forma) 1)<br />
absolute %<br />
financial<br />
statements<br />
Volume produced rail (million train-path km) – 84.3 84.8 –0.5 –0.6<br />
Volume produced bus (million bus km) – 848.4 893.5 – 45.1 – 5.0<br />
Total revenues 1,046 3,063 3,080 –17 – 0.6<br />
thereof external revenues 1,046 – – – –<br />
thereof concession fees (rail and bus) 453 n.a. n.a. – –<br />
EBITDA adjusted 132 326 316 +10 + 3.2<br />
EBIT adjusted 55 143 111 +32 +28.8<br />
Gross capital expenditures 171 289 290 –1 – 0.3<br />
Employees (FTE as of December 31) 36,454 36,454 37,400 – 946 –2.5<br />
1)<br />
Figures are from Arriva’s internal management reports, do not include Arriva Germany and are not audited. In accordance with the EC Commission “Hold<br />
Separate” requirements, DB Group has no knowledge of the composition of these figures.<br />
Following its acquisition during the year under review, A Arriva<br />
[1] is included in the DB Group’s scope of consolidation since<br />
September 1, <strong>2010</strong>. Accordingly, no comparable figures are<br />
available for the same year-ago period. The development of<br />
DB Arriva for the year as presented is a pro-forma presentation<br />
that is not relevant for the development of DB Group during the<br />
year under review.<br />
Furthermore, no performance data (passengers and volume<br />
sold) for Arriva were taken into consideration for the year under<br />
review.<br />
In total, Arriva recorded a slight decline in total revenues<br />
during the year under review. The “UK Bus” division posted favorable<br />
development due mainly to exchange rate effects despite<br />
burdens arising from, above all, higher fuel costs.<br />
Within the “UK Trains” division, demand noted in both franchises,<br />
Arriva Trains Wales and CrossCountry, rose during the year under<br />
review. Overall financial development was, however, burdened<br />
by the unchanged weak results posted by CrossCountry. Furthermore,<br />
the severe weather conditions seen at the start and end<br />
of the year under review had a negative effect.<br />
Development fell in the “Mainland Europe” division. This<br />
was caused by the loss of a major transport contract in the Netherlands,<br />
which could not be fully offset by new transport gains.<br />
While development in Italy, Spain and Eastern Europe stagnated,<br />
substantially higher revenues were achieved in Scandinavia.<br />
Significant improvements were noted in the adjusted EBITDA<br />
figure (up € 10 million to € 326 million) and adjusted EBIT (gain<br />
of € 32 million to € 143 million).<br />
| [1] A Page 60
| GROUP MAN<strong>AG</strong>EMENT REPORT<br />
| Development of business units<br />
89<br />
TRANSPORT AND LOGISTICS<br />
a In February <strong>2010</strong> the A Xrail [1] cooperation agreement<br />
was signed by seven European freight railways, including<br />
DB Schenker Rail. The purpose of Xrail is to improve the<br />
quality of cross-border single wagon transport and to expand<br />
competitiveness of the single wagon transport and make<br />
it a more customer-oriented product.<br />
a We joined together with the Belgian freight railway, SNCB,<br />
to found the Cobra (Corridor Operations Belgium Rail)<br />
production company. The cross-border operation of 30 multisystem<br />
locomotives in the three-country triangle – Belgium,<br />
the Netherlands and Germany – cuts transport time and<br />
increases efficiency. About 100 trains were involved here<br />
in block train and combined transport operations in <strong>2010</strong>.<br />
a During the year under review we were able to sign up the<br />
first customers for our A Eco Plus [2] product for CO 2 -<br />
free rail freight transports.<br />
a We further expanded our network as we opened new logistics<br />
centers, including some with rail connections or locations<br />
near airports, in Salzburg / Austria, Milan / Italy, Brünn / Czech<br />
Republic, Sofia / Bulgaria, Stockholm / Sweden, Groveport<br />
(Columbus) / USA and Pardubice /Czech Republic.<br />
a DB Schenker again provided support to numerous major<br />
events in <strong>2010</strong> including: the Winter Olympics in Vancouver/<br />
Canada, the FIFA World Cup in South Africa, the Asian Games<br />
in Guangzhou/China, the Commonwealth Games in New<br />
Delhi/India, the Youth Olympic games in Singapore, the<br />
FIFA U 20 Women’s World Cup in Germany and the Hockey<br />
World Championship in New Delhi/India.<br />
a The Kellogg Joint Venture awarded DB Schenker the contract<br />
to provide global and national transport services for the<br />
major Gorgon gas production project in Australia. Kellogg<br />
is a consortium consisting of Chevron, ExxonMobil and Shell.<br />
The project has an capital expenditure volume of € 25 billion<br />
and is the biggest gas production project in Australia and<br />
currently one of the biggest in the world. The four-year<br />
contract covers the provision of integrated logistical services<br />
by DB Schenker and has a total volume of about € 350 million.<br />
a DB Schenker Rail increased its stake in NordCargo S.r.l, an<br />
Italian rail freight company, by an additional 11 % to currently<br />
60 % of the Milan-based company. Italy is one of the most<br />
important foreign markets for DB Schenker Rail.<br />
a DB Schenker Logistics opened its first IT Shared Services<br />
Centre (SSC) in the region in the Jiangsu Software Park in<br />
Nanjing / China. With 1,400 square meters, the information<br />
technology center bundles together IT functions such as<br />
development and operation of applications, maintenance,<br />
as well as information and communication technology<br />
infrastructure.<br />
a DB Schenker Rail Bulgaria has been operating with a traction<br />
license as an independent railway operating company<br />
in Bulgaria since May <strong>2010</strong>.<br />
| [1] A www.xrail.eu<br />
| [2] A Page 115
90<br />
| DEUTSCHE BAHN GROUP<br />
DB Schenker Rail business unit<br />
Selected key figures [ € million ] <strong>2010</strong> 2009 Change<br />
absolute %<br />
Freight carried (million t) 415.4 341.0 +74.4 +21.8<br />
Volume sold (million tkm) 105,794 93,948 +11,846 +12.6<br />
Capacity utilization (t per train) 502.4 484.0 + 18.4 + 3.8<br />
Total revenues 4,584 4,055 + 529 +13.0<br />
thereof external revenues 4,314 3,791 + 523 +13.8<br />
EBITDA adjusted 302 107 +195 –<br />
EBIT adjusted 12 –189 +201 –<br />
Gross capital expenditures 350 319 + 31 + 9.7<br />
Employees (FTE as of December 31) 32,618 34,145 –1,527 – 4.5<br />
Development of the DB Schenker Rail business unit for the year<br />
under review was influenced by the first-time full-year inclusion of<br />
DB Schenker Rail Polska in the scope of consolidation. DB Schenker<br />
Rail Polska was only included in the previous year’s figures since<br />
August 2009.<br />
PERFORMANCE DEVELOPMENT<br />
Development of business volume recorded for DB Schenker Rail<br />
business unit was very strong and tracked development in the<br />
A freight transport markets [1], which was favorable due to<br />
the economic recovery. Above all, the higher number of transports<br />
in all market areas in Germany, as well as effects from the<br />
complete inclusion of DB Schenker Rail Polska, representing a<br />
total of 2.2 billion tkm, made it possible to increase volume sold<br />
by 12.6 %. Driven by the favorable development of demand, we<br />
also posted a significant 8.5 % gain in volume produced during<br />
the year under review. This also meant that the capacity utilization<br />
rate of our trains rose by 3.8 %.<br />
Adjusted for effects of DB Schenker Rail Polska, volume<br />
sold in creased by 13.0 %, volume produced gained by 9.3 % and<br />
the ca pac ity utilization rate rose by 3.4 % over the same yearago<br />
figures.<br />
BUSINESS DEVELOPMENT<br />
Based on the development of performance, sharp gains were<br />
recorded for both total revenues (+13.0 %) and external revenues<br />
(+13.8 %). The complete inclusion of DB Schenker Rail Polska in<br />
the scope of consolidation had a total effect of € 129 million on<br />
revenues. All regions (West, Central and East) were able to<br />
record favorable rates of growth. Excluding the effects of DB<br />
Schenker Rail Polska, region Central posted the strongest<br />
increase in total revenues of 10.6%. This was driven by the<br />
recovery of the economy in all market segments of importance<br />
for the rail freight transport business, as well as our specially<br />
targeted sales measures. While demand for transport services<br />
tracked the economic recovery and once again increased significantly,<br />
freight rates were unable to rise at the same pace.<br />
The expense items cost of materials, personnel expenses<br />
and other operating expenses rose substantially due to the<br />
sharp economic recovery and the effects of full-year inclusion of<br />
DB Schenker Rail Polska in the scope of consolidation. After<br />
adjustments for DB Schenker Rail Polska, the cost of materials,<br />
in particular, increased due to higher maintenance expenses<br />
incurred to return freight cars to service, which had been removed<br />
from service in the previous year due to the lack of demand. The<br />
reduction in personnel in the region Central and DB Schenker<br />
Rail Polska had a favorable effect on personnel expenses, while<br />
wage increases had an opposite effect. Excluding effects arising<br />
from the full-year inclusions of DB Schenker Rail Polska into the<br />
scope of consolidation, personnel expenses rose slightly.<br />
Notable gains were noted for results as adjusted EBITDA<br />
grew by € 195 million and the adjusted EBIT figure advanced by<br />
€ 201 million. Nonetheless, adjusted EBIT remained at a low level<br />
at € 12 million, as, among other factors, the level of performance<br />
still remained significantly below the pre-crisis level. Furthermore,<br />
the development of results recorded for DB Schenker Rail UK,<br />
Euro Cargo Rail (France) and DB Schenker Rail Polska was still<br />
unsatisfactory.<br />
Gross capital expenditures were higher than the comparable<br />
same year-ago figure. The main emphasis may be found in the<br />
chapter A Capital expenditures [2].<br />
The number of employees declined as of December 31, <strong>2010</strong>,<br />
especially because of personnel reductions made in the region<br />
Central and at DB Schenker Rail Polska.<br />
| [1] A Page 68 ff.<br />
| [2] A Page 100 ff.
| GROUP MAN<strong>AG</strong>EMENT REPORT<br />
| Development of business units<br />
91<br />
DB Schenker Logistics business unit<br />
Selected key figures [ € million ] <strong>2010</strong> 2009 Change<br />
absolute %<br />
Shipments in European land transport (thousand) 80,816 70,052 +10,764 +15.4<br />
Air freight volume (export, thousand t) 1,225 1,032 +193 +18.7<br />
Ocean freight volume (export, thousand TEU) 1,647 1,424 +223 +15.7<br />
Total revenues 14,310 11,292 +3,018 +26.7<br />
thereof external revenues 14,257 11,249 +3,008 +26.7<br />
Gross profit margin (%) 29.3 32.7 – –<br />
EBITDA adjusted 478 371 +107 +28.8<br />
EBIT adjusted 304 199 + 105 + 52.8<br />
EBIT margin adjusted (%) 2.1 1.8 – –<br />
Gross capital expenditures 189 196 –7 –3.6<br />
Employees (FTE as of December 31) 58,671 57,134 +1,537 +2.7<br />
Development noted for the DB Schenker Logistics business unit<br />
was favorable in all segments and regions during the year under<br />
review. Driven by the sharp recovery of the economy in Germany<br />
and the Asian markets, volume shipped in our networks, and<br />
thus revenues and profits, once again rose significantly.<br />
Revenues grew the fastest in the region Asia / Pacific with<br />
a gain of 44 %, while the region Central was the largest region<br />
in terms of revenues, which expanded by 22 %. Revenues were<br />
favorably influenced by exchange rate effects of € 627 million<br />
along with higher expenses, which had a negative effect.<br />
The gross earnings margin fell from 32.7 % in the previous<br />
year to 29.3 % during the year under review. This change was<br />
due to the fact that the volume of services we procured rose at<br />
a faster pace than our revenues.<br />
Driven by the sharp increase in revenues the adjusted EBITDA<br />
figure improved by € 107 million to € 478 million and adjusted<br />
EBIT grew by € 105 million to € 304 million.<br />
Gross capital expenditures were slightly below the comparable<br />
same year-ago figures. The main emphasis may be found<br />
in the chapter A Capital expenditures [1].<br />
The favorable development of business was also reflected by<br />
the increased number of employees as of December 31, <strong>2010</strong>.<br />
PERFORMANCE DEVELOPMENT<br />
Due to the economic recovery and the resulting revival of the<br />
A transport and logistics markets [2] shipments noted for the<br />
European land transport sector grew significantly by 15.4 %, while<br />
air freight volume rose by 18.7 % and the volume of ocean freight<br />
shipments expanded by 15.7 %. Our contract logistics/SCM business<br />
also benefited from the rebound in global development.<br />
The increase in the European land transport affected both<br />
the national and international land transport sectors, although<br />
the international routes posted significantly stronger development.<br />
The air freight market, in particular, benefited significantly<br />
from the economic recovery. Notable gains were recorded on<br />
all of the major routes.<br />
The development of performance of our ocean freight business<br />
tracked market trends and was very favorable.<br />
In the contract logistics segment we benefited especially<br />
from the global upswing in sales in the automotive sector.<br />
| [1] A Page 100 ff. | [2] A Page 70 f.
92<br />
| DEUTSCHE BAHN GROUP<br />
BUSINESS DEVELOPMENT<br />
EUROPEAN LAND TRANSPORT<br />
Selected key figures [ € million ] <strong>2010</strong> 2009 Change<br />
absolute %<br />
Shipments in European land transport (thousand) 80,816 70,052 +10,764 +15.4<br />
Total revenues 5,864 5,086 + 778 + 15.3<br />
thereof external revenues 5,815 5,048 + 767 + 15.2<br />
EBITDA adjusted 194 199 – 5 –2.5<br />
EBIT adjusted 99 108 – 9 – 8.3<br />
Employees (FTE as of December 31) 23,666 22,946 +720 +3.1<br />
Total revenues recorded for our European land transport business<br />
for the year under review amounted to € 5,864 million, or<br />
15.3 % over the same year-ago figure. The growth in revenues<br />
was similar to the growth noted for volume shipped. Both the<br />
national and international land transport sectors benefited from<br />
the strong development.<br />
Price levels were relatively low at the start of <strong>2010</strong> due to<br />
freight forwarders’ aggressive pricing policy in the previous<br />
year. Upward price adjustments were extremely limited due to<br />
the very intensive competitive situation. Furthermore, in some<br />
cases the lifetime of ongoing contracts that were based on the<br />
previous year’s lower prices continued beyond the first half of<br />
<strong>2010</strong>. The situation improved a bit in the second half of <strong>2010</strong> as<br />
rising demand made it possible to adjust prices once again in<br />
some cases.<br />
The favorable development of revenues was offset by burdens<br />
caused by higher fuel prices, as well as transport costs<br />
because of the difficulty in obtaining freight capacity during the<br />
course of the year, which had a corresponding effect on the<br />
development of margins.<br />
The development of results from operations was therefore<br />
lower than the same year-ago figure. Total adjusted EBITDA fell<br />
by € 5 million to € 194 million while the adjusted EBIT figure<br />
decreased by € 9 million to € 99 million.<br />
AIR AND OCEAN FREIGHT<br />
Selected key figures [ € million ] <strong>2010</strong> 2009 Change<br />
absolute %<br />
Air freight volume (export, thousand t) 1,225 1,032 +193 +18.7<br />
Ocean freight volume (export, thousand TEU) 1,647 1,424 +223 +15.7<br />
Total revenues 7,135 5,051 +2,084 + 41.3<br />
thereof external revenues 7,132 5,049 +2,083 + 41.3<br />
EBITDA adjusted 227 120 +107 + 89.2<br />
EBIT adjusted 186 77 +109 +142<br />
Employees (FTE as of December 31) 21,343 21,238 +105 + 0.5<br />
Total revenues recorded for the air and ocean freight sectors<br />
surged by 41.3 % over the same year-ago figure during the year<br />
under review to € 7,135 million. As global trade especially benefited<br />
from the economic recovery, both our air and ocean<br />
freight business participated in these strong developments.<br />
Furthermore, our trade fair/sports and project business, as well<br />
as our domestic American business were above the comparable<br />
year-ago figures.<br />
The development of results from operations significantly<br />
improved in all segments, especially air freight, in comparison<br />
with the previous year’s figures. In total, adjusted EBITDA rose<br />
notably by € 107 million to € 227 million as did adjusted EBIT,<br />
which surged by € 109 million to € 186 million.
| GROUP MAN<strong>AG</strong>EMENT REPORT<br />
| Development of business units<br />
93<br />
CONTRACT LOGISTICS<br />
Selected key figures [ € million ] <strong>2010</strong> 2009 Change<br />
absolute %<br />
Total revenues 1,310 1,152 +158 +13.7<br />
thereof external revenues 1,308 1,151 +157 +13.6<br />
EBITDA adjusted 79 54 +25 + 46.3<br />
EBIT adjusted 44 18 +26 +144<br />
Employees (FTE as of December 31) 13,333 12,633 +700 + 5.5<br />
Our contract logistics/SCM business was also able to benefit<br />
from the favorable economic developments during the year<br />
under review and recorded a 13.7 % increase in total revenues<br />
and a 13.6 % gain in external revenues. Our activities in the region<br />
Asia, in particular, recorded significant growth. In total, our<br />
contract logistics activities in Europe were greater than the same<br />
year-ago figure.<br />
The greatest increase in results from operations was posted by<br />
our European companies, and the region Central in particular.<br />
In total, our adjusted EBITDA figure increased by € 25 million to<br />
€ 79 million while adjusted EBIT improved by € 26 million to<br />
€ 44 million.<br />
SERVICES<br />
a Under the supervision of DB Systel one of the most modern<br />
computer centers in Europe was built in Berlin-Mahlsdorf.<br />
The highest security requirements for operating an IT structure<br />
are implemented in the building comprising nearly<br />
5,000 square meters.<br />
a DB Fuhrpark (fleet management) won the European tender<br />
to manage the fleet of Bilfinger&Berger, a construction<br />
firm, with about 4,000 vehicles.<br />
DB Services business unit<br />
Selected key figures [ € million ] <strong>2010</strong> 2009 Change<br />
absolute %<br />
Segment revenues 3,114 2,864 +250 + 8.7<br />
thereof total revenues 1,274 1,237 + 37 + 3.0<br />
thereof external revenues 128 109 +19 +17.4<br />
thereof other operating income 1,840 1,627 +213 +13.1<br />
EBITDA adjusted 287 297 –10 –3.4<br />
EBIT adjusted 129 125 + 4 +3.2<br />
Gross capital expenditures 177 138 +39 +28.3<br />
Employees (FTE as of December 31) 25,131 24,460 + 671 +2.7<br />
BUSINESS DEVELOPMENT<br />
Development of the DB Services business unit is primarily influenced<br />
by its support function for intra-Group customers. For<br />
this reason, the biggest portion of total segment revenues<br />
(revenues plus other operating income) of € 3,114 million, were<br />
once again internal segment revenues of € 2,707 million, which<br />
increased by 7.2 % during the year under review. This increase<br />
was mainly driven by higher results for maintenance of rail<br />
vehicles posted by DB Fahrzeuginstandhaltung (vehicle maintenance).<br />
In contrast, lower internal revenues were recorded<br />
for information technology and telecommunications services.<br />
On the expense side, the cost of materials, in particular,<br />
increased notably due mainly to higher intermediate inputs for<br />
vehicle maintenance. Higher wages were the main driver causing
94<br />
| DEUTSCHE BAHN GROUP<br />
personnel expenses to rise over the same year-ago figure. Depreciation<br />
fell significantly during the year under review due to a<br />
lower number of vehicles.<br />
Correspondingly, adjusted EBITDA also fell by € 10 million to<br />
€ 287 million while the adjusted EBIT figure rose by € 4 million to<br />
€ 129 million. This change was especially due to the higher capacity<br />
utilization rate recorded for vehicle maintenance operations.<br />
Gross capital expenditures were higher than the same yearago<br />
level due to the construction of a computer center near<br />
Berlin and new telecommunications facilities. The main emphasis<br />
may be found in the chapter A Capital expenditures [1].<br />
The number of employees increased by 2.7 % as of December<br />
31, <strong>2010</strong> compared to the same year-ago figure.<br />
INFRASTRUCTURE<br />
a On November 30, <strong>2010</strong> Dr. Heiner Geißler, who served as<br />
mediator, issued a concluding statement of results closing<br />
the Stuttgart 21 Project A mediation talks [2].<br />
a Measures related to the government’s A economic<br />
stimulus packages [3] continued to be implemented during<br />
the year under review.<br />
a During the year under review about 3,000 masts for overhead<br />
lines were erected on the 73-km-long Reichenbach – Hof<br />
line. The train-path was equipped with overhead lines as<br />
part of the electrification work.<br />
a The rail infrastructure operating companies, DB Netz <strong>AG</strong><br />
and Réseau Ferré de France (RFF), Paris /France, reached<br />
an agreement to cooperate closely in the area of rail<br />
infrastructure: the goal here is to simplify cross-border<br />
transport.<br />
a The signing of the financing agreement for the Haltingen –<br />
Weil am Rhein line and the Badische Station in Basel cleared<br />
the way for construction measures in the southern portion of<br />
the expanded and new sections of the Karlsruhe – Basel line.<br />
a The Essen central station was modernized at a cost of about<br />
€ 57 million.<br />
Additional information<br />
SERVICE AND FINANCING <strong>AG</strong>REEMENT TARGETS ARE MET<br />
The A Service and Financing Agreement (LuFV) [4] took<br />
effect in January 2009. Modifications to the LuFV negotiated<br />
during the year under review continued the further development<br />
of the Agreement as two new quality benchmarks, which already<br />
took effect in <strong>2010</strong>, were agreed upon. In addition, a more<br />
demanding quality standard was defined – reduction of longer<br />
travel times due to infrastructure deficiencies – for the entire<br />
lifetime of the LuFV. With the submission of the 2009 Infrastructure<br />
Status and Development <strong>Report</strong> we documented that we<br />
had kept the service promise we made. Furthermore, during the<br />
year under review we also met the contractually agreed targets.<br />
DB Netze Track business unit<br />
Selected key figures [ € million ] <strong>2010</strong> 2009 Change<br />
absolute %<br />
Train kilometers on track infrastructure (million train-path km) 1,032 1,001 + 31 + 3.1<br />
thereof non-Group railways 195.3 170.4 +24.9 +14.6<br />
Share of non-Group railways 18.9 % 17.0 % – –<br />
Total revenues 4,580 4,369 +211 + 4.8<br />
thereof external revenues 913 764 + 149 + 19.5<br />
EBITDA adjusted 1,524 1,472 + 52 + 3.5<br />
EBIT adjusted 601 558 + 43 +7.7<br />
Gross capital expenditures 4,986 4,624 + 362 +7.8<br />
Employees (FTE as of December 31) 39,849 40,354 – 505 –1.3<br />
PERFORMANCE DEVELOPMENT<br />
Demand for train-path is dependent on the operating programs<br />
of DB Group and non-Group customers. The intra-Group customers<br />
have a dominant 81 % of demand. Due to the recovery<br />
of business in the rail freight transport sector, demand generated<br />
by DB Group customers grew slightly over the same year-ago<br />
figure. Sharp gains in non-Group railways’ demand for train-path<br />
increased their share of demand to 19 % (previous year: 17 %).<br />
During the year under review total demand for train-path rose<br />
over the same year-ago period by 3.1 %, while non-Group railways’<br />
demand rose by 14.6 %.<br />
| [1] A Page 100 ff. | [2] A Page 121<br />
| [3] A Page 60<br />
| [4] A 2009 <strong>Annual</strong> <strong>Report</strong> Page 50
| GROUP MAN<strong>AG</strong>EMENT REPORT<br />
| Development of business units<br />
95<br />
BUSINESS DEVELOPMENT<br />
Revenues rose and were driven by higher volume due to higher<br />
demand for train-path. Price adjustments also contributed<br />
towards the increased revenues. The development of external<br />
revenues primarily reflects the notable increase in demand by<br />
non-Group railways.<br />
The cost of winter services rose notably during the year<br />
under review due to severe winter weather conditions at the<br />
start and end of <strong>2010</strong>. As a result the cost of materials increased<br />
significantly over the same year-ago period. Despite a slight<br />
drop in the number of employees, higher personnel expenses<br />
were posted due to higher wages.<br />
The improved development of revenues coupled with a slightly<br />
less-than-proportionate increase in expenses resulted in a € 52<br />
million increase in the adjusted EBITDA figure to € 1,524 million,<br />
while adjusted EBIT gained by € 43 million to € 601 million.<br />
The increase in gross capital expenditures was primarily<br />
driven by implementing A economic stimulus program [1]<br />
measures, as well as the higher net capital expenditures. The<br />
main emphasis may be found in the chapter A Capital expenditures<br />
[2].<br />
The number of employees declined slightly as of December 31,<br />
<strong>2010</strong> compared to the same year-ago figure.<br />
DB Netze Stations business unit<br />
Selected key figures [ € million ] <strong>2010</strong> 2009 Change<br />
absolute %<br />
Station stops (million) 140.9 140.5 + 0.4 + 0.3<br />
thereof non-Group railways 22.0 20.0 +2.0 + 10.0<br />
Total revenues 1,044 1,025 +19 +1.9<br />
thereof external revenues 387 373 +14 + 3.8<br />
EBITDA adjusted 343 342 +1 + 0.3<br />
EBIT adjusted 217 217 – –<br />
Gross capital expenditures 511 488 +23 + 4.7<br />
Employees (FTE as of December 31) 4,636 4,601 + 35 + 0.8<br />
PERFORMANCE DEVELOPMENT<br />
The number of station stops rose by 0.3 % during the year under<br />
review reflecting higher demand from non-Group customers.<br />
BUSINESS DEVELOPMENT<br />
The increase in the total revenues is due to higher revenues for<br />
station stops as well as increased rental and lease income. The<br />
increase in revenues received for station stops was primarily<br />
driven by higher prices while higher rental revenues were generated<br />
by the favorable development of retail sales. External<br />
revenues reflected the trend towards greater usage by non-Group<br />
railways.<br />
On the expense side both personnel expenses, due in particular<br />
to higher wages, and the cost of materials, because of<br />
greater maintenance costs, rose.<br />
On an overall basis increases noted for expenses and revenues<br />
almost completely balanced each other out so that adjusted<br />
EBITDA only rose slightly by € 1 million to € 343 million. Depreciation<br />
rose slightly over the same year-ago level by € 1 million<br />
so that the adjusted EBIT figure of € 217 million remained at the<br />
same year-ago level.<br />
Gross capital expenditures made during the year under<br />
review were significantly higher than the same year-ago figure.<br />
The increase was primarily driven by measures related to the<br />
A economic stimulus packages [1]. The main emphasis may<br />
be found in the chapter A Capital expenditures [2].<br />
The number of employees was higher on December 31,<br />
<strong>2010</strong> than on the same year-ago date. This change was due to<br />
the implementation of measures stemming from the economic<br />
stimulus packages and measures to enhance passenger safety.<br />
| [1] A Page 60<br />
| [2] A Page 100 ff.
96<br />
| DEUTSCHE BAHN GROUP<br />
DB Netze Energy business unit<br />
Selected key figures [ € million ] <strong>2010</strong> 2009 Change<br />
absolute %<br />
Traction current (GWh) 10,326 9,919 + 407 + 4.1<br />
Diesel fuel (million l) 480.8 469.0 +11.8 +2.5<br />
Total revenues 2,501 2,308 + 193 + 8.4<br />
thereof external revenues 816 645 +171 +26.5<br />
EBITDA adjusted 165 182 –17 – 9.3<br />
EBIT adjusted 82 103 –21 –20.4<br />
Gross capital expenditures 144 164 –20 –12.2<br />
Employees (FTE as of December 31) 1,536 1,574 –38 –2.4<br />
PERFORMANCE DEVELOPMENT<br />
Demand for traction current rose by 4.1 % during the year under<br />
review and was mainly driven by higher volume produced by<br />
customers in rail freight transport. We were also able to increase<br />
the sale of diesel fuel once again during the year under review.<br />
The main reason for this change was higher volume produced<br />
by customers in rail freight transport along with gains in regional<br />
transport.<br />
BUSINESS DEVELOPMENT<br />
Revenues posted by the DB Netze Energy business unit were<br />
8.4 % over the same year-ago figure during the year under review.<br />
This favorable development was primarily driven by the traction<br />
current business, as well as the additional expansion of our<br />
energy services business. This area bundles together all of our<br />
activities to market our know-how to industrial and commercial<br />
business companies that want to optimize their energy procurement<br />
management and take advantage of the opportunities<br />
available in the changing energy markets and regulatory environment.<br />
Development of revenues in the traction current segment<br />
reflected higher volume produced in rail transport which<br />
was driven by the economic recovery, as well as higher prices<br />
for power and diesel fuel in the energy procurement market that<br />
we were able to pass on to our customers. Development of our<br />
energy services business mirrored the substantial gains in revenues<br />
achieved in our power business as well as natural gas<br />
procurement business.<br />
The favorable development of volume coupled with higher prices<br />
to procure energy resulted in a noticeable increase in the cost<br />
of materials. Higher wages were the main reason behind our<br />
increased personnel expenses.<br />
Depreciation was slightly higher than the same year-ago<br />
figure due primarily to higher depreciation of intangible assets.<br />
Due to the greater-than-proportionate increase in expense<br />
items, the adjusted EBITDA figure fell by € 17 million to € 165 million,<br />
while adjusted EBIT decreased by € 21 million to € 82 million.<br />
Gross capital expenditures were below the same year-ago<br />
level. The main emphasis may be found in the chapter A<br />
Capital expenditures [1].<br />
The number of employees was almost unchanged as of<br />
December 31, <strong>2010</strong>.<br />
| [1] A Page 100 ff.
| GROUP MAN<strong>AG</strong>EMENT REPORT<br />
| Development of business units<br />
|<br />
Financial situation<br />
97<br />
Financial situation<br />
a Ratings confirmed in the year under review<br />
a Net financial debt rose because of Arriva acquisition<br />
a Gross capital expenditures again at high level<br />
FINANCIAL MAN<strong>AG</strong>EMENT<br />
DB <strong>AG</strong>’s Treasury serves as the central treasury for DB Group.<br />
This structure ensures that all Group companies are able to<br />
borrow and invest funds at optimal conditions.<br />
Before obtaining funds externally, we first conduct intra-<br />
Group financing transactions. When borrowing external funds,<br />
DB <strong>AG</strong> takes out short-term loans in its own name, whereas<br />
long-term capital is generally obtained through the Group’s<br />
financing company, <strong>Deutsche</strong> <strong>Bahn</strong> Finance (DB Finance) B.V.,<br />
Amsterdam/the Netherlands. These funds are passed on to<br />
DB ML<strong>AG</strong> companies within the framework of a dual-level treasury<br />
concept as time deposits or loans.<br />
DB Group’s infrastructure companies are linked directly to<br />
DB <strong>AG</strong>’s Treasury. This concept enables us to pool risks and<br />
resources for the entire Group, as well as to consolidate our<br />
expertise, realize synergy effects, and minimize refinancing costs.<br />
As of December 31, <strong>2010</strong> we had tapped our long-term debt<br />
issuance program of € 15 billion for a total of € 11.8 billion (as<br />
of December 31, 2009: € 9.3 billion).<br />
With respect to short-term financing, as in the previous<br />
year, a multi-currency multi-issuer commercial paper program of<br />
over € 2 billion was available as of December 31, <strong>2010</strong> and had<br />
been tapped for € 42 million as of December 31, <strong>2010</strong> (previous<br />
year: not used). Furthermore, as of December 31, <strong>2010</strong> we also<br />
had a guaranteed unused credit facility of € 2.5 billion (€ 1.8<br />
billion as of December 31, 2009). In addition, credit facilities of<br />
€ 1.4 billion were also available for our operational business as<br />
of the date of record (€ 1.3 billion as of December 31, 2009).<br />
These credit facilities, which are available to our subsidiaries<br />
around the world, include provisions for financing working<br />
capital, as well as sureties for payment.<br />
No major financed leasing transactions were concluded<br />
during the year under review. However, as part of the Arriva<br />
acquisition we assumed liabilities related to financed leasing<br />
transactions totaling € 296 million as of December 31, <strong>2010</strong>.<br />
Ratings reconfirmed<br />
Ratings DB <strong>AG</strong> First issued Last<br />
Current ratings<br />
confirmation<br />
Short-term Long-term Outlook<br />
Moodyʼs May 16, 2000 Nov 26, <strong>2010</strong> P-1 Aa1 stable<br />
Standard & Poorʼs May 16, 2000 Feb 17, 2011 A-1+ AA stable<br />
Fitch Feb 17, 2009 May 13, <strong>2010</strong> F1+ AA stable<br />
Information as of February 22, 2011<br />
DB Group’s creditworthiness is regularly examined by the rating<br />
agencies Standard & Poor’s (S & P), Moody’s and Fitch. During<br />
the year under review, S & P, Moody’s and Fitch conducted their<br />
annual rating reviews and subsequently reconfirmed DB <strong>AG</strong>’s<br />
good credit ratings. These ratings have remained unchanged<br />
since they were first issued.<br />
Additional information about our A ratings [1] as well as the<br />
rating agencies’ complete analyses of DB <strong>AG</strong> can be found on<br />
our Web site.<br />
| [1] A www.db.de/rating-e
98<br />
| DEUTSCHE BAHN GROUP<br />
CASH FLOW STATEMENT<br />
Summary [ € million ] <strong>2010</strong> 2009 Change<br />
absolute %<br />
Cash flow from operating activities 3,409 3,133 +276 + 8.8<br />
Cash flow from investing activities –3,479 –1,935 –1,544 +79.8<br />
Cash flow from financing activities 27 –615 +642 –<br />
Net change in cash and cash equivalents 5 591 – 586 – 99.2<br />
Cash and cash equivalents as of December 31 1,475 1,470 + 5 + 0.3<br />
The development of cash flow from operating activities during<br />
the year under review was marked by a slight decline in net<br />
working capital and by an improved figure for the item taxes on<br />
income. The decline in profits before taxes on income was due<br />
to the discontinuation of special items in the year under review,<br />
which, however, did not have a cash effect. Total cash flow from<br />
operating activities rose by € 276 million to € 3,409 million.<br />
The cash flow from investment activities during the year<br />
under review was especially influenced by the acquisition of<br />
A Arriva [1] with a purchase price of € 1.9 billion, which was<br />
the reason for the sharp increase in payments for acquisition of<br />
shares in consolidated companies less cash and cash equivalents<br />
(€ +1,420 million). The level of payments for purchases of property,<br />
plant and equipment and intangible assets, which was<br />
already quite high in the previous year, was increased (€ +378 million)<br />
during the year under review. In contrast, higher proceeds<br />
from investment grants (€ +170 million), which stemmed from<br />
additional funds provided by the Federal Government’s economic<br />
stimulus packages, were employed within the rail infrastructure<br />
area. The outflow of cash from investing activities rose in total<br />
by € 1,544 million to € 3,479 million.<br />
On the financing side, following the cash outflows noted<br />
to repay debt in the previous year, during the year under review<br />
cash inflows from financing activities affected the increase in<br />
financial debt that was acquisition driven. Higher proceeds from<br />
issue of bonds (€ +337 million) and lower payments for redemption<br />
of bonds (€ +367 million) were as equally noticeable as<br />
the higher proceeds from borrowings and commercial paper<br />
(€ +239 million). No Federal loans were recorded during the<br />
year under review. Payments for redemption of Federal loans<br />
during the year under review amounted to € 481 million, or<br />
€ 43 million more than in the previous year. The net cash flow<br />
from financing activities rose by € 642 million to € 27 million.<br />
As of December 31, <strong>2010</strong> DB Group had € 1,475 million in<br />
cash and cash equivalents available, which was almost unchanged<br />
in comparison to the € 1,470 million in cash and cash equivalents<br />
available on December 31, 2009.<br />
NET FINANCIAL DEBT<br />
[ € million ] Dec 31, <strong>2010</strong> Dec 31, 2009 Change<br />
absolute %<br />
Non-current financial debt 16,394 14,730 +1,664 +11.3<br />
thereof Federal loans 2,503 2,785 –282 –10.1<br />
Current financial debt 2,159 1,780 + 379 +21.3<br />
thereof Federal loans 433 491 – 58 –11.8<br />
FINANCIAL DEBT 18,553 16,510 +2,043 + 12.4<br />
– Cash and cash equivalents and receivables from financing 1,614 1,499 +115 +7.7<br />
NET FINANCIAL DEBT 16,939 15,011 +1,928 +12.8<br />
– Purchase price Arriva 1,916 – +1,916 –<br />
– Net financial debt DB Arriva 1,057 – +1,057 –<br />
NET FINANCIAL DEBT (EXCLUDING DB ARRIVA) 13,966 15,011 – 1,045 –7.0<br />
| [1] A Page 60
| GROUP MAN<strong>AG</strong>EMENT REPORT<br />
| Financial situation<br />
99<br />
Financial debt rose during the year under review by € 2,043 million<br />
to € 18,553 million. We issued five bonds with a total volume<br />
of € 2.5 billion; we redeemed one bond that had a nominal value<br />
of € 1.0 billion. Furthermore, in January <strong>2010</strong> we borrowed<br />
€ 200 million from EUROFIMA, Basel /Switzerland. The increase<br />
in financial debt was due to the acquisition of A Arriva [1].<br />
Excluding the acquisition, net financial debt was again reduced<br />
significantly (€ –1.0 billion).<br />
Total Federal loans decreased by € 340 million to € 2,936 million<br />
(as of December 31, 2009: € 3,276 million). Using IFRS as a<br />
basis for calculation, the present value of interest-free Federal<br />
loans fell by € 175 million to € 2,606 million (as of December 31,<br />
2009: € 2,781 million).<br />
Financial debt excluding Federal loans rose during the<br />
year under review to € 15,617 million (as of December 31, 2009:<br />
€ 13,234 million).<br />
Cash and cash equivalents available as of December 31, <strong>2010</strong><br />
increased by € 115 million to € 1,614 million. Liquidity was<br />
increased to enable repayment of financial debt due in January<br />
2011. Accordingly, net financial debt rose at a slower pace than<br />
financial debt.<br />
The structure of maturities was almost unchanged as<br />
of December 31, <strong>2010</strong>. There was a slight shift to short-term<br />
financial debt as their share of financial debt increased from<br />
11 % to 12%.<br />
The composition of financial debt remained almost<br />
unchanged as of December 31, <strong>2010</strong> and consisted primarily of<br />
bonds (64 %; as of December 31, 2009: 61 %) and Federal loans<br />
(16 %; as of December 31, 2009: 20 %).<br />
As of December 31, <strong>2010</strong>, 73.5 % of our outstanding bonds<br />
consisted of fixed income euro-denominated issues, while 26.5 %<br />
were fixed-income bonds denominated in a foreign currency. To<br />
avoid exchange rate risks we entered into interest-currency<br />
swaps with identical maturities for each transaction.<br />
FINANCIAL DEBT STRUCTURE AS OF DECEMBER 31, <strong>2010</strong><br />
By composition [%] By maturity [%]<br />
6<br />
6<br />
8<br />
64<br />
16<br />
Bonds<br />
Federal loans<br />
Finance lease liabilities<br />
EUROFIMA loans<br />
Bank borrowings<br />
57<br />
6<br />
7<br />
8<br />
10<br />
12<br />
Less than 1 year<br />
1–2 years<br />
2–3 years<br />
3 – 4 years<br />
4 – 5 years<br />
More than 5 years<br />
| [1] A Page 60
100<br />
| DEUTSCHE BAHN GROUP<br />
CAPITAL EXPENDITURES<br />
Gross capital expenditures by business unit [ € million ] <strong>2010</strong> 2009 Change<br />
absolute %<br />
DB <strong>Bahn</strong> Long-Distance 48 47 + 1 +2.1<br />
DB <strong>Bahn</strong> Regional 212 407 –195 – 47.9<br />
DB <strong>Bahn</strong> Urban 91 57 +34 + 59.6<br />
DB Schenker Rail 350 319 + 31 + 9.7<br />
DB Schenker Logistics 189 196 –7 –3.6<br />
DB Services 177 138 +39 +28.3<br />
DB Netze Track 4,986 4,624 + 362 +7.8<br />
DB Netze Stations 511 488 +23 + 4.7<br />
DB Netze Energy 144 164 –20 –12.2<br />
Other/Consolidation 12 22 –10 – 45.5<br />
DB GROUP (EXCLUDING DB ARRIVA) 6,720 6,462 + 258 + 4.0<br />
DB Arriva 171 – +171 –<br />
DB GROUP 6,891 6,462 + 429 + 6.6<br />
– Investment grants 4,819 4,649 +170 + 3.7<br />
NET CAPITAL EXPENDITURES 2,072 1,813 +259 +14.3<br />
STRUCTURE GROSS CAPITAL EXPENDITURES <strong>2010</strong><br />
By division [%]<br />
8<br />
8<br />
2<br />
82<br />
Passenger Transport<br />
Transport and Logistics<br />
Infrastructure<br />
Services<br />
During the year under review we underlined our long-term<br />
approach to business by making significantly higher gross capital<br />
expenditures of € 6,891 million, or about 7 % more than the<br />
same year-ago figure. Excluding DB Arriva, gross capital expenditures<br />
rose by 4.0 %.<br />
We made notably higher capital expenses in the infrastructure<br />
business units of DB Netze Track and DB Netze Stations<br />
(due to the A economic stimulus programs [1]) as well as in<br />
the DB Services and DB Schenker Rail business units.<br />
The structure of capital expenditures remained dominated by<br />
business units within the Infrastructure Board division – and<br />
above all, without change, by the DB Netze Track business unit.<br />
The infrastructure business units accounted for 82 % (previous<br />
year: 82 %) of total gross capital expenditures with the DB Netze<br />
Track business unit alone holding 72 % (in the previous year:<br />
72%). Business units in the Passenger Transport Board division<br />
held an 8 % share (previous year: 8 %) while business units in<br />
the Transport and Logistics Board division accounted for an<br />
unchanged 8 %. Broken down by regions, the vast majority (94%)<br />
of capital expenditures were again made in Germany.<br />
The main focus across DB Group was on measures to increase<br />
the performance and efficiency within the infrastructure sector,<br />
station modernization, as well as the additional rejuvenation<br />
of our vehicle parks in the rail and bus transport segments. In<br />
addition, we also invested in the further development of our<br />
logistics networks.<br />
Capital expenditures made within the DB <strong>Bahn</strong> Long-<br />
Distance business unit were primarily focused on vehicles and<br />
workshops. In the area of vehicles the main measures made<br />
were related to the redesign of the ICE 2; equipping the trains<br />
operating in France (BR 406 MF) with ETCS; and the installation<br />
of chassis frame diagnosis system in selected ICE 3 trains. Furthermore,<br />
capital expenses were also made to improve the<br />
infrastructure of our maintenance shops, especially in building<br />
| [1] A Page 60
| GROUP MAN<strong>AG</strong>EMENT REPORT<br />
| Financial situation<br />
101<br />
shops for internationalization tasks, for procurement of additional<br />
ultrasound testing facilities, as well as the continuation<br />
of construction of the new Leipzig workshop.<br />
The focal point of capital expenditures made in the DB <strong>Bahn</strong><br />
Regional business unit was on vehicles. In the area of rail transport<br />
the main emphasis was on the concluded transport contracts<br />
(including the S-<strong>Bahn</strong> (metro) Nuremberg) and the newly won<br />
tenders (including E-Network Würzburg, Munich–Passau,<br />
E-Network Augsburg and the Nuremberg diesel network). In<br />
addition, capital expenditures were also made for modernization<br />
purposes for the Südpfalz (Southern Palatinate) tender. Furthermore,<br />
investments were made in the infrastructure for vehicle<br />
maintenance and fitting. The decrease in capital expenditures<br />
in comparison to the previous year was due to delays in the<br />
deliveries of new vehicles because EBA certification had not<br />
been issued and because of defects and delivery delays on the<br />
part of manufacturers.<br />
Capital expenditures made in the DB <strong>Bahn</strong> Urban business<br />
unit were above the same year-ago level and were focused on<br />
the procurement of vehicles.<br />
The main emphasis of capital expenditures made in the DB<br />
Schenker Rail business unit was on renewing our fleet of freight<br />
cars and locomotives as part of the continuation of our multiyear<br />
modernization program, as well as the expansion of our<br />
international business activities through the operation of multisystem<br />
locomotives.<br />
The vast majority of capital expenditures in the DB Schenker<br />
Logistics business unit were made in Europe. The biggest individual<br />
projects involved the expansion of our freight forwarding<br />
facilities in Germany, France, Switzerland, Sweden and the USA,<br />
as well as projects to introduce new operational IT systems.<br />
Within the DB Services business unit, DB Fleet Management<br />
made capital expenditures to replace road vehicles and DB Systel<br />
made investments to replace and expand hardware and software.<br />
INVESTMENT GRANTS <strong>2010</strong><br />
Investment grants [%] Contributors [%]<br />
90<br />
DB Netze Track<br />
DB Netze Stations<br />
DB Netze Energy<br />
Other<br />
Federal Republic of Germany<br />
Federal states<br />
EU<br />
Other<br />
1<br />
1<br />
8<br />
1 3<br />
9<br />
87<br />
Investment grants were mainly issued to procure or make property, plant and<br />
equipment in the infrastructure sector. The grants were primarily made by the<br />
Federal Republic of Germany, although German Federal states, municipalities<br />
and /or the European Union also make grants to companies, which are primarily<br />
railway infrastructure companies within DB Group.<br />
After the facilities have been completed, investment grants are deducted from<br />
the cost to procure or make the property, plant and equipment. As a result,<br />
the facilities are shown at a lower book value and therefore incur lower depreciation<br />
charges. An overview of the various types of investment grants may<br />
be found in the Internet A [1].<br />
| [1] A www.db.de/capex
102<br />
| DEUTSCHE BAHN GROUP<br />
The DB Netze Track business unit invested in measures to<br />
strengthen the performance capabilities of the existing network,<br />
especially through programs to improve track installations,<br />
command and control technology, modernize bridges, railway<br />
crossings and tunnels as well as noise abatement measures.<br />
In addition, the focus was also on major projects including<br />
Nuremberg–Erfurt, Erfurt–Halle/Leipzig, the Berlin-Schönefeld<br />
BBI airport connection, VDE 9 Leipzig–Dresden/S1 Dresden–<br />
Coswig, Augsburg–Olching, Stuttgart 21, Karlsruhe–Basel,<br />
Leipzig–Dresden, ABS Berlin–Cottbus.<br />
Capital expenditures made in the DB Netze Stations business<br />
unit were dominated by final work and expansion measures<br />
at the Berlin central station main buildings (Bügelbauten),<br />
Stuttgart 21, S-<strong>Bahn</strong> (metro) Nuremberg–Ansbach, S-<strong>Bahn</strong><br />
(metro) Nuremberg–Neumarkt, Rosenheim, Essen central station,<br />
various fire prevention measures, as well as further modernization<br />
measures across the country (including the North<br />
Rhine Westphalia modernization offensive).<br />
The focus of capital expenditures made by the DB Netze<br />
Energy business unit was on the nationwide renewal of substations<br />
within the 110-kV traction current network, as well as the<br />
construction of switching stations.<br />
BALANCE SHEET<br />
Balance sheet structure [ € million ] Dec 31, <strong>2010</strong> Dec 31, 2009 Change<br />
absolute %<br />
Total assets 52,003 47,303 + 4,700 + 9.9<br />
ASSET SIDE<br />
Non-current assets 44,530 41,308 +3,222 +7.8<br />
Current assets 7,473 5,995 + 1,478 +24.7<br />
EQUITY AND LIABILITIES<br />
Equity 14,316 13,066 +1,250 + 9.6<br />
Non-current liabilities 24,762 23,359 +1,403 + 6.0<br />
Current liabilities 12,925 10,878 +2,047 +18.8<br />
ASSET SIDE STRUCTURE<br />
Non-current assets 85.6 % 87.3 % – –<br />
Current assets 14.4 % 12.7 % – –<br />
EQUITY AND LIABILITIES STRUCTURE<br />
Equity 27.5 % 27.6 % – –<br />
Non-current liabilities 47.6 % 49.4 % – –<br />
Current liabilities 24.9 % 23.0 % – –<br />
The Group’s consolidated financial statements are prepared in<br />
accordance with International Financial <strong>Report</strong>ing Standards<br />
(IFRS). There were no relevant changes to the IFRS regulations,<br />
and no changes to the Group’s consolidation and accounting<br />
principles. Thus, there were no changes affecting the basis for<br />
preparing the Group’s consolidated financial statements during<br />
the period under review.<br />
Changes to the scope of consolidation did have a notable effect<br />
on the development of balance sheet figures during the year<br />
under review. As of December 31, <strong>2010</strong> total assets increased by<br />
€ 4,700 million, or 9.9 %, to € 52,003 million (as of December 31,<br />
2009: € 47,303 million).<br />
Non-current assets amounted to € 44,530 million and were<br />
7.8 %, or € 3,222 million, higher than the same figure at the end<br />
of the previous year (as of December 31, 2009: € 41,308 million).<br />
This change was primarily driven by the increase in the value of<br />
intangible assets of € 2,070 million as of December 31, 2009 to<br />
€ 4,154 million as of December 31, <strong>2010</strong>, due primarily to the<br />
acquisition of Arriva. Property, plant and equipment rose by<br />
€ 434 million to € 37,873 million.
| GROUP MAN<strong>AG</strong>EMENT REPORT<br />
| Financial situation<br />
103<br />
As of December 31, <strong>2010</strong> the value of current assets rose substantially<br />
by 24.7 %, or € 1,478 million to € 7,473 million (as of<br />
December 31, 2009: € 5,995 million). The reason for this change<br />
was the € 847 million increase in the volume of trade receivables<br />
due to an increase noted for the DB Schenker Logistics business<br />
unit.<br />
Structurally, this resulted in a slight shift toward current<br />
assets.<br />
The major changes noted on the equity and liabilities side<br />
of the balance sheet as of December 31, <strong>2010</strong> took place in the<br />
areas of equity and financial debt. Equity increased by € 1,250<br />
million, or 9.6 %, to € 14,316 million (as of December 31, 2009:<br />
€ 13,066 million) because of higher profits. Due to the stronger<br />
increase in total assets the equity capital ratio slipped slightly<br />
from 27.6 % as of December 31, 2009 to 27.5 % as of December<br />
31, <strong>2010</strong>. After adjusting for the acquisition of Arriva the equity<br />
capital ratio increased to 30.1 %.<br />
The primary change noted to non-current liabilities was<br />
the 11.3 %, or € 1,664 million, increase in non-current financial<br />
debt as of December 31, <strong>2010</strong>.<br />
Current liabilities posted a significant 18.8 %, or € 2,047<br />
million, increase over the same year-ago date as of December<br />
31, <strong>2010</strong>. The increase was mainly attributable to an increase<br />
in trade liabilities (€ +1,019 million) and the increase in current<br />
financial debt (€ +379 million).<br />
In total, A financial debt [1] grew by 12.4 %, or € 2,043<br />
million and the share of total assets represented by non-current<br />
liabilities decreased accordingly as of December 31, <strong>2010</strong>.<br />
In contrast, the share held by current liabilities rose as of<br />
December 31, <strong>2010</strong>.<br />
Off-balance-sheet financing instruments<br />
and non-recognized assets<br />
In addition to the assets shown in the Group’s consolidated<br />
balance sheet, DB Group also uses off-balance-sheet financing<br />
instruments and assets that cannot be recognized in the balance<br />
sheet.<br />
The off-balance-sheet financing instruments primarily refer<br />
to leased or rented goods (operate leases). A present value is<br />
calculated within the value management system for A operate<br />
leases [2]. As of December 31, <strong>2010</strong> this amounted to € 4,610<br />
million (as of December 31, 2009: € 4,105 million). The increase<br />
was mainly due to the acquisition of A Arriva [3] where<br />
operate leases are used to finance rail and road transport vehicles.<br />
DB Arriva has entered into operating lease contracts, in<br />
some cases due to regulatory requirements, especially in conjunction<br />
with making vehicles available for rail passenger and<br />
road passenger transport.<br />
Regarding retirement benefit obligations for employees,<br />
obligations for each retirement plan are covered by their respective<br />
pension scheme and are offset by plan assets which are<br />
capable of being netted. As of December 31, <strong>2010</strong> total obligations<br />
amounted to € 4,844 million (as of December 31, 2009:<br />
€ 3,104 million), the fair value of plan assets was € 2,442 million<br />
(as of December 31, 2009: € 1,010 million) and the net liability<br />
recognized in the balance sheet amounted to € 1,938 million (as<br />
of December 31, 2009: € 1,736 million). Additional information<br />
may be found in the A Notes [4].<br />
DB Group does not use off-balance-sheet special purpose<br />
entities. This is why off-balance-sheet financing instruments are<br />
of no significance for DB Group’s asset situation. Additional<br />
off-balance-sheet financing instruments, like factoring, are not<br />
used in DB Group.<br />
Exercising balance sheet voting rights<br />
For more information on A exercising balance sheet voting<br />
rights [5], please see the Notes.<br />
| [1] A Page 98 f.<br />
| [2] A Page 80<br />
| [3] A Page 60<br />
| [4] A Page 217 ff.<br />
| [5] A Page 150 ff.
104 | DEUTSCHE BAHN GROUP<br />
Strategy<br />
a Economic and financial crisis successfully mastered<br />
a Vision and strategy confirmed<br />
a Customer and quality initiative started<br />
ECONOMIC AND FINANCIAL CRISIS<br />
SUCCESSFULLY MASTERED<br />
-<br />
cial crisis and incurred substantial declines in our revenues and<br />
profits in 2009. However, we recovered significantly during the<br />
year under review and got back on track for growth just as before<br />
the crisis.<br />
Two factors played a decisive role in our rapid recovery: first,<br />
we decisively counteracted the impact of the crisis with our<br />
Group-wide reACT program. And, secondly, the structure of our<br />
business portfolio as an integrated group proved its worth.<br />
Especially during the crisis our integrated approach towards<br />
strategy, organization and management, as well as the related<br />
linkage of the individual business units to realize the benefits<br />
of synergies and network strengths, had a stabilizing effect.<br />
VISION AND STRATEGY CONFIRMED<br />
PASSENGER TRANSPORT<br />
TRANSPORT AND LOGISTICS<br />
RAIL SYSTEM IN GERMANY<br />
INFRASTRUCTURE
| GROUP MAN<strong>AG</strong>EMENT REPORT<br />
| Strategy<br />
105<br />
We are currently already well positioned in all of the relevant<br />
mobility and logistics markets. Our goal is to become the world’s<br />
leading mobility and logistics company. This goal entails providing<br />
customers innovative and individual mobility and logistics<br />
solutions from a single source, linking modes of transport<br />
together economically, ecologically and intelligently, and setting<br />
standards for quality and customer satisfaction while we continue<br />
to expand our leading positions.<br />
These strategic goals and the related demands remain valid<br />
and continue to shape our strategic direction. We want to achieve<br />
this based on our core competence – the efficient and reliable<br />
operation of transport networks – and our strong position in<br />
the heart of Europe. And at the same time our growth is being<br />
driven forward by the long-term megatrends in the transport<br />
markets – globalization, climate change, scarcer resources,<br />
deregulation and demographic change – which are supporting<br />
our future development.<br />
Globalization<br />
A significant increase in the volume of global transport is clearly<br />
visible as the economic and financial crisis fades and the global<br />
economy recovers. It is expected that the growing recovery of<br />
the global economy will again add momentum to the effects of<br />
globalization. At the same time it may also be expected that the<br />
development of business will be considerably more volatile in<br />
the future. Demand for global transport and logistical solutions<br />
will be favorably influenced by the deepening global division of<br />
labor, shifting production facilities around the world, and the<br />
rapidly growing markets in Asia and Eastern Europe. We want<br />
to participate in this growth and offer our customers tailor-made<br />
solutions across all modes of transport flanked by supplementary<br />
logistical services.<br />
CUSTOMERS AND QUALITY INITIATIVE – IMPROVE QUALITY AND RAISE CUSTOMER SATISFACTION<br />
We are continually working to enhance the attractiveness of rail transport and<br />
position rail as the mode of transport of the future. To achieve this goal it is<br />
imperative to permanently increase customer satisfaction. With this goal in<br />
mind we launched a customer and quality initiative at the start of the year<br />
under review, which systematically develops concepts across business units<br />
and ensures that service promises made to customers are being kept. Within<br />
the framework of the customer and quality initiative we also began to implement<br />
additional measures to improve customer service and further increase<br />
the stability and robustness of our operations.<br />
This means specifically:<br />
a we increase reliability,<br />
a we improve comfort and service along the entire travel chain, and<br />
a we ensure that our customers are sufficiently informed – even during<br />
special situations – and that they receive good service.<br />
The entire portfolio consists of eleven projects in regional and long-distance<br />
transport, freight transport as well as in the infrastructure. In view of the<br />
experience gained in 2009, the main focus of the project was on preparations<br />
for the fall and winter to ensure the highest possible level of operational quality<br />
even in difficult situations caused by inclement weather. An extensive catalog<br />
of long- and short-term measures was approved.<br />
One of the immediate short-term measures referred to long-distance<br />
transport and particularly to measures ensuring the availability of vehicles.<br />
These measures include lowering speed to reduce the number of vehicles<br />
sidelined by flying ballast, as well as additionally equipping vehicles to protect<br />
them against weather-related damages. Concurrently, the winter schedule,<br />
which was published in mid-December <strong>2010</strong>, was adjusted to reflect available<br />
vehicle capacities. In the infrastructure area the goal was to achieve greater<br />
availability of the network by improving coordination among operational<br />
personnel.<br />
An additional focal point of the customer and quality initiative is the<br />
intensification of the level of service provided to customers by, for example,<br />
increasing the number of service and security personnel in local transport<br />
trains, or by simplifying complaint procedures, as well as expanding the range<br />
of services offered to handicapped travelers in train stations.<br />
There is still room for improvement, especially in the area of passenger<br />
information. In addition to the immediate measures, over the long-term<br />
we will ensure that passengers receive consistent access to information by<br />
optimizing data processes and increasing the number of service personnel<br />
in train stations.<br />
Furthermore, we will employ a continuous monitoring process to<br />
observe the implementation of the measures, as well as the planned increase<br />
in customer satisfaction.
106<br />
| DEUTSCHE BAHN GROUP<br />
Climate change and scarcer resources<br />
Climate change and scarcer resources remain major challenges,<br />
especially for the transport markets. The transport sector is<br />
known as one of the biggest generators of climate-damaging<br />
carbon dioxide (CO 2 ), and thus global warming. This is why we<br />
anticipate that in the future, governments and customers in<br />
Germany and abroad will significantly increase their efforts to<br />
decrease CO 2 in the transport and mobility sector. These developments<br />
will be flanked by the expected increase in prices for<br />
fossil fuels, as well as rising awareness of the changing climate<br />
and greater demand for energy-efficient and environmentally<br />
friendly transport services. We want to benefit from this trend<br />
and play a leading role in developing the market for climatefriendly<br />
mobility and transport offers. We will achieve this by<br />
supporting our customers in their efforts to reach their environmental<br />
targets with our environmentally friendly transport<br />
services, and by further reducing our own CO 2 emissions.<br />
Deregulation<br />
The deregulation and opening of the transport markets is being<br />
pushed at both the European and national levels. Following the<br />
complete liberalization of the European rail freight transport<br />
market in 2007, the European long-distance transport market<br />
was opened at the start of the year under review. This reform<br />
permits every European TOC to operate cross-border lines. This<br />
opens up potential opportunities for us in Europe which are<br />
already being realized in Germany by international transport<br />
companies. However, it is necessary that certain countries, like<br />
France and Italy, accelerate the pace of their hitherto listless<br />
implementation of liberalization measures in their markets.<br />
Our long-term goal is to play a substantial role in shaping<br />
the rail transport networks in Europe, as well as securing our<br />
central position in the heart of Europe to further expand our<br />
operations.<br />
Demographic change<br />
Future demographic changes will lead to a change in mobility<br />
behavior. These changes include, in particular, population concentrations<br />
in major metropolitan areas, diverging business<br />
development in individual regions, as well as the increasing<br />
flexibility of employed persons. We want to realize the resulting<br />
growth potential and we will decisively adjust our transport<br />
solutions to the changing mobility needs.<br />
CLEAR STRATEGIC THRUST<br />
Our strategic thrust is clearly defined: based on a strong core<br />
business in Germany our goal is to continue our progress by<br />
introducing new products and entering new markets. We introduced<br />
four special initiatives aimed at helping us achieve this<br />
goal: customers and quality, engineering, capital expenditures<br />
and our market initiative.<br />
Strengthening our core business<br />
We are continuing to further develop from our core business<br />
platform. In doing so we are pursuing the goal of sustainable<br />
stability as well as reinforcing our core business by increasing<br />
the quality and efficiency of our operations. Customer-oriented<br />
service measures are being expanded by the customer and<br />
quality initiative while ensuring that the quality of our operations<br />
is also being improved. Along with these measures the engineering<br />
initiative is focused on raising the levels of safety and<br />
quality in our operations and optimizing collaboration between<br />
us and the industrial sector. After all, the capital expenditure<br />
initiative involves significantly higher quality derived from investments<br />
made to procure new vehicles, modernize the infrastructure,<br />
as well as harmonizing the IT landscape.<br />
Development of new offers<br />
We want to exploit possible synergies within our business portfolio<br />
even better than in the past so we can offer our customers<br />
improved and new attractive offers. Furthermore, we also want<br />
to realize inter-modal potential to reduce costs. Our emphasis<br />
here is on the further expansion of integrated offers by intelligently<br />
linking different modes of transport together.<br />
We must take ecological challenges into consideration when<br />
we create new mobility and logistical solutions, and when we<br />
further develop existing solutions. In order to operate our transport<br />
networks in a sustainable and future-oriented manner we<br />
have set ourselves the goal of reducing the CO 2 emitted by our<br />
rail, road, air and waterway transports by 20 % (in comparison<br />
to 2006) by 2020.<br />
Expand and strengthen transport networks<br />
Future-capable transport networks require continuous expansion<br />
into new markets. Within the framework of the market initiative<br />
we are realizing the opportunities involved in developing and<br />
strengthening transport networks based on customer needs.<br />
The advancing liberalization of our home market, in particular,<br />
requires us to expand our business activities into new markets<br />
outside of Germany. The acquisition of the British transport<br />
company A Arriva [1] during the year under review enabled<br />
| [1] A Page 60
| GROUP MAN<strong>AG</strong>EMENT REPORT<br />
| Strategy<br />
107<br />
us to expand our European passenger transport network thereby<br />
taking a major step forward towards becoming an international<br />
provider of mobility services. In addition to growing our transport<br />
networks, we also want to further strengthen existing networks<br />
and achieve an optimal level of integration.<br />
Parallel to these activities we also want to market our railway<br />
know-how to a greater extent than we have in the past, thereby<br />
making a decisive contribution towards the global Renaissance<br />
of rail. We will achieve this by marketing the experience we have<br />
gained in planning complex transport networks around the world<br />
thereby creating the prerequisites to win follow-up assignments.<br />
The 49 % stake we obtained in the Qatar Railways Development<br />
Company (QRDC) in the previous year was an important step in<br />
this direction.<br />
In addition to these developments we also want to use rail’s<br />
advantages as an environmentally friendly and energy-saving<br />
mode of transport to a greater extent in the future by offering<br />
innovative solutions and green products. For example, the<br />
Hamburg S-<strong>Bahn</strong> (metro), which received the ÖkoGlobe<br />
<strong>2010</strong> award, and regional transport in Saarland have been solely<br />
using traction current generated from renewable sources of<br />
energy since <strong>2010</strong>.<br />
Growth opportunities are limited in Germany due to the<br />
open access to the German transport market and the resulting<br />
intensive competitive situation in the rail transport market. We<br />
want to actively shape the development of the European passenger<br />
transport market and use our new cross-border offers to<br />
encourage more competition in addition to further expanding<br />
our international transport network.<br />
INTEGRATED MOBILITY IN GERMANY AND<br />
POSITIONING IN EUROPE<br />
Within the German passenger transport sector we are further<br />
raising the performance capabilities of our rail products and<br />
integrating individual services to form comprehensive mobility<br />
solutions. This means that we are linking various transport modes<br />
together and offering our customers flexible door-to-door solutions<br />
from a single source. In doing so we enable the creation<br />
of complete end-to-end travel chains, thereby offering a competitive<br />
and ecologically beneficial alternative to motorized<br />
individual transport.<br />
We work closely with our end-customers, as well as other<br />
companies and policymakers when we develop additional<br />
products for our range of mobility offers. This is because we<br />
operate efficient and integrated transport networks in the local<br />
and long-distance transport sectors. The links in these networks<br />
are being continually improved in line with customer requirements,<br />
thereby generating optimized connection possibilities<br />
to make time-saving transports a reality.<br />
By integrating various individual systems into a comprehensive<br />
offer we provide our customers all of the needed travel<br />
information and make it easier for them to book various mobility<br />
options from a single source. This linkage and the possibility to<br />
bundle transport together allows customers to reduce their<br />
mobility costs and benefit from a more comprehensive offer<br />
both in terms of national and international travel. We are working<br />
together with various partners to develop the electronic A<br />
Touch & Travel [1] system that allows customers to use a mobile<br />
phone as a ticket for various modes of transport.<br />
DB <strong>Bahn</strong> Long-Distance business unit<br />
The key focus of the DB <strong>Bahn</strong> Long-Distance business unit<br />
remains on stabilizing the availability of its fleet. Our goal is to<br />
increase the quality of long-distance transport and provide our<br />
customers reliable transport services. This is the only way we<br />
will be able to make a competitive offer of fast and very frequent<br />
connections between major metropolitan areas in Germany and<br />
destinations in the rest of Europe.<br />
In order to achieve this goal in the future we launched our<br />
A customer and quality initiative [2] at the start of <strong>2010</strong>. The<br />
focal points of this program include expanding customer-oriented<br />
service measures and increasing the reliability of operations.<br />
We are underlining the importance of this effort by making<br />
additional capital expenditures and increasing the number of<br />
specially trained personnel. We have placed the highest priority<br />
on the realization of these measures in order to strengthen our<br />
position in our core market of Germany and to further expand<br />
our share of the intermodal market.<br />
Based on our strength in our home market we will continue<br />
to use the opportunities to grow within the European rail passenger<br />
long-distance transport sector. By continually expanding<br />
our cross-border routes in Europe we want to offer our customers<br />
attractive alternatives, especially on long-distance stretches, to<br />
traveling via plane or personal car.<br />
In order to achieve our sustainability goals we are also<br />
offering the first CO 2 -free travel offers for private customers in<br />
addition to our successful CO 2 offer for business travel.<br />
| [1] A www.touchandtravel.de<br />
| [2] A Page 105
108<br />
| DEUTSCHE BAHN GROUP<br />
DB <strong>Bahn</strong> Regional business unit<br />
Our goal in the German regional rail transport market is to secure<br />
our strong market position over the long term within the intensive<br />
competitive environment where we do business. As a result<br />
of the licensed release of brand rights and the publication of<br />
revenue information in conjunction with transport contracts, we<br />
have made it clear that we want to convince customers competitively<br />
based on our high levels of productivity and quality.<br />
Local profit and loss responsibility was strengthened by the<br />
creation of a regional structure with individual partial networks<br />
which are close to the market. We launched a A customer<br />
and quality initiative [1] to increase customer satisfaction.<br />
Among the key points of the initiative are an increase in security<br />
personnel, as well as additional capital expenditures for improving<br />
the cleanliness and comfort features onboard our fleet of vehicles.<br />
The stabilization of S-<strong>Bahn</strong> (metro) operations in Berlin is<br />
an important goal of the DB <strong>Bahn</strong> Regional business unit.<br />
Our focus in the bus transport segment is on securing our<br />
share of market. We procured more than 250 MAN buses and<br />
invested in innovative operating control systems during the year<br />
under review to enhance both customer comfort and the presentation<br />
of comprehensive transport information. We place<br />
special attention on meeting the needs of handicapped persons.<br />
In addition, we are continuing our efforts to implement a single<br />
brand identity for our entire fleet.<br />
Within the framework of the Federal Government’s initiated<br />
liberalization of long-distance scheduled bus services in Germany,<br />
we will position ourselves with attractive and high-quality offers<br />
within the newly regulated market.<br />
DB Arriva business unit<br />
The acquisition of the British passenger transport company A<br />
Arriva [2], one of the most successful private local transport<br />
companies in Europe, marked a decisive step for us towards<br />
developing the European market. As a result of the acquisition<br />
we advanced to become one of the leading companies in the<br />
European passenger local transport sector. In addition to Germany<br />
we are now present in 11 additional European passenger transport<br />
markets. The 12th European country will follow in mid-<br />
2011 when we inaugurate bus services in Malta.<br />
This provides our internationalization strategy for passenger<br />
transport with a significant growth platform we can use to<br />
continue advancing the favorable development of our international<br />
passenger transport activities in the future.<br />
Arriva’s business activities, which were successfully established<br />
in previous years, will – in combination with our existing<br />
foreign business, our know-how in the operation of complex<br />
transport systems and our financial strength – help to generate<br />
additional profitable growth. In the future all of the local transport<br />
activities outside of Germany will be bundled together<br />
under the management of the new DB Arriva business unit.<br />
This also applies to existing activities in Denmark, Great Britain<br />
and Sweden.<br />
The integration of DB Arriva in our Passenger Transport<br />
division as a stable third pillar alongside the DB <strong>Bahn</strong> Long-<br />
Distance and DB <strong>Bahn</strong> Regional business units is currently the<br />
focal point of our activities. A coordinated approach will ensure<br />
that internal resources are used efficiently. Specially targeted<br />
programs are being initiated to realize synergies in different<br />
areas, exchange experience and expert know-how, and to foster<br />
cooperation so we can become even better.<br />
EFFICIENT GLOBAL NETWORKS<br />
AND LOGISTICS EXPERTISE<br />
Under the DB Schenker brand name we have positioned ourselves<br />
as one of the world’s leading transport and logistics service<br />
providers. We have achieved this because of our tightly knit<br />
networks in European rail freight transport, European land<br />
transport, global air and ocean freight as well as industry-specific<br />
expertise in global contract logistics. This structure enables us<br />
to fulfill the growing expectations of our customers in terms of<br />
handling global transport and integrated offerings.<br />
DB Schenker’s strategy is based on three strategic thrusts<br />
that were proven stable and successful even during the economic<br />
crisis. They are:<br />
a the continued optimization of our core business,<br />
a the further development of our transport networks, and<br />
a the expansion of integrated services and industry solutions.<br />
The transport sector will have a key role to play in view of the<br />
increasing importance of climate change. DB Schenker’s goal is<br />
to become the leading green logistics service provider and to<br />
decouple transport growth from CO 2 emissions.<br />
| [1] A Page 105<br />
| [2] A Page 60
| GROUP MAN<strong>AG</strong>EMENT REPORT<br />
| Strategy<br />
109<br />
DB Schenker Logistics business unit<br />
The DB Schenker Logistics business unit holds leading market<br />
positions in every market segment – European land transport,<br />
ocean and air freight as well as contract logistics – which we<br />
intend to further expand in the coming years. Important prerequisites<br />
for attaining this goal are improving profitability by<br />
upgrading the IT landscape, expanding the scope of new highmargin<br />
products and reducing costs.<br />
DB Schenker Logistics is the market leader in the European<br />
land transport sector. By implementing measures to increase<br />
productivity, we are working to improve our profitability, which<br />
decreased partly in response to the economic crisis. In addition,<br />
we are supplementing our product portfolio by further developing<br />
pan-European direct transports, and we intend to continue<br />
expanding and closing gaps in the European network.<br />
In the areas of air and ocean freight, we plan to further<br />
develop our competitive positions and to increase our costeffectiveness<br />
through simplified and standardized processes as<br />
well as a corresponding, centrally managed IT system. Ultimately,<br />
the increased focus on trade routes with strong growth and high<br />
profit margins will generate an additional source for higher<br />
profitability.<br />
In the area of contract logistics/SCM, the worldwide growth<br />
program “Go for Growth” was further expanded, with a focus<br />
on the four core industries: Industrial, Consumer, Electronics<br />
and Automotive. Our objective is to grow faster than the market,<br />
thereby improving profitability in the area of contract logistics.<br />
DB Schenker Rail business unit<br />
DB Schenker Rail is the leading rail freight transport company<br />
in Europe, with a close-knit international network. This allows<br />
us to offer our customers a single source for their needs with<br />
uniform quality standards. Based on this strategy we have continually<br />
gained market share in Europe over the past few years<br />
and evolved from a national network provider to a European rail<br />
freight transport company. This transformation is ongoing as<br />
evidenced – not lastly – by the current integration of DB Schenker<br />
Rail Polska.<br />
Due to the permanently changing overall conditions in the<br />
market, however, it is still vital that we position ourselves flexibly,<br />
create competitive production and cost structures, and<br />
implement internationally established quality standards. In order<br />
to stay abreast of this development, we are pursuing three<br />
strategic directions:<br />
a further developing the European network by integrating<br />
companies and expanding partnerships (e.g. A Xrail [1]);<br />
a modernizing and focusing production by exploiting synergies<br />
(e.g. networked rail);<br />
a working closely with customers through customer-specific<br />
solutions (e.g. industry solutions and “green” solutions).<br />
The central projects for implementing these thrusts are being<br />
driven via our strategic program “ProRail plus.” In this way, we<br />
are pursuing the goal of being our customers’ first contact for<br />
rail network solutions in Europe.<br />
A SINGLE SOURCE FOR HIGH-QUALITY SERVICES<br />
The DB Services business unit provides services for DB Group<br />
companies in the areas of vehicle maintenance, information<br />
technology, telecommunication services, facility management,<br />
security services and fleet management. By lowering intra-Group<br />
costs for services while simultaneously securing a marketable<br />
quality and service level, the DB Services business unit makes<br />
a significant contribution to the future of DB Group. In particular,<br />
it achieves this by additionally integrating the customers’ valueadded<br />
chains, by enhancing synergies within the Group, by using<br />
non-Group business to ensure capacity utilization and to benchmark<br />
quality and prices.<br />
DB Services also plays an active role in creating job security<br />
within DB Group by consistently offering a large number of<br />
positions to employees from the Group-wide job market.<br />
GUARANTEEING A RELIABLE AND<br />
AFFORDABLE INFRASTRUCTURE<br />
The Infrastructure business units are the basis for safe, reliable<br />
and efficient rail transport in Germany. They provide a wide<br />
range of products and expertise relating to lines, systems, stations<br />
and energy supply. In doing so, the business units focus<br />
on the needs of their customers and passengers, rail transport<br />
companies, retail and service companies as well as the contracting<br />
authorities – and they structure their service offerings and<br />
associated pricing systems for using the infrastructure on a<br />
non-discriminatory basis. The Infrastructure business units will<br />
continue to act as commercial enterprises, minimizing production<br />
costs and further improving profits, in order to secure rail’s<br />
competitive advantage as a mode of transport in the long term.<br />
| [1] A Page 89
110<br />
| DEUTSCHE BAHN GROUP<br />
Against the background of the globalization of transport flows<br />
and changing demographic changes in Germany, it is important<br />
to address the increasingly asymmetrical utilization of the rail<br />
infrastructure’s capacities. Passengers should be able to access<br />
attractive mobility offerings in the long term, even outside the<br />
major metropolitan areas. The economic stimulus packages<br />
passed by the Federal Government to develop the infrastructure<br />
provide us with an additional opportunity to modernize our<br />
stations, lines and facilities and to adapt our performance<br />
capabilities to the increased transport flows forecast for the<br />
medium term.<br />
DB Netze Track business unit<br />
Our network development strategy forms the long-term basis<br />
for high-quality, reliable and safe rail transport offerings. Expansion<br />
and new construction measures will be used to eliminate<br />
bottlenecks and create sufficient capacity for future transport<br />
developments. Another focus is on cost-optimized and needbased<br />
modernization and maintenance measures for the existing<br />
rail network. The creation of an integrated capital expenditures<br />
and maintenance plan, as well as bundling construction sites<br />
into corridors and integrating them into the annual train schedule,<br />
will ensure an efficient use of resources and minimize the impact<br />
of extensive construction activities on our customers in the<br />
passenger and freight transport segments.<br />
In order to ensure sustainable, high-quality infrastructure<br />
and a high level of availability of the rail network in Germany,<br />
we concluded a long-term infrastructure partnership with the<br />
Federal Government in the form of the Service and Financing<br />
Agreement.<br />
In addition, resources from the Federal economic stimulus<br />
programs are being used to reinforce a series of previously<br />
established requirement-plan projects, including the expansion<br />
and new construction of the Nuremberg–Erfurt line and the<br />
expansion of the Berlin–Cottbus line. Stimulus funds are also<br />
being used to improve the infrastructure quality of regional<br />
transport lines.<br />
DB Netze Stations business unit<br />
In the DB Netze Stations business unit, we are working closely<br />
with the Federal government and regional administrative bodies<br />
to continue our customer-focused and need-based modernization<br />
plans. One key element is our “Station 11 – 11 Benefits for the<br />
Stations” program, which promotes the further development<br />
and increased attractiveness of the stations on the basis of a<br />
focused portfolio strategy with individualized development<br />
concepts.<br />
Within the framework of the government’s economic stimulus<br />
packages nearly 3,000 individual measures will be implemented<br />
in addition to the planned investments in transport<br />
stations at more than 2,000 primarily small and medium-sized<br />
stations. At the end of the year under review, measures had been<br />
completed at more than 500 stations.<br />
DB Netze Energy business unit<br />
The objective of the DB Netze Energy business unit is to guarantee<br />
a highly reliable supply of traction current and diesel in<br />
the long term. The process of replacing transformer plants with<br />
modern converters, as well as upgrading traction current power<br />
lines using resources from the economic stimulus packages<br />
supports this objective in a sustainable way. In addition, CO 2 levels<br />
are reduced due to the use of this more modern and efficient<br />
technology.<br />
Through long-term supply contracts, the use of derivative<br />
financial instruments and intelligent network use, we are protecting<br />
the TOCs against the negative effects of volatile commodity<br />
prices. The share of renewable energy sources in our<br />
energy supply portfolio will be expanded, taking into account<br />
the security of supply and cost-effectiveness.<br />
By 2020, the share of renewable energy sources in the traction<br />
current mix should be at least 30 %. Our vision is to achieve<br />
CO 2 -free rail transport by the year 2050. To reach this goal, we<br />
concluded a long-term contract to procure power from the<br />
Märkisch-Linden wind park that is owned by swb, a Bremenbased<br />
energy supplier. The contract provides for an annual<br />
electricity usage of about 59 gigawatt hours (GWh) over a term<br />
of 19 years. In addition, we are continuing to promote the development<br />
of new processes to generate environmentally friendly<br />
energy. In November <strong>2010</strong>, for example, we signed a cooperation<br />
agreement with wind energy company Enertrag for the pilot<br />
phase of a hybrid wind power plant. It will be the world’s first<br />
trial of this technology. Finally, the DB Netze Energy business<br />
unit also uses its expertise from structured energy provision to<br />
successfully offer energy services in the marketplace.
| GROUP MAN<strong>AG</strong>EMENT REPORT<br />
| Strategy<br />
| Sustainability<br />
111<br />
Sustainability<br />
a Sustainability is an important foundation for future viability<br />
a Further development of corporate culture gets underway<br />
a Climate protection program and “green” products are further developed<br />
Sustainability helps secure the future. Particularly in the transport<br />
sector, sustainability is an important competitive advantage.<br />
Our climate-protection goal thus includes the entire DB Group<br />
and all of its modes of transport – rail, road, waterways and in<br />
the air. We have developed service offerings that allow us to<br />
meet the constantly growing need for mobility and transport in<br />
an environmentally friendly way that conserves resources –in<br />
Germany, Europe and worldwide. Our personnel management<br />
system helps us design attractive, family-friendly workplaces<br />
that promote staff diversity. In view of the increasing shortage<br />
of skilled workers due to the demographic development, it is<br />
even more important for us to ensure that our employees remain<br />
motivated and employable over the long term.<br />
We are laying the groundwork for this today so that we can<br />
remain successful in the market and preserve jobs in the future.<br />
And we are taking responsibility for the society in which we – our<br />
employees, our customers and our business partners – want to<br />
live tomorrow.<br />
We are also actively fulfilling this responsibility when it<br />
comes to our internationalization process. On the basis of the<br />
Group’s ethical principles (Code of Conduct), which define our<br />
fundamental ethical values and convictions, we have participated<br />
in the “UN Global Compact” since 2009: a voluntary economic<br />
initiative by the United Nations that aims to make globalization<br />
more socially and ecologically responsible. As a result, in<br />
November <strong>2010</strong> we were one of the world’s first railway companies<br />
to sign the “Declaration on Sustainable Mobility&Transport”<br />
by the International Union of Railways (UIC), which is supported<br />
by the UN Global Compact and by the United Nations Environment<br />
Program (UNEP).<br />
We provide additional information on the topic of sustainability<br />
in our A Sustainability <strong>Report</strong> [1], which most recently<br />
appeared in 2009. The report coherently summarizes environmental,<br />
personnel-related and social issues and comprehensively<br />
details our contributions to a sustainable society as a major<br />
provider of mobility and logistics services and as one of Germany’s<br />
largest employers, trainers and contractors. Our report was ranked<br />
number five in the 2009 listing of sustainability reports prepared<br />
by the 150 largest German companies, improving our ranking<br />
despite the more stringent criteria (2007: 12th place). We also<br />
submitted the best report in the “Transport/Logistics/Tourism”<br />
sector. The ranking process is carried out every two years by the<br />
Institute for Ecological Economy Research (IÖW) and the corporate<br />
initiative, Future e.V., sponsored by the German Council for<br />
Sustainable Development and the German Federal Ministry of<br />
Labor and Social Affairs.<br />
EMPLOYEES<br />
EMPLOYEES [ FTE, thousands ]<br />
<strong>2010</strong> 276.3<br />
2009 239.4<br />
2008 240.2<br />
Our employees and managers are central on our path to becoming<br />
the world’s leading provider of mobility and logistics services.<br />
Efficient personnel management helps them fulfill their tasks,<br />
while simultaneously setting the right areas of focus for the<br />
future. This year, along with 92 other companies, DB Group<br />
qualified for the “Germany’s Top Employer <strong>2010</strong>” seal of approval;<br />
with 26 other companies, it also earned the more specialized<br />
“Top Engineering Employer <strong>2010</strong>” seal of approval. Among other<br />
things, the rating considered development opportunities, innovation<br />
management, job security, market position and image,<br />
corporate culture, compensation, and work-life balance.<br />
The number of employees is calculated on the basis of fulltime<br />
employee (FTE) positions to permit better comparability<br />
within DB Group and over time. Figures for part-time employees<br />
are converted into figures for equivalent full-time employees in<br />
accordance with their share of the regular annual working time.<br />
As of December 31, <strong>2010</strong>, the number of employees was<br />
basically unchanged in comparison to the figure on the same<br />
year-ago date.<br />
| [1] A www.deutschebahn.com/sustainability
112<br />
| DEUTSCHE BAHN GROUP<br />
Employees by business units [ FTE as of Dec 31 ] <strong>2010</strong> 2009 Change<br />
absolute %<br />
DB <strong>Bahn</strong> Long-Distance 15,270 15,043 +227 +1.5<br />
DB <strong>Bahn</strong> Regional 29,008 28,668 + 340 +1.2<br />
DB Urban 9,009 8,972 + 37 + 0.4<br />
DB Arriva 36,454 – +36,454 –<br />
DB Schenker Rail 32,618 34,145 –1,527 – 4.5<br />
DB Schenker Logistics 58,671 57,134 +1,537 +2.7<br />
DB Services 25,131 24,460 + 671 +2.7<br />
DB Netze Track 39,849 40,354 – 505 –1.3<br />
DB Netze Stations 4,636 4,601 + 35 + 0.8<br />
DB Netze Energy 1,536 1,574 –38 –2.4<br />
Other 24,128 24,431 – 303 –1.2<br />
DB GROUP 276,310 239,382 + 36,928 + 15.4<br />
– Effects from changes in the scope of consolidation 36,847 37 + 36,810 –<br />
DB GROUP – COMPARABLE 239,463 239,345 +118 –<br />
The acquisition of British transport company Arriva increased<br />
the number of our employees by 36,454. This significantly increased<br />
the proportion of employees outside Germany, which is<br />
now 35 % (previous year: 25 %). This means that more than one<br />
in three DB employees is now working outside Germany. During<br />
the year under review, reduced working hours (Kurzarbeit) were<br />
necessary to a much lesser extent than in 2009 due to the economic<br />
recovery. In DB Group, a total of about 7,600 employees<br />
were affected by reduced working hours to varying degrees. On<br />
average about 1,600 employees were employed on the basis of<br />
reduced working hours per month during the year under review.<br />
EMPLOYEES AS OF DECEMBER 31, <strong>2010</strong><br />
By region [%] By division [%]<br />
1<br />
3<br />
4<br />
Germany<br />
Rest of Europe<br />
Asia /Pacific<br />
North America<br />
Rest of world<br />
27<br />
65<br />
32.5<br />
17.8<br />
33.0<br />
16.7<br />
Passenger Transport<br />
Transport and Logistics<br />
Infrastructure<br />
Other<br />
By business unit<br />
<strong>2010</strong> 2009<br />
[%]<br />
DB <strong>Bahn</strong> Long-Distance 5.5 6.3<br />
DB <strong>Bahn</strong> Regional 10.5 12.0<br />
DB <strong>Bahn</strong> Urban 3.3 3.7<br />
DB Arriva 13.2 –<br />
DB Schenker Rail 11.8 14.3<br />
DB Schenker Logistics 21.2 23.9<br />
DB Services 9.1 10.2<br />
DB Netze Track 14.4 16.9<br />
DB Netze Stations 1.7 1.9<br />
DB Netze Energy 0.6 0.7<br />
Other 8.7 10.1
| GROUP MAN<strong>AG</strong>EMENT REPORT<br />
| Sustainability<br />
113<br />
Personnel management policy<br />
In light of the increasing shortage of skilled workers due to<br />
demographic change as well as shifting professional requirements,<br />
our ongoing success depends more and more strongly<br />
on our employees, their qualifications, willingness to produce<br />
and their capabilities. In line with our business strategy and<br />
keeping the development of the business units in mind, we<br />
pursue three strategic goals to ensure our long-term success:<br />
a Mobilize personnel resources<br />
a Ensure performance and commitment<br />
a Further develop our corporate culture<br />
MOBILIZE PERSONNEL RESOURCES<br />
Changing demographic conditions are causing a significant aging<br />
of our workforce as well as a shortage of personnel resources,<br />
especially skilled workers. These central challenges for human<br />
resources pose higher demands for personnel management. In<br />
order to fulfill these demands, the Strategic Personnel Planning<br />
project was created as a central personnel project.<br />
At the core of the project is a simulation model based on<br />
the current employee structure that projects personnel development<br />
trends for the coming years. The result will be a set of<br />
measures for successfully dealing with future challenges.<br />
SECURING YOUNG TALENT<br />
Not only are we one of the largest employers in Germany, we<br />
are also one of the biggest providers of vocational training, with<br />
an average of about 9,000 trainees, dual degree students and<br />
“Chance plus” interns. Vocational training and dual study programs<br />
are the foundation of our efforts to secure recruitment<br />
of younger employees, and they are the source of more than<br />
90 % of our skilled talent. Approximately 2,900 young people<br />
started vocational training with us during the year under review,<br />
and another 200 began a dual study program. In addition, the<br />
“Chance plus” internship program gave another approximately<br />
400 school leavers and graduates the preparation they needed<br />
to enter the professional world.<br />
In addition to specialized knowledge and practical skills, a<br />
key element of our training involves acquiring service-based,<br />
social and methodological skills such as entrepreneurial thinking,<br />
customer orientation, independence and team spirit. For instance,<br />
the “Rail interns against hatred and violence” project (“<strong>Bahn</strong>-<br />
Azubis gegen Hass und Gewalt”) celebrated its 10-year anniversary.<br />
Through this project, first-year interns work to eliminate<br />
xenophobia and increase tolerance in society. To date, more<br />
than 7,200 interns have taken part in this competition with about<br />
800 projects.<br />
Increasing competition to recruit talents requires us to intensify<br />
our personnel marketing activities. Through a total of 340 school<br />
partnerships and our close collaboration with selected universities<br />
and technical colleges, we are very well represented on the<br />
applicant markets. Since the beginning of the year under review,<br />
we have begun to exclusively use our own employees to advertise<br />
ourselves as an employer.<br />
ENSURING PRODUCTIVITY AND COMMITMENT<br />
<strong>2010</strong> W<strong>AG</strong>E NEGOTIATIONS<br />
Ensuring our employees’ performance and motivation on a sustained<br />
basis is of decisive importance to us. Thus, our employment<br />
conditions must be crisis-proof and demographics-proof throughout<br />
the Group and must appeal to groups with skills that are in<br />
particular demand and scarce while at the same time remain<br />
affordable. The unions view the wage negotiations begun in<br />
<strong>2010</strong> as being closely linked to the conclusion of uniform nationwide<br />
wage standards in Germany. The German Locomotive Drivers’<br />
Union (GDL) demanded a nationwide framework wage agreement<br />
for all train drivers, and the Rail and Transport Workers Union<br />
(EVG) asked for an industry-wide wage agreement for all other<br />
employees in the local rail passenger transport sector. We support<br />
the goal of introducing nationwide employment standards.<br />
The wage negotiations were not concluded during the year<br />
under review. In December <strong>2010</strong>, all employees for whose companies<br />
negotiations were held during the current round of wage<br />
negotiations received a one-time payment of € 300, plus a profitsharing<br />
payment of € 200. These payments will be included in<br />
the wage agreement at the end of the negotiations.<br />
In January 2011, DB Group and the EVG reached an agreement<br />
in the A <strong>2010</strong> wage negotiations [1].<br />
GROUP JOB MARKET<br />
The significantly higher number of employees who entered the<br />
Group job market due to the economic and financial crisis were<br />
quickly provided with new work. Currently, three out of four em -<br />
ploy ees affected by job loss are able to find new employment<br />
immediately within DB Group. This rate was maintained despite<br />
the economic and financial crisis. Even more than before, we were<br />
able to use need-based qualification measures to transfer personnel<br />
overlaps into new areas of activity in a fast and targeted way.<br />
| [1] A Page 129
114<br />
| DEUTSCHE BAHN GROUP<br />
SUSTAINABLE PERSONNEL DEVELOPMENT<br />
The strategic goal of personnel development is to create the<br />
necessary conditions for strengthening the skills and dedication<br />
of our employees. We are counting on developing specialized<br />
and management talent within the company, since about 90 %<br />
of these positions are staffed internally. The systematic support<br />
of our talented employees is an important tool for fulfilling our<br />
future internal staffing needs. At the same time, our strong<br />
personnel development and qualification opportunities are also<br />
an important instrument for attracting employees from outside<br />
the company during this time of increasingly intense competition<br />
for skilled and managerial personnel.<br />
FURTHER DEVELOPMENT OF CORPORATE CULTURE<br />
DEVELOPMENT PROCESS OF CULTURE<br />
Our corporate culture is based on openness, trust, diversity and<br />
partnership-like relationships with one another. Based on the<br />
results of a corporate culture analysis, we launched a long-term<br />
process to develop our culture with broad participation from<br />
managers and employees.<br />
DIVERSITY<br />
Each employee’s individuality contributes to our success. With<br />
our commitment to heterogeneity and our target-group-specific<br />
programs, we aim to meet the challenges arising from demographic<br />
changes and support our international direction. The<br />
first focal point of our work identified was increasing the proportion<br />
of women overall and in management positions. The first<br />
programs to implement these measures were developed and are<br />
now being carried out. For our proven dedication to gender<br />
equality, DB Group was awarded the A “Total E-Quality”<br />
prize [1] for the fifth time during the year under review.<br />
ENVIRONMENT<br />
Protecting the environment and the earth’s climate is a fixed<br />
component of our A corporate policy [2]. During the year<br />
under review, we further developed our climate protection<br />
program and our “green” products. Three strategic directions<br />
determine our climate-protection activities:<br />
a Aiding climate protection through high energy efficiency<br />
in operations and production<br />
a Reducing dependency on fossil fuels and increasing the<br />
proportion of renewable energy in the traction current mix<br />
a Using green products to reduce the burden on the environment<br />
This focus helps us work toward our vision of achieving CO 2 -free<br />
rail transport by 2050 on the basis of renewable energy. The<br />
intermediate goal for 2020 is to increase the proportion of renewable<br />
energy sources in the traction current mix to at least 30 %.<br />
In the spring of <strong>2010</strong>, we contracted the first wind farm for our<br />
exclusive use, located in Märkisch-Linden near Neuruppin,<br />
Branden burg. Twenty windmills will produce 59 GWh of electricity<br />
from the wind farm each year. The power supply contract for<br />
procuring electrical energy has a 19-year term.<br />
At the Innotrans rail trade fair in September, the “Eco Rail<br />
Innovation (ERI)” platform, founded in the previous year with<br />
partners from the fields of science and industry, presented the<br />
results of a study carried out by scientific institutes InnoZ and<br />
SCI. The focus of this joint project was on developing sustainable<br />
mobility technologies. Above all, the project’s goal was to support<br />
the development of low-emissions and energy-efficient components<br />
and drive systems, such as energy storage devices for rail<br />
vehicles, in order to strengthen the rail sector’s future prospects.<br />
The first of 130 261 series shunting locomotives with particle<br />
filters were delivered during the year under review and represents<br />
a milestone in reducing airborne pollutant emissions. The filters<br />
reduce particle emissions from diesel engines by up to 97 %, which<br />
means that they meet the requirements for particle limits well<br />
before they take effect in 2012. More than 90 % of the approximately<br />
280 new buses (not including Arriva) that were put into<br />
operation during the year under review have received the “Blue<br />
Angel” seal of approval, which also means that they comply with<br />
the strict EEV (Enhanced Environmentally Friendly Vehicle) emissions<br />
standard. In addition to meeting strict emissions criteria,<br />
these vehicles are also distinguished by their environmentally<br />
friendly paint and their extremely low noise emissions.<br />
| [1] A www.total-e-quality.de/en<br />
| [2] A www.db.de/environment
| GROUP MAN<strong>AG</strong>EMENT REPORT<br />
| Sustainability<br />
115<br />
We believe a corporate policy that takes into account economic,<br />
ecological and social factors is more than just a societal obligation.<br />
It is also the key to business success. Our environmental<br />
strategy thus sets the parameters for the company’s ambitious<br />
environmental goals.<br />
Our CO 2 -free offerings received various prizes during the year<br />
under review, including the ÖkoGlobe <strong>2010</strong> in the “Mobility<br />
Projects and Visions” category for the CO 2 -free Hamburg S-<strong>Bahn</strong><br />
(metro) and the Ecotrophea, the environmental prize awarded<br />
by <strong>Deutsche</strong>r Reiseverband e.V. (DRV).<br />
CO 2 -free travel and transport with<br />
Environment Plus and Eco Plus<br />
Our range of CO 2 -free rail travel and transport offerings was<br />
increasingly popular during the year under review. In the area<br />
of passenger transport, our bahn.corporate Environment Plus<br />
program – which allows corporate customers to travel on a CO 2 -<br />
free basis – is used by several companies, the Federal Government<br />
and its subordinate departments, and by the State of Rhineland-<br />
Palatinate. The first customers also began using the Eco Plus<br />
program for CO 2 -free freight transport. If we also consider our<br />
employees’ CO 2 -free business travel via rail, the environmental<br />
balance sheets for participating companies were credited a total<br />
of 42,000 t of CO 2 during the year under review.<br />
Our CO 2 -free offerings were expanded to include the<br />
Ameropa Travel Destination Nature Trips (“Fahrtziel-Natur-<br />
Reisen”) and the “Rail inclusive tours” tickets, among other<br />
things. In the Hamburg S-<strong>Bahn</strong> (metro), customers automatically<br />
travel CO 2 -free. Since January <strong>2010</strong>, the S-<strong>Bahn</strong> has operated<br />
exclusively on green power, saving 200,000 t of CO 2 each year<br />
in comparison to traveling by car. Our local transport service in<br />
the Saarland region has also been run exclusively on green power<br />
since mid-<strong>2010</strong>. The necessary volume of renewably generated<br />
energy is purchased separately by DB Energie GmbH and fed into<br />
the rail power network. TÜV SÜD certifies the origin of the energy.<br />
At the end of the year, customers receive an environmental balance<br />
sheet with the TÜV testing seal, verifying their CO 2 savings.<br />
The volume of electricity is determined using the Mobile<br />
Environment Check A (UmweltMobilCheck; UMC) [1]. This<br />
environmental calculator can be accessed online from our Web<br />
site’s travel information section. It calculates rail energy usage<br />
as well as CO 2 and exhaust emissions in comparison to automobiles<br />
and airplanes for any route in Germany and in large parts<br />
of Europe.<br />
We use 10 % of our profits from the Environment Plus and<br />
Eco Plus offerings to support the construction of new plants for<br />
generating renewable energy. During the year under review, we<br />
concluded an agreement with Enertrag <strong>AG</strong> to support the construction<br />
of a hybrid power plant in Prenzlau. This technologically<br />
groundbreaking power plant will store extra wind power in the<br />
form of hydrogen, which can then be converted into electricity<br />
in a combined heat and power unit when wind levels are low.<br />
CO 2 -FREE MOBILITY CHAINS WITH ELECTROMOBILITY<br />
Given the advances in developing electrically driven motor vehicles<br />
and bicycles, we see an opportunity to completely “green”<br />
the so-called “last mile.” In conjunction with CO 2 -free rail transport,<br />
this will allow us to offer CO 2 -free mobility chains in the<br />
future. With this system, customers will be able to plan personalized<br />
climate-friendly travel routes from door to door. Since<br />
electric cars have a smaller travel range than vehicles with combustion<br />
engines due to the storage capacity of their batteries,<br />
electric vehicles are a good way to supplement rail transport.<br />
Thus we are taking part in projects like BeMobility – BerlinElektroMobil<br />
– in order to determine what customers want,<br />
and we began “electrifying” DB Carsharing (e-Flinkster). Since<br />
August <strong>2010</strong>, e-Flinkster cars can be booked and rented online<br />
in various German cities (including Frankfurt am Main and Berlin).<br />
EXPANDING THE ENVIRONMENTAL BALANCE SHEET<br />
FOR FREIGHT TRANSPORT<br />
During the year under review, we worked with the International<br />
Union of Railways (UIC) and six other European rail transport<br />
companies to expand the A EcoTransIT World environmental<br />
calculator [2]. It can now calculate energy usage, CO 2 and exhaust<br />
emissions for any freight transport worldwide, and for all modes<br />
of transport. This allows customers to optimize their global<br />
logistics chains and reliably calculate the environmental impact<br />
of the transports. Previously, the online calculator was only able<br />
to calculate transport routes within Europe. EcoTransIT World<br />
is a free online application.<br />
| [1] A www.bahn.de/umc<br />
| [2] A www.ecotransit.org
116<br />
| DEUTSCHE BAHN GROUP<br />
GROUP-WIDE CLIMATE PROTECTION<br />
PROGRAM MOVES AHEAD<br />
Plans call for Group-wide specific CO 2 emissions – emissions per<br />
volume sold – to decrease by 20 % (compared to 2006) by the<br />
year 2020. Although the absolute CO 2 emissions rose slightly in<br />
comparison to the crisis year of 2009, particularly in the area of<br />
freight transport, the specific emissions were still reduced.<br />
According to the current data available, our worldwide specific<br />
CO 2 emissions decreased by a total of about 4.4 % between<br />
2006 and <strong>2010</strong>.<br />
Further reductions in energy usage and CO 2 emissions for rail transport<br />
Selected key figures – rail transport <strong>2010</strong> 2009 Change<br />
absolute %<br />
Specific primary energy consumption rail passenger transport in MJ 1) /pkm 1.01 1.07 – 0.06 – 5.6<br />
Specific primary energy consumption rail freight transport in MJ 1) /tkm 0.38 0.40 – 0.02 – 5.0<br />
Specific carbon dioxide emissions rail passenger transport in g /pkm 58.0 60.6 –2.6 – 4.3<br />
Specific carbon dioxide emissions rail freight transport in g /tkm 21.9 22.6 – 0.7 –3.1<br />
Emission of soot particles by diesel vehicles in rail transport in t 191 199 – 8 – 4.0<br />
Nitrogen oxide emissions by diesel vehicles in rail transport in t 10,724 11,357 – 633 – 5.6<br />
1)<br />
Megajoules.<br />
Data for <strong>2010</strong> is based on information and estimates available as of February 16, 2011.<br />
We have reduced our specific CO 2 emissions for rail transport in<br />
Germany by 43 % since 1990. In rail passenger transport CO 2 emissions<br />
fell by 4.3 % to 58 grams per pkm. The same figure for<br />
long-distance transport fell by 6.9 %, and by 1.7 % for local transport.<br />
Rail freight transport values improved by 3.1 % to 21.9 grams<br />
of CO 2 per ton/kilometer. These represent further contributions<br />
by rail transport towards protecting our climate, and mark a<br />
further increase in rail transport’s environmental lead. The higher<br />
proportion of renewable energy sources in rail transport plays<br />
an essential role in reducing CO 2 emissions. According to the<br />
current data available, this proportion rose to 19.8 % in the traction<br />
current mix during the year under review.<br />
Absolute emissions of soot particles and nitrogen oxide also<br />
decreased slightly in rail transport during the year under review.<br />
Data for DB Schenker Logistics will be available in the second<br />
half of 2011 A [1].<br />
Rail transport noise reduced<br />
We aim to cut rail transport noise to half of its 2000 levels by<br />
2020. An important component of this is the Federal Government’s<br />
noise abatement program, which began in 1999 and which<br />
we are continuing to successfully implement. By the end of the<br />
year under review, 28 % of the 3,400 total rail kilometers included<br />
in the noise abatement campaign, or 960 kilometers, had been<br />
upgraded. As part of this campaign, we built a total of 332 km of<br />
noise protection walls between 1999 and <strong>2010</strong> and implemented<br />
noise abatement measures – noise-reducing windows or other<br />
measures such as soundproofed roofs – in nearly 44,000 apartments.<br />
During the year under review, we built 53 km of noise<br />
protection walls along existing lines and implemented noise<br />
abatement measures in 3,500 apartments.<br />
DB Schenker Rail increased the number of freight cars<br />
equipped with low-noise composite brake shoes, also known as<br />
“whisper brakes,” by about 1,100 to a total of about 6,350 by the<br />
end of <strong>2010</strong>. This technology cuts the noise of passing trains by<br />
10 decibels (db (A)), which corresponds to a 50 % perceived<br />
reduction. In a pilot project supported by Federal funding, we<br />
are able to upgrade about 1,250 existing freight cars to the<br />
quieter composite brake shoes.<br />
| [1] A www.db.de/sustainability
| GROUP MAN<strong>AG</strong>EMENT REPORT<br />
| Sustainability<br />
117<br />
To date, DB Schenker Rail is the only company that has applied<br />
for funding to upgrade existing freight cars as part of the “Quiet<br />
Rhine” project. The upgrading measures for these cars, which<br />
are primarily used along the Rhine River corridor, will provide<br />
important information for further upgrades to the fleet. The<br />
first upgraded trains will be put into operation in 2011.<br />
The Federal Government’s A Economic Stimulus Package<br />
II [1] will fund a total of € 100 million in pilot projects to test<br />
innovative noise and vibration abatement measures in the infrastructure.<br />
This will allow innovative processes and infrastructure<br />
technologies to be tested and implemented in known noisepolluted<br />
regions.<br />
SOCIAL COMMITMENT<br />
For us, “moving the future” is not only the guiding principle behind<br />
our economic development, this idea also mirrors the social<br />
responsibilities the Group undertakes. As one of Germany’s biggest<br />
employers and occupational trainers, we bear a special<br />
responsibility – to our customers, employees, the environment,<br />
and society as a whole. Providing support for children and young<br />
people is especially important to us. Our activities in this area<br />
focus on education and sports.<br />
In society, we support numerous cultural, social and athletic<br />
establishments, initiatives and activities. Our major focus here<br />
is also on children and young people. In the knowledge society<br />
of today and tomorrow, education is the greatest asset. Providing<br />
education is the task of society as a whole, and we play an active<br />
role in this. Since 1996, we have been working as a partner and<br />
member of the Stiftung Lesen (the Reading Foundation) to<br />
strengthen Germany’s reading and read-aloud culture.<br />
The social integration of children and young people in need is the<br />
aim of the nationally active Off Road Kids Foundation. We have<br />
supported this organization since 1994 by enabling the Foundation’s<br />
street outreach workers to travel throughout Germany.<br />
Promoting sports is also a high priority for us, since it provides<br />
joy in movement and promotes values like motivation and<br />
team spirit, fair play and social integration; it also provides role<br />
models for children and young people. This particularly applies<br />
to “Jugend trainiert für Olympia” (Youth Training for the Olympics).<br />
As a long-standing official mobility partner of this school<br />
sports event, the largest such event in the world, we organize<br />
low-cost transport for participants to and from the site as well<br />
as their accommodations. Since 2002 we have also been setting<br />
benchmarks in how we value sports through our close partnership<br />
with the <strong>Deutsche</strong>r Behindertensportverband (the German<br />
National Paralympic Committee). This partnership includes both<br />
our new involvement in “Jugend trainiert für Paralympics” (Youth<br />
Training for the Paralympics), through which we support school<br />
athletics and the social integration through sports of children<br />
with disabilities, and DB Schenker’s transport of sporting goods<br />
and equipment for the <strong>2010</strong> Paralympics in Vancouver, Canada.<br />
In addition to supporting elite sporting events, among other<br />
things as a partner for multiple national soccer leagues and as<br />
a national sponsor of the FIFA Women’s World Cup in Germany<br />
in 2011, our involvement also addresses the basis and thereby<br />
the future of the younger generation. By granting the DB Young<br />
Talent Award (DB-Nachwuchs-Förderpreis), we acknowledge<br />
the dedication of the many people who work with children and<br />
young people in the field of soccer. This experience of inte gration<br />
is just as important for the future of society as it is for creating<br />
a spirit of initiative and the sense of community that young<br />
people encounter in the DB soccer camps. It is important to us<br />
to promote tolerance, team spirit, cultural skills and educational<br />
perspectives, and to make a contribution to our society. For our<br />
company, long-term commitment and involvement are synonymous<br />
with investing in young people.<br />
| [1] A Page 60
118<br />
| DEUTSCHE BAHN GROUP<br />
Technology and procurement<br />
a Focus on securing efficiency of the integrated rail system<br />
a Master plan T gives new orientation to Rail Technology and Services Board division<br />
a Procurement volume rises significantly again<br />
The Rail Technology and Services Board division ensures the<br />
efficiency of the integrated rail system and thereby the economical,<br />
environmentally friendly and reliable railway operations<br />
in the future. The technical competence for the total<br />
railway system, procurement and the central safety and quality<br />
function are bundled together in the integrated rail system<br />
(Systemverbund <strong>Bahn</strong>). Operational safety is at the forefront<br />
of these efforts.<br />
The task of the Rail Technology and Services Board division,<br />
which was established in the fall of 2009, is to ensure a technically<br />
flawless, environmentally friendly and economical railway<br />
system. In order to fulfill these Group-wide tasks, the Rail Technology<br />
and Services Board division is undergoing a reorientation,<br />
which began during the year under review. The Master plan T<br />
project was introduced for this purpose. The goal of the project<br />
is to orient the Rail Technology and Services Board division<br />
toward the demands of the market and internal customers.<br />
The roll-out of the Master plan T project ensures that issues<br />
with high operational and strategic urgency take priority. The<br />
first wave, through the middle of the year under review, focused<br />
on analyzing the previous integrated rail system, including the<br />
areas of rail operations, technology, procurement and quality.<br />
All of the units in the Rail Technology and Services Board division<br />
were examined using an identical process. The investigation<br />
included analyzing the initial situation in the performance areas<br />
and determining the necessary further developments as well as<br />
any new orientation potentially required as a result. Master plan T<br />
was introduced into the TechnologyOptimizationProgram (TOP)<br />
during the second half of the year under review. TOP is the implementation<br />
program for reorientation issues that need to be<br />
addressed. TOP ensures that the department’s established goals<br />
are reached; it is accompanied by comprehensive further-education<br />
measures and an extensive change management process.<br />
The reorganization of the Rail Technology and Services<br />
Board division includes appointing a Chief Technology Officer<br />
for the technical rail system, a Chief Procurement Officer for<br />
procurement, and a Chief Quality Officer for the safety and<br />
quality management system.<br />
MASTER PLAN T FOR REORIENTING THE RAIL<br />
TECHNOLOGY AND SERVICES BOARD DIVISION<br />
TECHNOLOGY<br />
The analysis of the current technological issues also revealed<br />
that the understanding of the roles played by DB Group and<br />
industrial firms must be revised. Before the Rail Reform Act in<br />
1994, the <strong>Deutsche</strong> Bundesbahn played the role of the system<br />
integrator. This task was transferred to industrial firms when<br />
rail reform was implemented. However, the resulting distribution<br />
of roles still contains deficits that must be corrected.
| GROUP MAN<strong>AG</strong>EMENT REPORT<br />
| Technology and procurement<br />
119<br />
During the year under review, we developed a catalogue of<br />
measures – partially in collaboration with industrial firms – to<br />
improve the qualitative level of vehicle development. The catalogue<br />
includes introducing quality and design milestones for<br />
the entire development and manufacturing process. This includes<br />
reviewing certain quality criteria at specific intervals, such as<br />
the implementation of technical specifications, manufacturing<br />
quality, and the completeness of technical documentation. All<br />
of these topics are included in a handbook for industrial firms,<br />
which we are currently compiling and will become a component<br />
of any new contracts. In addition, this will shorten the lengthy<br />
EBA approval processes.<br />
Managing and further developing the rail system requires<br />
extensive technical knowledge about the interaction between<br />
operations, infrastructure and vehicle technology. It also involves<br />
expertise in specialized rail-related fields. Our railway expertise<br />
has a very strong reputation worldwide. Examples of the popular<br />
technical services we offer are our monitoring of production<br />
resources during ongoing operations, carrying out domestic and<br />
international test orders, and managing complex vehicle projects<br />
and redesign projects for entire vehicle fleets.<br />
We are developing numerous redesign projects in the passenger<br />
transport segment to update vehicles and re-equip them<br />
to meet customers’ demands. As part of a preliminary project,<br />
for instance, the requirements involved an additional usage<br />
period of 15 years for our ICE 2 fleet. At the end of the year under<br />
review, the first sample train was rebuilt and modernized in the<br />
Nuremberg plant. The modernization of the remaining 43 trains<br />
will take place successively by 2012.<br />
During the year under review, the subject of wheel sets was<br />
extremely important. Due to the ongoing technical problems,<br />
new A maintenance intervals [1] were established for the<br />
wheel set axles in existing vehicles. Industrial firms are manufacturing<br />
newly designed wheel sets for trains in the ICE 3 and<br />
ICE T fleets constructions that must then undergo the approval<br />
process. New wheels and wheel set axles were also developed<br />
for the Berlin S-<strong>Bahn</strong> (metro) and submitted for approval. Furthermore,<br />
internationally applicable requirements were developed<br />
at EU level to govern the A maintenance of freight car<br />
wheel sets [2].<br />
Testing and approval agreements are also signed with customers<br />
outside DB Group. DB Systemtechnik bundles all of our<br />
railway expertise. It offers manufacturers the use of its certified<br />
testing laboratory at an early stage of the development process.<br />
This early consultation on approval and testing requirements,<br />
particularly for European approval processes, optimizes costs<br />
and efforts, and significantly accelerates the approval process.<br />
During the year under review, such approval tests were carried<br />
out on behalf of industrial firms for vehicles such as Desiro, E-Lok<br />
Vectron, ETR 610, X 61, XRE and TGV Duplex for Germany and<br />
other European countries.<br />
Comprehensive system optimizations comprising the further<br />
development of technology for the infrastructure and<br />
vehicles are extremely important for the rail mode of transport.<br />
Based on this task we are driving technical innovations needed<br />
to ensure commercial success and that contribute to a constant<br />
increase in production efficiency as well as operational quality.<br />
In the year under review, for example, we concluded the “GZ<br />
1000” project, proving that freight trains with a length of up<br />
to 1,000 m were feasible.<br />
Research and development<br />
As a service provider, DB Group does not conduct its own<br />
research and development in the narrow sense of the term. Due<br />
to our technological competence and broad operational experience,<br />
we do, however, initiate user-oriented developments<br />
and support industrial firms with services including extensive<br />
testing capabilities.<br />
| [1] A Page 83 | [2] A Page 121 f.
120<br />
| DEUTSCHE BAHN GROUP<br />
PROCUREMENT<br />
he procurement of materials and services from the external<br />
supplier market is a significant lever to control processes and<br />
influence cost structures. A uniform Group-wide procurement<br />
policy allows standardized handling processes to be applied,<br />
and also ensures a uniform appearance in the market.<br />
The year under review was still largely influenced by the<br />
after-effects of the economic and financial crisis. In order to<br />
counteract this, we established a program for optimizing supply<br />
services in the procurement area. Within the framework of this<br />
program all of the product groups were subjected to a systematic<br />
analysis of their needs and potential levers.<br />
Optimized life cycle costs are a key criterion here. In addition<br />
to the immediate cost issues, the focus was primarily on<br />
capital-intensive investments in order to optimize the level of<br />
committed capital.<br />
These activities were supported by the parallel launch of<br />
international procurement teams. The purpose of these teams<br />
is to implement best-buy strategies in the global supplier context.<br />
The goal here is to create savings and anchor them in global<br />
framework agreements.<br />
In addition to the immediate program building blocks to<br />
optimize procurement services, progress was also achieved for<br />
significant strategic purchasing tools: during the year under review<br />
a new supplier management system was introduced. This is a<br />
defined overall process that qualifies, evaluates and develops<br />
suppliers. Using continuous IT support, it creates a tool for strategic<br />
procurement that can systematically develop our portfolio<br />
of suppliers, improve its quality and inspire innovations. This also<br />
includes creating the corresponding content-related concepts.<br />
The supplier evaluation system will be in place starting 2011.<br />
The total volume of orders placed during the year under review<br />
amounted to € 22.8 billion and was higher than previous year’s<br />
level (previous year: € 19.2 billion). In particular, the € 9.8 billion<br />
in freight and freight forwarding services purchased from carriers<br />
was significantly higher than in the previous year (previous<br />
year: € 7.3 billion). In addition, the volume of industrial products<br />
purchased, with an order volume of € 4.2 billion (previous year:<br />
€ 3.5 billion), was also greater than in the previous year. Construction<br />
and engineering services procured totaled € 3.8 billion<br />
(previous year: € 4.0 billion).<br />
The procurement of third-party services, with an order<br />
volume of € 2.7 billion, was also above the level noted in the<br />
previous year (previous year: € 2.3 billion). In the area of cableand-pipe-bound<br />
power and fuel, the order volume amounted to<br />
€ 2.3 billion, which was slightly higher than the previous year’s<br />
level (previous year: € 2.1 billion).<br />
Among the largest orders placed during the year under<br />
review were:<br />
a Calling up vehicles for the DB <strong>Bahn</strong> Regional business unit<br />
(total volume: more than € 1.2 billion)<br />
a Construction orders awarded as part of the VDE 8 (total<br />
volume: about € 425 million)<br />
a Awarding the ballastless track for the Katzenberg tunnel<br />
(total volume: about € 30 million)<br />
a Orders awarded as part of the S-<strong>Bahn</strong> (metro) redesign,<br />
including climate-control systems (total volume: about<br />
€ 70 million)<br />
a Continuing the replacement-parts program for engines<br />
(total volume: about € 12 million)<br />
a Large project packages awarded for electronic interlockings<br />
(ESTW), for instance in the Berlin metropolitan area (total<br />
volume: about € 48 million)<br />
a Various master agreements awarded for safety systems at<br />
rail crossings (total volume: about € 45 million)<br />
Structure of orders placed <strong>2010</strong> [%]<br />
43<br />
10<br />
12<br />
18<br />
17<br />
Freight and freight<br />
forwarding services<br />
Industrial products<br />
Construction and<br />
engineering services<br />
Third-party services<br />
Cable-and-pipe-bound<br />
power and fuel
| GROUP MAN<strong>AG</strong>EMENT REPORT<br />
| Technology and procurement<br />
| Additional information<br />
121<br />
Additional information<br />
a Stuttgart 21 Project mediation talks completed<br />
a Partial conclusion of investigations of companies in freight forwarding industry<br />
a Overall conditions change for long-distance bus transport<br />
GERMANY SUED BY EU COMMISSION FOR<br />
ALLEGED FAILURE TO CORRECTLY IMPLEMENT<br />
THE FIRST RAILWAY PACK<strong>AG</strong>E<br />
The European Commission decided on June 24, <strong>2010</strong> to sue<br />
Germany and 12 other EU member states before the European<br />
Court of Justice. The affected countries are accused of insufficiently<br />
implementing the first European railway package, especially<br />
the unbundling requirements. Parties to this infringement<br />
proceeding are the European Commission and the Federal<br />
Republic of Germany. The Federal Government has fully rejected<br />
the allegations made by the Commission thus far. DB Group is<br />
also of the opinion that the arguments of the Commission are<br />
without merit. DB Netz <strong>AG</strong> is independent from other enterprises<br />
within DB Group in its decisions regarding train-path access and<br />
track charges. European railway law explicitly allows the holding<br />
structure chosen by Germany.<br />
DISPUTE REGARDING TRANSPORT CONTRACT<br />
BERLIN AND BRANDENBURG<br />
In August 2003 Veolia Verkehr GmbH (formerly known as Connex<br />
Regiobahn GmbH) submitted a complaint to the European Commission<br />
wherein they alleged that certain payments made constituted<br />
illegal state aid. The specific cause and subject of the<br />
proceedings is a transport contract concluded between DB Regio<br />
<strong>AG</strong> and the states of Brandenburg and Berlin. Veolia alleges that<br />
the contractually agreed payments received by DB Regio <strong>AG</strong><br />
(concession fees) are state aid in terms of related European<br />
legal requirements.<br />
Based on a ruling passed on October 23, 2007, the Commission<br />
initiated a formal investigation of the Federal Republic of<br />
Germany. Both the Federal Republic of Germany and DB Regio<br />
<strong>AG</strong> stated in their respective responses that they are of the<br />
opinion that subsidy payments were not involved. At this time<br />
it is not known when the European Commission will decide on<br />
this issue. The initiation of a formal investigation is an administrative<br />
step and does not anticipate the results of the Commission’s<br />
investigation in any way.<br />
MEDIATION PROCESS FOR THE<br />
STUTTGART 21 PROJECT<br />
On November 30, <strong>2010</strong> Dr. Heiner Geißler, who served as mediator,<br />
issued a concluding statement of results thereby ending the<br />
six-week-long mediation talks regarding the Stuttgart 21 project.<br />
The mediator’s core remarks confirmed the Stuttgart 21<br />
project and the new rail line to Ulm. He did, however, make this<br />
confirmation contingent on certain conditions that must be taken<br />
into account when making further plans for the project. In addition<br />
to a series of subject areas (e.g. the retention and replanting<br />
of trees, talks with groups representing handicapped people<br />
and the fire department, as well as the socially acceptable valuation<br />
of the involved properties) DB Group committed itself to<br />
conduct a so-called stress test for Stuttgart 21. This test involves<br />
using a simulation to prove that the Stuttgart 21 infrastructure<br />
can deliver 30 % more performance during main travel times than<br />
the current railhead station. Only after the completion of the<br />
stress test, which is being conducted by SMA, a Swiss firm, can it<br />
be decided if supplementary infrastructure measures are required.<br />
These measures could include the dual-track expansion of the<br />
western access track to the airport train station, the so-called big<br />
Wendlinger Curve, or additional train-path in the Zuffenhausen<br />
area. The stress test will take about six months.<br />
TIGHTENED REQUIREMENTS FOR FREIGHT<br />
CAR WHEEL SET AXLES<br />
Following an accident that took place in Viareggio/Italy in June<br />
2009, when a train of Trenitalia Cargo carrying hazardous materials<br />
derailed most likely because of a broken wheel set, the<br />
maintenance of freight car wheel set axles has come into sharper<br />
focus of railway companies and authorities. The A European<br />
Railway Agency (ERA) [1] has appointed a task force to determine<br />
mandatory rules regarding the maintenance of freight car<br />
wheel sets for the entire European Sector of the rail freight<br />
system. The Federal Railways Agency has issued a general order<br />
mandating the ability to backtrack wheel sets/wheel set axles<br />
(including their date of initial installation, date of modification<br />
and last maintenance date). Other national regulatory authorities,<br />
e.g. the Italian Agenzia Nazionale per la Sicurezza Ferroviaria<br />
(ANSF), have issued ordinances that influence the manufacture<br />
| [1] A www.era.europa.eu
122<br />
| DEUTSCHE BAHN GROUP<br />
of wheel sets. Within the framework of its activities the ERA Task<br />
Force has defined measures across Europe to the effect that the<br />
wheel set load of UIC wheel set axles type A must be reduced<br />
from 21 to 20 tons, and the coarseness of the wheel set surfaces<br />
must be improved. At this time it cannot be ruled out that more<br />
far-reaching measures may become necessary because the ERA<br />
Task Force, in particular, is continuing its investigations via the<br />
Joint Support Group.<br />
COMPANIES IN THE FREIGHT FORWARDING<br />
INDUSTRY UNDER INVESTIGATION<br />
Anti-trust authorities around the world have been investigating<br />
companies in the freight forwarding industry since the fall of 2007.<br />
More details may be found in the 2009 <strong>Annual</strong> <strong>Report</strong> of DB Group<br />
on page 123, as well as in the <strong>2010</strong> Interim <strong>Report</strong> of DB Group<br />
on page 35.<br />
On September 30, <strong>2010</strong> the US Department of Justice (DOJ)<br />
reached plea agreements with Schenker <strong>AG</strong> and BAX Global Inc.<br />
to end the pending anti-trust proceedings in the USA. Per the<br />
terms of the agreement Schenker <strong>AG</strong> will pay a fine of USD 3.5 million<br />
and BAX Global Inc. will pay a fine of USD 19.8 million. In<br />
return the DOJ agreed not to file charges against Schenker <strong>AG</strong> and<br />
BAX Global Inc. The plea agreements still need to be confirmed<br />
by the Court. A decision is still pending in proceedings before the<br />
EU Commission following the oral hearing held in July <strong>2010</strong>. It is<br />
expected that the anti-trust investigation will not be concluded<br />
before the end of 2011.<br />
DB INTERNATIONAL ACTIVELY INVOLVED<br />
IN THE EXPANSION OF THE CHINESE HIGH-SPEED<br />
RAIL NETWORK<br />
During the year under review DB International was awarded the<br />
contract for construction supervision services for five construction<br />
phases of the new Chinese high-speed rail line. Plans call<br />
for the high-speed rail lines to be operational by the start of 2016.<br />
The lines will be double-tracked and operational for speeds up<br />
to 350 km/h. DB International opened five project offices for the<br />
project in Yuncheng, Weinan, Changsha, Jiangshan and Qujing.<br />
To further expand its Chinese business activities, DB International<br />
founded a joint venture with its Chinese partner HUATIE Engineering<br />
Consulting Co., Ltd., Peking/China (a fully owned subsidiary<br />
of the China Rail Group): Beijing Huajing Debo International<br />
Engineering Consulting Co., Ltd, Peking/China; DB International<br />
holds 25 % of the shares.<br />
SUPPORTED BY DB INTERNATIONAL, METRO MEKKA<br />
INAUGURATES OPERATIONS PUNCTUALLY IN TIME<br />
FOR THE START OF THE HAJJ (PILGRIM<strong>AG</strong>E)<br />
The Al Mashaaer Al Mugaddassah Metro Makkah (metro Mecca)<br />
began operations on November 15, <strong>2010</strong>. For the first time ever,<br />
pilgrims participating in the Hajj were able to travel by Metro<br />
to the sacred Mount Arafat. Peak capacity of about 45,000 passengers<br />
per hour was reached in evening hours. DB International<br />
was responsible for planning and acceptance inspection of the<br />
entire railway system, metro vehicles as well as the supervision<br />
of construction in this first phase of the project.<br />
INVESTIGATIONS AT DB INTERNATIONAL<br />
The audit firm KPMG has been retained to conduct a special<br />
investigation at DB International GmbH (DBI) following charges<br />
made in the wake of preliminary investigation proceedings<br />
opened by the public prosecutor’s office in Frankfurt am Main.<br />
The prosecutor alleges that DBI employees previously transferred<br />
payments and in-kind donations to decision makers abroad,<br />
either directly or via third parties. According to the prosecution,<br />
these contributions were made to elicit preferential treatment<br />
of DBI in regard to awarding orders. The official investigations<br />
are continuing. The investigations are based on information we<br />
ourselves gave to the investigating authorities. It cannot be<br />
excluded that a corporate fine or an order for forfeiture will be<br />
imposed on either DBI or DB <strong>AG</strong>.
| GROUP MAN<strong>AG</strong>EMENT REPORT<br />
| Additional information<br />
123<br />
OVERALL CONDITIONS CHANGE FOR<br />
LONG-DISTANCE BUS TRANSPORT<br />
TRANSPARENT PROVISION OF<br />
SERVICES WITHIN DB GROUP<br />
In June <strong>2010</strong> the Federal Administrative Court (BVerwG) rescinded<br />
a permit for scheduled long-distance bus transport between<br />
Frankfurt am Main and Dortmund. The Darmstadt Regional<br />
Council had issued this permit to a competitor without involving<br />
DB Group in the legally prescribed proceedings.<br />
The Court, however, did determine in principle that an<br />
additional long-distance bus line may generally be viewed as<br />
an improvement to the overall transport offer if it is notably<br />
less expensive than the comparable rail offer. The Court further<br />
clarified that DB Group has the right to arrange its existing<br />
transport offers, which, for example, may take the form of a<br />
price adjustment.<br />
The decision of the BVerwG has hardly any fundamental<br />
effects on our activities. However, at the same time, lawmakers<br />
are working on changes to further liberalize long-distance bus<br />
transport. We will evaluate the effects of the resulting changes<br />
and position ourselves in the market with competitive offers.<br />
Charges invoiced to DB Group and non-Group customers for use<br />
of the infrastructure are based on the corresponding A pricing<br />
systems [1] (train-path pricing system, facility pricing system<br />
and stations pricing system). Services are provided by either DB<br />
Netz <strong>AG</strong> or DB Station & Service <strong>AG</strong>. Service beneficiaries within<br />
the Group are primarily passenger and freight transport TOCs.<br />
The consolidation of all energy-related activities under<br />
DB Energie GmbH means that this Group company serves as the<br />
sole buyer of energy from the external market for the Group.<br />
DB Energie GmbH then resells these services to DB Group and<br />
non-Group customers at market conditions. Energy charges<br />
include both traction energy (diesel fuel and traction current) as<br />
well as power for stationary facilities (e.g. points (switch) heaters<br />
and preheating equipment for trains used by DB Netz <strong>AG</strong>).<br />
The following table shows the main intra-Group procurement<br />
relationships that exist between DB Group’s business units.<br />
The table shows the infrastructure-related net charges for the<br />
use of train-path, local infrastructure facilities (including shunting<br />
and stabling facilities), passenger stations and charges for the<br />
provision of energy.<br />
[ € million ] DB <strong>Bahn</strong><br />
Long-<br />
Distance<br />
DB<br />
<strong>Bahn</strong><br />
Regional<br />
DB<br />
<strong>Bahn</strong><br />
Urban<br />
DB<br />
Arriva<br />
DB<br />
Schenker<br />
Rail<br />
DB<br />
Schenker<br />
Logistics<br />
DB<br />
Services<br />
DB<br />
Netze<br />
Track<br />
DB<br />
Netze<br />
Stations<br />
DB<br />
Netze<br />
Energy<br />
Subsidiaries<br />
/<br />
Other<br />
Train-path<br />
utilization 777 2,113 0 0 450 0 1 –3,344 0 0 3<br />
Utilization<br />
of local infrastructure<br />
24 49 0 0 143 0 1 –218 0 1 0<br />
Station<br />
utilization 95 516 0 0 0 0 0 –6 –606 0 1<br />
Energy<br />
allocation 308 706 57 0 373 0 25 145 85 –1,714 15<br />
| [1] A www.dbnetze.com
124<br />
| DEUTSCHE BAHN GROUP<br />
Risk report<br />
a Integrated risk management ensures transparency<br />
a Material risks in areas of market, production, technology and procurement market<br />
a Risk portfolio free of existence-threatening risks<br />
Our business activities involve opportunities as well as risks.<br />
Our business policy is simultaneously directed at seizing opportunities<br />
and actively controlling identified risks through our risk<br />
management system. The necessary information for this is<br />
prepared in our integrated risk management system, which<br />
conforms to the legal requirements of the German Control and<br />
Transparency Act in the Corporate Sector (Gesetz zur Kontrolle<br />
und Transparenz im Unternehmensbereich; KonTraG). This system<br />
is continuously further developed.<br />
RISK MAN<strong>AG</strong>EMENT WITHIN DB GROUP<br />
The principles of risk policy are set by Group management and<br />
are implemented within DB Group. Within the framework of our<br />
early risk detection system, quarterly reports are submitted to<br />
DB <strong>AG</strong>’s Management Board and Supervisory Board. Risks or<br />
negative developments occurring outside of the regular reporting<br />
cycle must be reported immediately. Planned acquisitions are<br />
subject to additional special monitoring. Arriva, which was<br />
acquired during the year under review, has not yet been integrated<br />
into the DB Group’s risk management system. This integration<br />
process will take place during the first half of 2011.<br />
Within our risk management system all risks are shown in<br />
a risk portfolio as well as in a detailed listing, taking materiality<br />
thresholds into account. The risks mentioned in the risk report<br />
are categorized and classified based on the probability of occurrence.<br />
In addition to the possible consequences, the analysis<br />
also contains approaches to and the costs of countermeasures.<br />
In terms of organization, Group controlling serves as the<br />
coordination center for our risk management system within DB<br />
Group. In the context of Group financing, which is strictly oriented<br />
to our operating business, Group Treasury bears responsibility<br />
for the limitation and monitoring of the resultant credit, market<br />
price and liquidity risks. By consolidating the related transactions<br />
(money market, securities, foreign exchange or derivative<br />
transactions) at DB <strong>AG</strong> level, the associated risks are centrally<br />
controlled and limited. Group Treasury is organized to comply<br />
with the “Minimum Requirements for Risk Management”<br />
(MaRisk) formulated for financial institutions and, applying the<br />
criteria derived from these guidelines, fulfills all requirements<br />
of the KonTraG.<br />
Key characteristics of the internal control<br />
and risk management system with regard to the<br />
Group’s accounting process<br />
Our risk management system is supplemented by a Group-wide<br />
internal control system, which also includes accounting-related<br />
processes.<br />
Our internal control system is aligned with criteria defined<br />
by the Committee of Sponsoring Organizations of the Treadway<br />
Commission (COSO) publication: “Internal Control – Integrated<br />
Framework”. The COSO model is a generally accepted theoretical<br />
framework that divides an internal control system into five levels<br />
and then evaluates each level individually. Based on this model,<br />
our accounting-based internal control system is supported by<br />
fundamental control mechanisms such as system-technical and<br />
manual coordination, separate and clearly defined functions,<br />
and the observance of guidelines that are applicable across the<br />
Group, and special work instructions.<br />
In addition to the aforementioned instruments the following<br />
accounting-based control mechanisms are used in DB Group:<br />
unified Group-wide reports based on the standard software<br />
Hyperion Financial Management (HFM) are prepared by all of<br />
the consolidated companies that are documented in our core<br />
corporate information system (Firmen Informations System;<br />
FIS), the systematic tracking of changes in accounting rules<br />
based on IFRS or the German Commercial Code (HGB), the<br />
regular and comprehensive update of the corresponding balance<br />
sheet guidelines and accounting-based systems, the uniform<br />
item number plan and the provision of the necessary information<br />
to the persons responsible for preparing the reports. The audit<br />
activities of the corporate auditors, which represent a key element<br />
of our control activities as a process independent instrument,<br />
are focused on evaluating the appropriateness and<br />
effectiveness of our internal control system. Beyond this, audits<br />
are also conducted within the framework of inventories of assets<br />
and reserves. Our control mechanisms are complemented by<br />
the work of the audit and compliance committee, respectively<br />
the Supervisory Board, as well as by the activities of the Group<br />
auditor during the execution of his legally mandated audit.
| GROUP MAN<strong>AG</strong>EMENT REPORT<br />
| Risk report<br />
125<br />
Based on a binding schedule for closing the books, accounting<br />
materials are prepared by the decentralized bookkeeping departments<br />
in accordance with IFRS principles and primarily with SAP<br />
standard software, while observing valid uniform Group procedures.<br />
This information is then transmitted to the centrally<br />
managed HFM system.<br />
The respective management of the companies included in<br />
the scope of consolidation and of our individual business units<br />
confirm the correctness of data, among other criteria, that is<br />
relevant for the annual financial statements in a quarterly internal<br />
reporting process. The confirmation report states, in particular,<br />
that the financial data submitted by the reporting unit provides<br />
a fair and true presentation of their major areas of business as<br />
well as the unit’s asset, financial and income situation. In addition,<br />
it also confirms that the responsible management has<br />
established the centrally defined internal control system for<br />
reporting and, if necessary, has supplemented this with their<br />
own internal control system.<br />
No changes were made to DB Group’s internal control system<br />
between the time when the balance sheet was prepared and<br />
when the management report was prepared.<br />
KEY RISK CATEGORIES AND INDIVIDUAL RISKS<br />
In particular, key risks to DB Group’s income statement are:<br />
General economic risks<br />
Demand for our mobility services, and especially our transport<br />
and logistics services, is also dependent on overall economic<br />
development. Economic growth drives the megatrends in our<br />
relevant markets, which in turn are key drivers of our corporate<br />
strategy. For this reason, general economic shocks like the<br />
economic and financial crises can have a negative impact on our<br />
business.<br />
A key influencer of passenger transport is the development<br />
of major economic factors, such as personal disposable income<br />
and the level of employment.<br />
The most critical factor in the rail freight transport business<br />
is freight demand for consumer goods, coal, iron and steel, oil,<br />
chemical products and construction materials. These, on the one<br />
hand, are subject to cyclical fluctuations. On the other hand, we<br />
must consider structural changes in the production structures of<br />
our customers, who are frequently involved in global competition.<br />
In the area of freight forwarding and logistics, demand for<br />
storage and transport services depends on our customers’ economic<br />
development.<br />
Market risks<br />
We face tough intermodal and intramodal competition in the<br />
German passenger transport market, especially from motorized<br />
individual transport, which is the dominant competitor. We are<br />
continuously improving our service performance in order to<br />
strengthen our competitive position. On the offer side we are<br />
optimizing the structure of our scheduled services as part of our<br />
regular schedule updates. We are able to offer more attractive<br />
connections on many routes after completing measures to<br />
improve the infrastructure. We use numerous special offers and<br />
promotions as part of our efforts to improve our customers’<br />
perception of our prices. In addition, we regularly employ sales<br />
promotion measures to specifically target new customers. The<br />
further development of punctuality, which is subject to strict<br />
monitoring, remains important.<br />
Intensive intramodal competition exists across Europe for<br />
long-term service contracts in the regional transport sector. In<br />
order to assert ourselves in this market environment we are<br />
continuously optimizing our tender management and cost structures<br />
so we can submit attractive bids that make economic sense.<br />
Considerable intermodal competitive pressure exists in the<br />
rail freight transport sector in addition to the increasing intensity<br />
of intramodal competition. This situation is being exacerbated<br />
by the increasing market significance of low-cost truck fleets<br />
from the new EU member states. In an isolated analysis of rail<br />
freight transport we can see market risks arising from the necessity<br />
to adjust to the increasing intensity of intermodal competition<br />
and the resulting margin losses. We react to this with<br />
measures to further improve our efficiency and reduce costs.<br />
Furthermore, we are optimizing our range of rail-related services<br />
and integrating rail freight transport into a comprehensive range<br />
of logistics services.<br />
Our activities in the freight forwarding and logistics segments<br />
are especially influenced by competitive markets, highly<br />
dynamic consolidation processes within the logistics sector and<br />
further increases in customer demands. We respond to these<br />
challenges by further expanding our network in order to not<br />
only defend our market positions, but also to strengthen them<br />
from a position of competitive strength.
126<br />
| DEUTSCHE BAHN GROUP<br />
Due to the special nature of the business, our air freight activities<br />
face risks arising from the submission of clearance declarations<br />
to airlines, which could lead to serious consequences in individual<br />
cases. Over the past few years the rules for granting customs<br />
guarantees have been continuously revised and improved. In<br />
addition, we strictly observe country-specific safety regulations<br />
governing shipments of air and ocean freight. Furthermore,<br />
country-related practices regarding clearance of shipments must<br />
also be taken into account.<br />
Across the entire DB Group we combat risks arising from<br />
changing customer demand or shifts in traffic flows with intensive<br />
market observation and by continuously upgrading our<br />
portfolio. In regard to market risks related to changing legal<br />
conditions at domestic or international levels, we actively submit<br />
our position into preliminary consultations and discussions.<br />
Operating risks<br />
We operate a technologically complex, networked production<br />
system within the rail transport sector. Risks arise for our rail<br />
activities due to service interruptions, in particular because of<br />
the resulting decline in punctuality. A substantial reduction in<br />
punctuality in long-distance transport diminishes the perceived<br />
quality of service and can lead to a loss of customers. Furthermore,<br />
in regional transport there is also the additional risk of<br />
incurring penalty fees levied by the responsible contracting<br />
organization in the event of train cancellations or insufficient<br />
punctuality. The availability of our vehicle fleet is an additional<br />
critical factor. Significant limitations can endanger scheduled<br />
operations. DB Group attempts to eliminate this risk by taking<br />
precautionary measures and in the case of occurrence to minimize<br />
the impact by, for example, providing substitute vehicles or<br />
organizing substitute transports.<br />
In rail freight transport the punctuality of transports is an<br />
important criteria used by our customers to select the mode of<br />
transport. In addition, irregularities may occur during the conduct<br />
of transport operations such as violations of customs regulations<br />
or theft. We combat these risks by employing qualified customs<br />
coordinators, as well as a special system that immediately notifies<br />
us when tax assessments are received.<br />
We generally counter the risk of operational disturbances with<br />
systematic maintenance and the use of qualified staff, coupled<br />
with continuous quality assurance and the improvement of our<br />
processes. The nature of the railway business as an open system,<br />
however, means that we have limited influence on certain factors<br />
that have a potentially negative impact on our flow of operations.<br />
In this case, we strive to limit the possible consequences.<br />
Technology risks<br />
The range and quality of the services we offer depends greatly<br />
on the availability and reliability of the production resources<br />
used, procured preliminary work as well as the quality of our<br />
partners’ performance. We engage in intensive quality dialogues<br />
with our relevant suppliers and business partners.<br />
In addition, the technical production resources used in rail<br />
transport must fulfill applicable norms and requirements, which<br />
may change over time. As a consequence, technical objections<br />
regarding vehicles could occur. The risk here is that individual<br />
model series or wagon categories cannot be used for operations,<br />
or may only be used on a restricted basis – for example, at lower<br />
speeds, shorter maintenance intervals, or lower wheel set loads.<br />
Furthermore, newly procured vehicles can fail to receive certification<br />
and then not be delivered as agreed with the manufacturer.<br />
These occurrences could lead to disturbances in operational<br />
processes as well as higher expenses.<br />
It cannot be ruled out that the intervals between maintenance<br />
/ultrasound inspections will be further shortened in the<br />
future. Due to this, additional operational restrictions could<br />
occur if the size of the vehicle fleet remains unchanged.<br />
Furthermore, possible changes in norms and the rail infrastructure<br />
are important elements of overall operating conditions.<br />
Here again, operations can be restricted or even cancelled in the<br />
event of deviations from the norm. In order to counter these risks<br />
we have consolidated the respective activities in DB Group and<br />
engage in an active dialogue with the responsible authorities.<br />
Procurement risks<br />
Procurement prices for commodities, energy and transport<br />
services can shift depending on the market situation. Therefore,<br />
depending on the market and competitive situation, it is not<br />
possible – or only possible to a limited extent – to pass on higher<br />
costs to customers. This will have a correspondingly negative<br />
effect on margins.<br />
We counter the risk of higher energy prices through the use<br />
of appropriate A derivative financial instruments [1].<br />
| [1] A Page 195 ff.
| GROUP MAN<strong>AG</strong>EMENT REPORT<br />
| Risk report<br />
127<br />
Project risks<br />
The modernization of the overall rail system involves high<br />
amounts of capital expenditures as well as a large number of<br />
highly complex projects. Changes in the legal framework, delays<br />
in implementation or necessary adjustments during the frequently<br />
multiyear project terms can result in project risks that<br />
have a cross-business unit impact due to the networked production<br />
structures. Furthermore, increased prices for ordered services<br />
or construction measures can lead to negative effects. We<br />
take such risks into account by intensively monitoring our projects.<br />
This particularly applies to our central major projects.<br />
Infrastructure financing risks<br />
A key element of the German Rail Reform Act is the Federal<br />
Government’s constitutional obligation to finance the infrastructure.<br />
The crucial elements are not only a sufficient amount of<br />
resources, but also the predictability of available funds. We<br />
signed the Service and Financing Agreement with the Federal<br />
Government, which covers financing of the existing network<br />
until 2013. However, in order to ensure the long-term competitiveness<br />
of the rail mode of transport, sufficient availability of<br />
funds is required to ensure systematic new construction, expansion<br />
and elimination of bottlenecks (requirement plan capital<br />
expenditures). Our mid-term corporate plans assume Federal<br />
funding will be forthcoming for the successful realization of<br />
these capital expenditures, although a corresponding agreement<br />
could not yet be concluded. Moreover, there is also the risk that<br />
the Federal Government may demand refunds due to an audit<br />
of how Federal funds were employed.<br />
Risks related to reduced concession fees<br />
The amount of financial resources available to the contracting<br />
organizations to order routes from transport companies is the<br />
key factor driving development in the regional transport market<br />
in Europe. For this reason payments generally received from<br />
state or state-financed contracting organizations (concession<br />
fees) represent a major portion of revenues in regional passenger<br />
transport. Against the background of the public sector’s need<br />
to make budget cuts there is a risk that the level of concession<br />
fees available for future tenders or existing services may be<br />
reduced. We counter this risk by making corresponding adjustments<br />
to our service offer and by increasing our farebox revenues.<br />
Financial risks<br />
We counter risks associated with interest rates, foreign exchange<br />
and energy prices arising from our business operations with,<br />
among other things, original and derivative financial instruments.<br />
These A instruments [1] are explained in the Notes.<br />
Exchange rate risks have risen as we expanded our international<br />
business activities because of cash flows generated in<br />
different currencies. This applies, in particular, to the US dollar,<br />
the British pound and the Swedish krona.<br />
A portion of our obligations stemming from pension benefits<br />
and other pension-benefit-related commitments is covered<br />
by plan assets consisting of stocks, property, fixed-income<br />
securities and other assets. Declines in the value of these assets<br />
directly reduce the extent of pension benefit obligations covered<br />
by plan assets and can, under certain circumstances, lead to the<br />
company making additional allocations.<br />
Based on our good A ratings [2] we have very good<br />
access to the capital markets. In order to ensure DB Group’s<br />
solvency and financial flexibility at all times we have cash and<br />
cash equivalents at our disposal as well as credit facilities, a<br />
€ 2 billion commercial paper program and a € 15 million debt<br />
issuance program. Within the framework of our cross-Group<br />
cash-pooling arrangement we ensure that funds can be made<br />
available within the Group as needed.<br />
Legal and contractual risks<br />
Legal risks may arise, for instance, in the form of claims for<br />
damages and from legal disputes. These frequently stem from<br />
construction projects, real estate transactions, or environmentrelated<br />
issues. Moreover, there is also the risk that some of the<br />
long-term transport contracts may become uneconomical due<br />
to unforeseen increases in costs. In cases like this we try to<br />
counter the negative effects with commensurate measures to<br />
reduce costs and raise income.<br />
Provisions are made for legal and contractual risks after<br />
estimating the respective probability of occurrence. The actual<br />
utilization of these provisions depends on whether the risks<br />
materialize to the extent as set forth in our current estimates.<br />
| [1] A Page 195 ff.<br />
| [2] A Page 97
128<br />
| DEUTSCHE BAHN GROUP<br />
Regulatory and political risks<br />
Changes in the overall legal conditions at national or European<br />
level could result in risks for our business. DB Group provides<br />
rail transport service in a regulated market. Access to the German<br />
railway network has been available on a non-discriminatory basis<br />
since 1994. Regulatory measures also affect the individual components<br />
of pricing systems and terms of use of our rail infrastructure<br />
companies such as their pricing systems and terms of<br />
use. In this area there is a risk that a complaint may be submitted<br />
to the regulatory authorities and that they may respond.<br />
The structure of DB Group has potential exposure to regulatory<br />
risks. These risks could arise on both the national as well<br />
as the European level.<br />
Political risks refer to, in particular, the tightening of existing<br />
norms and rules that apply to railway activities.<br />
Personnel risks<br />
Our employees and their skills are of central importance for our<br />
future success. Our remuneration systems and personnel development<br />
programs and measures are aimed at enhancing the loyalty<br />
of our employees and motivating them to turn in top performance.<br />
Unwanted staff departures remain at a consistently low level.<br />
This, on the one hand, reflects our efforts to raise the commitment<br />
and identification of employees with the Group. On the<br />
other hand, it shows our attractiveness as an employer. Furthermore,<br />
we are faced with increasing competition for highly qualified<br />
specialists and executives. Among other measures we are<br />
taking, we are meeting this challenge by maintaining close<br />
contacts with universities, and through our recruiting measures.<br />
During the integration period for newly acquired companies we<br />
concentrate our efforts on raising the loyalty of employees in<br />
key positions.<br />
In order to assert ourselves in competition, the structure<br />
of our personnel expenses in comparison to our competitors is<br />
of decisive importance. Additional one-sided burdens, such as<br />
higher wage agreements than those negotiated by our competitors,<br />
worsen our competitive position. In the future, the<br />
conclusion of sector-wide wage agreements will set uniform<br />
standards for the German regional transport market.<br />
Compliance risks<br />
The restructuring of our Compliance department in 2009 documented<br />
that we are committed to ensuring that every DB Group<br />
employee views the full observance of valid laws, corporate<br />
guidelines and recognized regulatory standards as an assignment<br />
and an obligation. We further expanded our Compliance organization<br />
during the year under review to ensure behavior that<br />
conforms to the rules. More details on this subject may be found<br />
in the A Compliance report [1].<br />
IT risks<br />
Insufficient IT management can lead to serious interruptions of<br />
business operations. We employ a wide range of methods and<br />
means to minimize these risks. Ongoing monitoring of system<br />
architecture and the regular renewal of hardware platforms<br />
ensure that our information technology always optimally meets<br />
changing business demands and conforms to the latest state of<br />
technology.<br />
In order to ensure high availability in IT operations, we use<br />
distributed and redundant systems for operations and data backup,<br />
fail-safe network coupling, together with partly outsourced tape<br />
backup and separate administrations. These measures safeguard<br />
critical business and IT processes and prevent serious breakdowns.<br />
Our wide area network (WAN) is designed redundantly wherever<br />
required by security and business continuity.<br />
GENERAL STATEMENT REGARDING<br />
DB GROUP’S RISK SITUATION<br />
The assessment of the current risk situation is based on our risk<br />
management system. The main risks during the year under review<br />
were in the areas of market, production as well as technology<br />
and procurement.<br />
Our analysis of risks, countermeasures, hedges and provisions,<br />
as well as the assessment made by the DB Group Management<br />
Board, has established that, based on the current assessment<br />
of risk and our mid-term planning, there are no risks present<br />
which either individually or in their entirety could permanently<br />
and materially damage DB Group’s asset, financial and earnings<br />
situation. In regards to our organization we have established all<br />
of the prerequisites needed to recognize risks at an early stage.<br />
Our continuous risk management activities and the active supervision<br />
of the main risk categories contribute towards limiting<br />
risks within DB Group.<br />
| [1] A Page 40 f.
| GROUP MAN<strong>AG</strong>EMENT REPORT<br />
| Risk report<br />
|<br />
Events after the balance sheet date<br />
129<br />
Events after the balance sheet date<br />
a Sector-wide agreement in SPNV sector takes effect<br />
a Round of wage talks concluded with EVG<br />
a Additional compensatory services agreed for S-<strong>Bahn</strong> (metro) Berlin<br />
MAINTENANCE INTERVALS FOR ICE TRAINS<br />
ARE CHANGED <strong>AG</strong>AIN<br />
In a letter dated February 16, 2011, DB Fernverkehr <strong>AG</strong> voluntarily<br />
agreed to comply with the Federal Railway Authority’s<br />
(EBA) request to reduce the ultrasound inspection intervals<br />
for the ICE 1 and 2 multiple-unit trains. The decision will be<br />
implemented without delay. In responding to the EBA we clearly<br />
stated that in our considered opinion there was not, nor is<br />
there, any danger to rail transport. Together with the EBA we<br />
are striving to develop a viable model that will provide a scientific<br />
and technical foundation for determining the length of<br />
intervals between ultrasound inspections.<br />
SECTOR-WIDE W<strong>AG</strong>E <strong>AG</strong>REEMENT TAKES EFFECT<br />
IN LOCAL RAIL PASSENGER TRANSPORT<br />
Arbitration talks between the Railway and Transport Workers<br />
Union (Eisenbahn- und Verkehrsgewerkschaft; EVG), the employer,<br />
the Mobility and Transport Services Association (Agv MoVe), as<br />
well as the six largest private train operating companies in the<br />
local rail passenger transport sector – Abellio, Arriva Germany,<br />
BeNEX, Keolis Germany, Veolia Transport and the Hessische<br />
Landesbahn – were concluded on January 17, 2011 and the sectorwide<br />
wage agreement took effect on February 1, 2011. The Agreement<br />
is binding for bids on all tenders and awards on after April 30,<br />
2011. The higher DB wage level also applies to all DB Regio <strong>AG</strong><br />
subsidiary companies as of this date. Furthermore, DB Regio <strong>AG</strong><br />
will no longer participate in tenders in Germany with subsidiaries<br />
that are not bound to the wage agreement. On an overall basis,<br />
the sector-wide wage agreement has notably reduced the competitive<br />
disadvantage we faced in tender processes.<br />
In contrast, the German Train Drivers Union (GDL) stated<br />
that the results of the arbitration talks did not apply to their<br />
members.<br />
ROUND OF W<strong>AG</strong>E TALKS CONCLUDED WITH EVG<br />
We reached an agreement in the <strong>2010</strong> round of wage talks with<br />
the EVG including a two-step increase in wages. Wages will rise<br />
by 1.8 % as of March 1, 2011, and by an additional 2.0 % as of<br />
January 1, 2012.<br />
In addition, preferential payment of 1.0 % per year will be<br />
paid for individual retirement benefits. Furthermore, vacation<br />
pay and extra pay for shiftwork were raised by 1.5 %. The onetime<br />
payments made in December <strong>2010</strong> will also become a part<br />
of the wage agreement.<br />
Agreement was also reached to extend the job security pact<br />
between DB Group and EVG through 2011 and amend it to reflect<br />
current conditions. This agreement continues to rule out layingoff<br />
any DB Group employee for operational reasons. As a result<br />
of this new realignment, agreements reached in 2005 regarding<br />
working hours and monthly pay were partially rescinded. As of<br />
March 1, 2011, employees will work 39 hours a week on a permanent<br />
basis and will again receive full wages for these hours, which<br />
in fact means that as of March 1, 2011 their pay will rise by 2.5 %.<br />
In total, the signed wage agreements will increase personnel<br />
expenses in the 2011 financial year by about 6 % over the comparable<br />
year-ago figure. The wage agreements will be valid for<br />
a term of 29 months and run from August 1, <strong>2010</strong> to December 31,<br />
2012. The agreement concluded the wage negotiations between<br />
DB Group and the EVG.<br />
ADDITIONAL COMPENSATORY SERVICES <strong>AG</strong>REED<br />
DUE TO SERVICE LIMITATIONS AT S-BAHN BERLIN<br />
Due to the ongoing restricted operation of the S-<strong>Bahn</strong> (metro)<br />
Berlin we will be offering our customers in Berlin additional<br />
compensatory services in 2011. In addition to the previously<br />
granted free travel benefits and refunds worth about € 105 million,<br />
supplementary services valued at about € 39 million will<br />
be offered in 2011 bringing the total of all compensatory services<br />
offered to about € 144 million.
130<br />
| DEUTSCHE BAHN GROUP<br />
W<strong>AG</strong>E NEGOTIATIONS WITH THE GDL<br />
At the beginning of February 2011 the GDL stated that their<br />
negotiations with us and the local rail passenger transport companies<br />
Abellio, Arriva Germany, BeNEX, Keolis Germany, Veolia<br />
Transport and the Hessische Landesbahn had failed. At the same<br />
time GDL also announced strikes in rail passenger transport.<br />
BGH DECISION CLARIFIES SITUATION IN GERMAN<br />
REGIONAL TRANSPORT MARKET<br />
While EU law expressly permits direct awards of local transport<br />
lines, and they are common practice across Europe, they have<br />
been disputed issues under German laws up until now. The<br />
BGH has now ruled that the German Cartel Procurement Law<br />
goes beyond European law and requires mandatory tender<br />
procedures.<br />
This landmark decision by the BGH has wide-reaching significance<br />
for the German local transport market. We view ourselves<br />
as well prepared to face additional competition because<br />
in recent years the responsible authorities have primarily used<br />
their selection options to choose tenders over direct awards.<br />
On February 8, 2011 the Federal Court of Justice (BGH) granted<br />
the application submitted by Abellio and declared that the<br />
contractual agreement between the Rhine-Ruhr Transport Association<br />
(Verkehrsverbund Rhein-Ruhr; VRR) and DB Regio NRW<br />
was null and void. This decision affects capital expenditures<br />
worth millions of euros for local transport projects in the Rhine<br />
and Ruhr region. These projects include: as of 2012 only modern<br />
rapid transit trains were to operate throughout the entire VRR<br />
network; elimination of system bottlenecks; added seating<br />
capacities and upgrading the regional transport fleet were<br />
intended to provide passengers with greater comfort and<br />
punctuality.<br />
The Court’s decision revalidates the original contract that<br />
runs until December 2018. We will review the decision and<br />
examine our options while keeping our passengers in the Rhine<br />
and Ruhr region in mind.
| GROUP MAN<strong>AG</strong>EMENT REPORT<br />
| Events after the balance sheet date<br />
| Outlook<br />
131<br />
Outlook<br />
a Economic growth expected to continue at slower pace<br />
a Revenues and profits anticipated to grow in 2011 financial year<br />
a Outlook remains clouded by uncertainty<br />
According to estimates available at the time this report was<br />
prepared, we anticipate that the recovery will continue at a<br />
weaker pace in 2011. Growth projections for the industrialized<br />
nations indicate that the economic recovery is flattening. For<br />
this reason we expect overall economic development in the<br />
2011 financial year will remain favorable but with Germany and<br />
the Eurozone playing a lesser role along with the further recovery<br />
of the global economy and the development of global trade.<br />
FUTURE DIRECTION OF DB GROUP<br />
ECONOMIC OUTLOOK<br />
The following estimates regarding economic development in<br />
2011 are based on the assumption of stable overall geopolitical<br />
development.<br />
Anticipated development [%] <strong>2010</strong> 2011<br />
GDP World +4.0 q<br />
World Trade +13.5 q<br />
GDP Eurozone +1.7 q<br />
GDP Germany +3.6 q<br />
Future business policy<br />
We want to assert our market positions in the 2011 financial year<br />
and continue our business units’ organic growth. The acquisition<br />
of Arriva brought with it a notable expansion of our position in<br />
the European passenger transport market. We want to play a<br />
strong role in this market in the future with our new DB Arriva<br />
business unit. We do not intend to make any fundamental changes<br />
to our business policy in the 2011 financial year.<br />
Future sales markets<br />
Our opportunities for further growth in the German passenger<br />
transport market are limited by our current strong position,<br />
very intense competition and restrictions imposed by cartel<br />
law. Therefore, our main emphasis is correctly placed on<br />
defending our position. The focus of our expectations for future<br />
expansion in passenger transport is on the other European<br />
countries. The takeover of Arriva also means that the European<br />
passenger transport market will play a far more important role<br />
in our future activities.<br />
In the area of rail freight transport our unchanging focus<br />
remains on the European market. Following the build-up of our<br />
network in recent years we are now well-positioned along all of<br />
the central European corridors, and our perspectives extend to<br />
even offering connections to China.<br />
In the freight forwarding and logistics segment we expect<br />
to see strong rates of growth in the ocean and air freight areas,<br />
especially for our business activities in the Asia /Pacific region.<br />
We also want to further expand our contract logistics business<br />
in the coming years by focusing primarily on the automotive,<br />
consumer goods, electronics and industrial sectors.<br />
q above previous year’s figure, e on previous year’s level, w below previous<br />
year’s figure<br />
Data for <strong>2010</strong> is based on information and estimates available on February 22,<br />
2011.<br />
The mixed economic picture of the global economy is likely to<br />
remain unchanged in 2011. We anticipate that the recovery<br />
noted in the industrialized nation will continue although growth<br />
rates are estimated to decline. Structural problems, for example<br />
in the real estate market, do not yet appear to be resolved.<br />
Concurrently, pressures are likely to increase on governments<br />
to consolidate their financial outlays. Export nations are likely<br />
to see their growth slow as demand from emerging markets is<br />
anticipated to weaken. It appears that some of the emerging<br />
countries intend to dampen domestic growth to counter the<br />
threat of their economies overheating and to keep economic<br />
expansion at a lower level. Risks are likely to be generated, in<br />
particular, by the continuing uncertainty in the financial markets<br />
regarding the debt levels and creditworthiness of a number of<br />
industrialized countries.
132<br />
| DEUTSCHE BAHN GROUP<br />
We anticipate that the global economy will continue to grow<br />
further in 2011, albeit at a slower pace. The GDP figure in the<br />
USA is likely to grow more slowly than in the previous year. The<br />
same figure is anticipated to fall by half in Japan due to weaker<br />
exports. Above all, emerging Asian countries are expected to<br />
remain the driving forces behind the global economy. Measures<br />
taken in China to cool the economy will slow Chinese GDP growth<br />
to about 9 %.<br />
The economic recovery in the Eurozone is likely to flatten<br />
out with major differences visible between the individual countries.<br />
While Germany is expected to remain the European growth<br />
locomotive, we believe that growth in France and Italy will<br />
continue at current levels. Nonetheless, we anticipate that the<br />
Eurozone will continue to be burdened by high levels of sovereign<br />
debt owed by some of the member states. The key danger is<br />
that manufacturing could shrink in these countries as the fiscal<br />
influences are notably more restrictive and additional reforms<br />
are still needed in light of their very weak ability to compete on<br />
prices in international markets.<br />
Fiscal consolidation measures are likely to lead to reduced<br />
government spending in 2011, while higher taxes, or the elimination<br />
of tax breaks, are anticipated to shrink disposable income.<br />
Consumer spending is likely to be burdened by low capacity<br />
utilization rates and ongoing problems in the real estate markets<br />
in some of the Eurozone countries. On the other hand, the very<br />
low level of interest rates is expected to further encourage<br />
capital expenditures. Exports are likely to benefit from global<br />
trade, even though it is growing at a weaker pace than in the<br />
previous year. In view of the diminished outlook for the economy<br />
and the phasing out of short-time work (Kurzarbeit), employment<br />
levels are only expected to rise slightly.<br />
The economy is likely to stabilize in most of the countries<br />
in Central and Eastern Europe in 2011. In view of the anticipated<br />
modest expansion of the domestic economy we expect that the<br />
recovery will be primarily driven by foreign trade. We also expect<br />
that demand for capital spending will remain weak in most<br />
countries and consumer spending will be dampened by government<br />
spending cuts and generally rising unemployment levels.<br />
The latent risk of a currency crisis still exists in countries with<br />
macroeconomic imbalances. The region’s GDP is likely to remain<br />
higher than the EU average in the coming years.<br />
The German economy is also likely to continue to recover in<br />
2011, although by about a slower 2.5 % rate of growth due to the<br />
weakening pace of the global recovery. By the end of 2011 overall<br />
economic output for the German economy could return to the<br />
pre-crisis level recorded in the first quarter of 2008. It appears<br />
likely that the upswing will broaden. Although German exports<br />
could remain the primary driver powering the upswing in the<br />
economy, domestic demand is increasingly benefiting from<br />
foreign trade. The pace of growth for exports is likely to track<br />
weaker growth in customer markets in 2011 and slow by almost<br />
50 %. Capital expenditures by companies are expected to rise<br />
further. In addition to outlays to restock inventories and replace<br />
equipment, which were postponed because of the crisis, rising<br />
capacity utilization rates urgently require investments be made<br />
to expand production capacities. The construction sector is<br />
likely to be favorably influenced by increasing demand for residential<br />
housing, which is being driven by the historically low<br />
financing costs.<br />
In contrast, public-sector spending is burdened by the<br />
expiration of the economic stimulus programs and a tight budget<br />
situation at the municipal level. As a result, it has very little<br />
room to expand, and capital spending is likely to be restrained<br />
despite the dynamic pace of growth in the private sector. Supported<br />
by rising employment levels and an improved income<br />
situation, consumer spending is expected to rise notably. The<br />
increase in employment levels in 2011 is likely to grow at a slower<br />
pace than in the previous year due to a statistical base effect.<br />
The unemployment rate is expected to decline, however it will<br />
be hindered by changing overall conditions and a slight rise in<br />
the labor supply. As of May 2011 all of the still existing restrictions<br />
limiting access of workers in Central and Eastern EU member<br />
states to the rest of the EU will expire. This could result in higher<br />
numbers of commuters. Furthermore, the end of the military<br />
draft as of the summer of 2011, as well as the double number of<br />
students completing their upper secondary school education<br />
(Abitur) in some Federal states are likely to increase the domestic<br />
labor pool.<br />
The global economy is currently facing major risks due to<br />
the instable situation in the Arab world. If the political crisis<br />
spreads to the major oil-producing countries it could push commodity<br />
prices even higher and increase the risk of inflation. This<br />
could also lead to a decline in real income levels in industrialized<br />
nations and choke off consumer spending thereby notably hindering<br />
the economic recovery.
| GROUP MAN<strong>AG</strong>EMENT REPORT<br />
| Outlook<br />
133<br />
ANTICIPATED DEVELOPMENT IN<br />
THE RELEVANT MARKETS<br />
Anticipated market development<br />
[%]<br />
<strong>2010</strong> 2011<br />
European rail passenger transport<br />
(based on pkm) +0.0 q<br />
German passenger transport<br />
(based on pkm) +0.2 q<br />
European rail freight transport<br />
(based on tkm) +8.5 q<br />
German freight transport<br />
(based on tkm) +7.1 q<br />
European land transport<br />
(based on revenues) +8.0 q<br />
Global air freight (based on t) +20.6 q<br />
Global ocean freight (based on TEU) +13.0 q<br />
Global contract logistics<br />
(based on revenues) +6.0 q<br />
q above previous year’s figure, e on previous year’s level, w below previous<br />
year’s figure<br />
Data for <strong>2010</strong> is based on information and estimates available on February 22,<br />
2011.<br />
It is anticipated that the German passenger transport market<br />
will be favorably influenced in 2011 by strong gains in employment<br />
and consumer spending over the comparable year-ago<br />
levels, as well as a higher – albeit restrained – increase in real<br />
income. These developments are expected to lead to a moderate<br />
rise in the overall market for the first time in years. Motorized<br />
individual transport is also likely to develop favorably unless<br />
the current high prices for fuel remain unchanged over the course<br />
of 2011. It is expected that domestic air transport volume sold<br />
in Germany will continue to show strong gains. It is still too early<br />
to tell what effect the additional burden posed by the government’s<br />
air transport surcharge will have on demand. Public road<br />
passenger transport should be able to hold its previous year’s<br />
level. It is anticipated that the German rail passenger transport<br />
will post a slightly weaker yet still above-average increase in<br />
volume sold compared to <strong>2010</strong> despite the extensive construction<br />
work taking place in the rail network.<br />
The uneven development noted in individual countries in the<br />
previous year will also continue in the European rail passenger<br />
transport market in 2011. The fiscal consolidation measures<br />
caused by the tight budget situations in an overall weakening<br />
economy are expected to dampen disposable incomes and have<br />
a corresponding effect on demand for transport services. On<br />
average, no major fluctuations are anticipated to occur in the<br />
labor market. Against this background, and in view of the anticipated<br />
supporting effects linked to the ongoing liberalization<br />
process, it may be expected that the European rail passenger<br />
transport market will see overall stable to slightly favorable<br />
development.<br />
Following the last two years, which were marked by the<br />
economic crisis and the subsequent sharp recovery, respectively,<br />
it is anticipated that the freight transport market in Germany<br />
will return to its moderate growth path in 2011. In doing so,<br />
development of rail freight transport should closely track the<br />
overall market’s growth and accordingly hold its share of market.<br />
Truck transport is expected to record an above-average increase<br />
in volume sold resulting in an improvement of its market position,<br />
which will mainly take place at the expense of inland<br />
waterway transport. It is anticipated that competition will remain<br />
highly intense in view of the anticipated sharp increase in transport<br />
prices across the entire market.<br />
Although the recovery of the European rail freight transport<br />
market in 2011 will only continue at a subdued pace due to the<br />
weaker growth stimuli from the economy, we do expect, however,<br />
that it will remain strong. As already noted in the year under<br />
review, notable differences will remain between the individual<br />
countries. We do not expect competitive pressures to lessen in<br />
either the intra- or intermodal market. This applies in particular<br />
to truck competition where, despite the previously announced<br />
sharp price hikes, the road freight transport segment should<br />
continue to expand at a dynamic pace in 2011, which will be even<br />
faster than the rate for rail freight transport.<br />
We estimate that European land transport will grow favorably<br />
in almost all countries in 2011. In total, we expect a growth rate<br />
of more than 10 % in 2011. This dynamic development as well as<br />
the corresponding reduction in available shipping capacities could<br />
improve chances to push through higher prices. However, the<br />
intensive competitive situation, especially among network operators,<br />
could hinder rising prices. Network operators’ capacity<br />
utilization rates will probably continue to increase due to ongoing<br />
economic recovery.
134<br />
| DEUTSCHE BAHN GROUP<br />
We anticipate that the global air freight market will expand by<br />
about 5 % in 2011. In ocean freight we expect that additional cargo<br />
capacities of about 7 % that were added to the market are a little<br />
bit lower than the forecasted growth in demand of about 8 %.<br />
We expect the contract logistics/SCM market to continue<br />
developing strongly in 2011 as all of the important core countries<br />
for global contract logistics are anticipated to post further<br />
economic growth. Furthermore, favorable effects are expected<br />
from an additional increase in the outsourcing rate in the relevant<br />
industries.<br />
Following the substantial increase in demand for train-path<br />
seen during the year under review we anticipate that it will<br />
stabilize at the previous year’s level in 2011. We expect the<br />
number of station stops to increase further in 2011. The outlook<br />
for additional rental business is also favorable due to the<br />
improved overall conditions for the retail trade and the food<br />
and beverage business. We believe that retail trade revenues in<br />
Germany will rise slightly once again in 2011.<br />
International demand for crude oil and refinery products is also<br />
likely to grow in 2011 and set a new record. Although the current<br />
supply situation remains comfortable, the sustained and continual<br />
growth of the emerging markets again raise the risk of supply<br />
bottlenecks over the mid-term. As long as the Organization of<br />
Petroleum Exporting Countries (OPEC) does not respond to<br />
dwindling stockpiles of oil by increasing their production, the<br />
excessive levels of liquidity available in the global financial<br />
markets make it more likely that we will again see prices of USD<br />
100/bbl and more.<br />
Beyond these considerations, additional costs are anticipated<br />
based on the overall conditions contained in the Federal<br />
Government’s energy concept which foresees coupling the<br />
extended lifetimes of nuclear power plants in Germany to additional<br />
costs generated by the related tax on nuclear fuel elements<br />
(Brennelementesteuer) plus required investments. These costs<br />
will place an added burden on energy prices in 2011. The spot<br />
market for gas is still in its early stages in most parts of Europe<br />
and is heavily influenced by local conditions<br />
ANTICIPATED DEVELOPMENT OF THE<br />
PROCUREMENT AND CAPITAL MARKETS<br />
We do not anticipate that we will encounter any major bottlenecks<br />
on the procurement side during the 2011 financial year. The further<br />
development of energy prices will play a decisive role. In general,<br />
we anticipate that energy and commodity prices will rise.<br />
Rising energy prices are likely<br />
While the outlook for the year under review was marked by great<br />
uncertainty, in the interim most of the market observers believe<br />
that the crisis is over. It is expected that energy prices will also<br />
rise in 2011 driven by unbroken robust growth in the emerging<br />
markets as well as a stabilizing upswing in the industrialized<br />
countries coupled with the central banks’ unchanged expansive<br />
monetary policy.<br />
High level of sovereign bond issues expected<br />
During the year under review the total volume of bonds issued by<br />
sovereign states, banks and companies in the Eurozone amounted<br />
to about € 1.7 trillion. We do not anticipate that the volume of new<br />
issues will be lower in 2011. Based on the premise of sluggish<br />
economic growth, we anticipate that not only will maturing bonds<br />
with a nominal value of € 2.0 trillion have to be refinanced in 2011,<br />
we also foresee a further increase in the level of debt in the capital<br />
markets. In this context it may also be expected that companies<br />
will tap the bond markets to a greater extent than before in<br />
response to banks’ more restrictive lending conditions.
| GROUP MAN<strong>AG</strong>EMENT REPORT<br />
| Outlook<br />
135<br />
Due to the unchanging high refinancing needs of Eurozone countries,<br />
and assuming companies will have a relatively favorable<br />
cash flow situation, we anticipate that the sovereign bond share<br />
of the capital market will expand in 2011. We also anticipate that<br />
companies with good credit ratings will continue to have good<br />
access to the capital market in this environment, even if economic<br />
growth should slow.<br />
The anticipated further strong use of the capital markets<br />
by sovereign and supranational issuers and the resulting greater<br />
offer of debt instruments in the market should generate more<br />
attractive yields for investors. The continuation of the economic<br />
recovery should also lead to higher interest rates in the mid-term.<br />
We therefore expect that long-term interest rates for financing<br />
will be higher than in <strong>2010</strong>, even for bonds issued by companies<br />
with good credit ratings.<br />
ANTICIPATED DEVELOPMENT OF IMPORTANT<br />
BUSINESS CONDITIONS<br />
On September 17, <strong>2010</strong> the European Commission opened legislative<br />
proceedings to recast the first European railway package.<br />
It is anticipated that the proceedings will be concluded in 2011.<br />
The proposed new version includes stricter regulation of access<br />
to service facilities (e.g. terminals); wider authority for national<br />
regulatory agencies as well as detailed requirements for infrastructure<br />
financing arrangements between infrastructure operators<br />
and member states; changes to charging schemes; stricter<br />
unbundling requirements; the introduction of noise-based trainpath<br />
usage fees, as well as requirements related to regulatory<br />
accounting procedures.<br />
Irrespective of the European development, the German<br />
Federal Ministry of Transport, Building and Urban Affairs<br />
announced an amended version of regulations for 2011. Based<br />
on the terms of the coalition agreement, the amended version<br />
should, in particular, introduce stricter charging rules (e.g.<br />
introduction of an incentive rule).<br />
ANTICIPATED INCOME SITUATION<br />
DB Group<br />
Anticipated development<br />
[ € million ]<br />
<strong>2010</strong> 2011<br />
Revenues (excluding DB Arriva) 33,364 q<br />
EBIT adjusted 1,866 q<br />
ROCE 6.0 % q<br />
Gross capital expenditures 6,891 q<br />
Net financial debt 16,939 e<br />
q above previous year’s figure, e on previous year’s level, w below previous<br />
year’s figure<br />
Based on current estimates we anticipate that revenues will continue<br />
to increase in the 2011 financial year following the strong<br />
development noted in the year under review. However, due to the<br />
diminished economic expectations, they are likely to be lower on<br />
a comparable basis than revenues recorded for the year under<br />
review and show a gain of about 5 %. The effective increase will<br />
be notably higher due to the first-time full inclusion of Arriva in<br />
the scope of consolidation for the 2011 financial year.<br />
It is anticipated that the continued favorable development<br />
of revenues and our cost management measures will also be<br />
reflected in the adjusted EBIT figure, which is expected to improve<br />
further in the 2011 financial year. Critical factors influencing the<br />
development of profits in the 2011 financial year will be the availability<br />
of vehicles in the rail transport segment, as well as the<br />
development of margins in our rail freight transport and freight<br />
forwarding businesses. Moreover, additional expenses will be<br />
incurred for measures taken to improve the quality of service.<br />
Based on the currently anticipated increase in the adjusted<br />
EBIT figure we expect that the ROCE figure will also advance<br />
further towards its target of 10 %. This development is likely to<br />
be hindered by the volume of capital employed in 2011 which is<br />
expected to rise due to extensive capital expenditures planned<br />
for the year.<br />
We will continue our modernization efforts at an unbroken<br />
high level of capital expenditures. It is likely that these outlays<br />
will be considerably higher in 2011 than the comparable figure<br />
noted for the year under review.<br />
It is anticipated that higher gross capital expenditures will<br />
also result in higher net capital expenditures. In this context it<br />
should be noted that DB <strong>AG</strong> will probably distribute a first-time<br />
dividend of € 500 million to its owner for the <strong>2010</strong> financial year.<br />
Net financial debt as of December 31, 2011 should remain at the<br />
same level as in the year under review.
136<br />
| DEUTSCHE BAHN GROUP<br />
Business units<br />
Anticipated development [ € million ] Revenues EBIT adjusted<br />
<strong>2010</strong> 2011 <strong>2010</strong> 2011<br />
DB <strong>Bahn</strong> Long-Distance 3,729 q 117 q<br />
DB <strong>Bahn</strong> Regional (incl. DB <strong>Bahn</strong> Urban) 8,831 q 791 q<br />
DB Arriva 1,046 q 55 q<br />
DB Schenker Rail 4,584 q 12 q<br />
DB Schenker Logistics 14,310 q 304 q<br />
DB Services 1,274 e 129 w<br />
DB Netze Track 4,580 q 601 q<br />
DB Netze Stations 1,044 q 217 q<br />
DB Netze Energy 2,501 q 82 e<br />
q above previous year’s figure, e on previous year’s level, w below previous year’s figure<br />
DB BAHN LONG-DISTANCE<br />
Based on improved vehicle availability in the DB <strong>Bahn</strong> Long-<br />
Distance business unit, and a further optimization of our offers,<br />
we anticipate that this unit will post higher volume sold and<br />
better revenues for the 2011 financial year despite burdens posed<br />
by extensive construction activities within the network. The<br />
anticipated favorable performance should also offset the rising<br />
level of expenses and permit the adjusted EBIT figure to surpass<br />
the same year-ago figure.<br />
DB BAHN REGIONAL (INCLUDING DB BAHN URBAN)<br />
Revenues and adjusted EBIT are expected to rise and be driven<br />
by improved offers in rail and bus transport.<br />
DB SCHENKER LOGISTICS<br />
Following the notable gains seen during the year under review,<br />
we anticipate that the DB Schenker Logistics business unit will<br />
also see further substantial improvements – driven by both<br />
volume and pricing effects – in the 2011 financial year. This<br />
development should also impact favorably on adjusted EBIT.<br />
DB SERVICES<br />
We expect that total revenues generated by non-Group and<br />
Group customers will remain at the previous year’s level in the<br />
2011 financial year. We also expect that we will incur expenses<br />
that cannot be passed on to customers and will likely lead to a<br />
decline in the adjusted EBIT figure.<br />
DB ARRIVA<br />
In the 2011 financial year the DB Arriva business unit will be<br />
fully included in the scope of consolidation for the first time.<br />
This will also have a commensurate favorable effect on revenues<br />
and profits.<br />
DB SCHENKER RAIL<br />
In the wake of the favorable development noted for the DB<br />
Schenker Rail business unit during the year under review, we<br />
anticipate additional, notable improvements in 2011. Based on<br />
continuing, albeit weaker, economic growth, we anticipate that<br />
shipping volume will continue to increase. This development<br />
should also favorably affect revenues and adjusted results.<br />
DB NETZE TRACK<br />
Driven by increased volume and prices we anticipate that the<br />
DB Netze business unit’s revenues will also rise further in the<br />
2011 financial year. Increased revenues as well as further rationalization<br />
measures are expected to have a favorable effect on<br />
the adjusted EBIT figure.<br />
DB NETZE STATIONS<br />
We anticipate that revenues earned by the DB Netze Stations<br />
business unit will be slightly higher than the level seen for the<br />
year under review. We further expect that profits will also exceed<br />
the same year-ago figure.<br />
DB NETZE ENERGY<br />
Revenue trends seen during the year under review are also<br />
expected to continue in the 2011 financial year resulting in higher<br />
external revenues than in the previous year. We anticipate profits<br />
to move sideways.
| GROUP MAN<strong>AG</strong>EMENT REPORT<br />
| Outlook<br />
137<br />
ANTICIPATED FINANCIAL SITUATION<br />
The focus of our capital expenditures in the 2011 financial year<br />
will again be on rail infrastructure in the DB Netze Track business<br />
unit. There will also be increased capital expenditures for<br />
vehicles in the DB <strong>Bahn</strong> Regional and DB <strong>Bahn</strong> Long-Distance<br />
business units.<br />
Gross capital expenditures will again be covered in large<br />
part by A investment grants [1] in the 2011 financial year,<br />
primarily through funds from the Federal Government for infrastructure<br />
financing.<br />
The level of net capital expenditures that we must finance<br />
ourselves is expected to increase significantly in the 2011 financial<br />
year. In consideration of the constant positive cash flow<br />
from operations expected over the course of the year, we should<br />
be able to cover these by internal means. Possible portfolio<br />
changes due to M & A activities are not taken into consideration.<br />
In the 2011 financial year, DB Group will have maturing<br />
financial obligations of about € 2.2 billion. In order to partially<br />
refinance these obligations, we will again make use of the capital<br />
and financial markets in the 2011 financial year. We will have<br />
unchanged and appropriate financing scope based on our debt<br />
issuance program, our commercial paper program and existing,<br />
hitherto untapped credit facilities. Thus the short-term and<br />
medium-term liquidity supply for DB Group is assured.<br />
As of December 31, <strong>2010</strong>, € 11.8 billion of the € 15 billion<br />
debt issuance program created for the long-term area had been<br />
drawn down. As a result of the redemption of a USD 1.2 billion<br />
bond that matured in January 2011 (€ 1.0 billion), the available<br />
issuing amount for our debt issuance program increased to<br />
€ 4.2 billion at the start of the 2011 financial year.<br />
In the short-term area, a multi-currency multi-issuer commercial<br />
paper program of over € 2 billion was available as of December 31,<br />
<strong>2010</strong>. As of that date, € 42 million of this amount had been drawn<br />
down. In addition, as of December 31, <strong>2010</strong> we had € 2.5 billion<br />
in guaranteed untapped, broadly diversified credit facilities that<br />
were concluded with first-class credit institutions.<br />
We will continue our M & A activities in a selective and<br />
focused way in the 2011 financial year. We do not expect these<br />
activities to have any significant effects on our financial situation<br />
for the 2011 financial year.<br />
ANTICIPATED DEVELOPMENT IN<br />
THE 2012 FINANCIAL YEAR<br />
In accordance with Rule 15 of the German Accounting Standards<br />
(<strong>Deutsche</strong>r Rechnungslegungsstandard; DRS) we will also state<br />
our estimate for the year following the current financial year.<br />
It is based on the assumptions made in our medium-term planning<br />
regarding market development, competition and overall<br />
conditions, as well as on our success in implementing planned<br />
measures. However, these assumptions and estimates involve<br />
greater uncertainties the farther they look into the future.<br />
Based on the assumption that the economic upswing will<br />
develop as anticipated and continue beyond 2011, we also believe<br />
that we will record further increases in both revenues and<br />
adjusted EBIT. Based on our current assessment we expect that<br />
our ROCE will improve further towards the target level of 10 %.<br />
| [1] A Page 101
138<br />
| DEUTSCHE BAHN GROUP<br />
OPPORTUNITIES REPORT<br />
Our opportunity management efforts are mainly driven by our<br />
business units’ targets and strategies. Operational management<br />
personnel in the business units are primarily responsible for<br />
the early and regular identification, analysis and management<br />
of opportunities. These activities are an integral element of<br />
the Group-wide planning and controlling system. We focus<br />
intensely on detailed analyses of our markets and competitors,<br />
market scenarios, relevant cost drivers and critical factors for<br />
success – including those within our political and regulatory<br />
environment. Concrete business-unit-specific opportunities are<br />
derived from these efforts and then analyzed.<br />
To secure our corporate strategy of profit-focused growth,<br />
we implemented comprehensive packages as part of Group-wide<br />
or business-unit-specific programs which we anticipate will ensure<br />
or improve our performance quality, efficiency and cost structures.<br />
Here we also see opportunities for further organic growth,<br />
which are likely to be reflected in the further improvement of<br />
our results and key financial ratios.<br />
The strategic orientation of DB Group proved to be successful<br />
during the financial and economic crisis, and contributed significantly<br />
to our favorable development during the year under review.<br />
The focus of our measures is always on improving our long-term<br />
competitive position. Overall, DB Group is well-positioned to<br />
benefit from opportunities arising from significant trends in our<br />
markets. In conjunction with this, we invite the reader to review<br />
the remarks made in the A Strategy [1] chapter.<br />
The relevant overall economic conditions could improve more<br />
in total than we anticipate. Any resulting deviations would then<br />
have a positive effect on DB Group and its business units.<br />
Despite the very intensive competitive situation in our<br />
markets, we also see market-related opportunities arising from<br />
the foreseeable market consolidation, and we want to use our<br />
leading market position to actively shape the process. We want<br />
to realize the opportunities offered by the consolidation process,<br />
in particular, and by the continuing globalization of the freight<br />
forwarding and logistics segments. The acquisition of Arriva has<br />
also significantly improved our position in the European transport<br />
market, and we now have a growth platform for all of our European<br />
target markets.<br />
We have also positioned ourselves in such a way that we<br />
are well prepared to use the opportunities posed by open or<br />
opening markets in European rail freight as well as in European<br />
rail passenger transport.<br />
Favorable exchange rates and interest rate moves could<br />
have a potentially favorable impact on our financial results.<br />
Group Treasury is therefore closely following developments in<br />
the financial markets to identify and take advantage of possible<br />
opportunities.<br />
| [1] A Page 104 ff.
| GROUP MAN<strong>AG</strong>EMENT REPORT<br />
| Outlook<br />
139<br />
OVERALL STATEMENT REGARDING THE<br />
ECONOMIC DEVELOPMENT OF DB GROUP<br />
After the strong recovery of the global economy during the year<br />
under review, the DB <strong>AG</strong> Management Board believes that the<br />
economic recovery will continue at a slower pace in 2011.<br />
We expect uneven development in our relevant markets.<br />
While the Management Board anticipates that German passenger<br />
transport, European land transport and global contract logistics<br />
will show stronger growth rates than in <strong>2010</strong>, the development<br />
of the German freight transport and global air freight markets<br />
is expected to lag behind the very high growth rates reported<br />
for the year under review. For 2011, we anticipate a further<br />
increase in energy prices and a very high level of issuing activity,<br />
particularly for sovereign bonds.<br />
Following the strong development noted in the year under<br />
review, we expect revenues to rise further in the 2011 financial<br />
year based on current estimates. With the exception of the DB<br />
<strong>Bahn</strong> Regional business unit, we expect this development to be<br />
reflected in all of our individual business units. The adjusted<br />
EBIT should also continue to improve in the 2011 financial year.<br />
We expect to see further improvements here in nearly every<br />
business unit.<br />
In addition to the positive cash flow from ongoing business<br />
operations, our good credit standing also assures us very good<br />
access to the capital market.<br />
Our activities are subject to various risks, which were described<br />
in the Risk <strong>Report</strong>. For 2011, we particularly see risks relating<br />
to the sustainability of the economic recovery, which could<br />
materialize especially if the sovereign debt crisis worsens. In<br />
addition, the continued tight availability of vehicles and the<br />
increased level of construction activity in the high-speed rail<br />
network are also critical factors.<br />
However, the Management Board believes that DB Group<br />
is well positioned to protect itself against the current risks. We<br />
want to further strengthen our market position and decisively<br />
implement our strategy. For this reason we believe that the<br />
overall outlook for DB Group is favorable.<br />
Assuming continued positive overall conditions, we anticipate<br />
that our relevant markets and DB Group’s economic progress<br />
will continue to develop favorably in 2012.<br />
These estimates are, as always, subject to the following<br />
reservations set forth below.<br />
FORWARD-LOOKING STATEMENTS<br />
This Management <strong>Report</strong> contains statements and forecasts pertaining to the<br />
future development of DB Group, its business units and individual companies. These<br />
forecasts are estimates we made based on information that was available at the<br />
current time. Actual developments and currently expected results may vary in the<br />
event that assumptions that form the basis for the forecasts do not take place, or<br />
risks – for example, those presented in the Risk <strong>Report</strong> – actually occur.<br />
DB Group does not intend or assume any obligation to update the statements<br />
made within this Management <strong>Report</strong>.
05 CONSOLIDATED<br />
FINANCIAL<br />
STATEMENTS<br />
AUDITORʼS REPORT 142<br />
CONSOLIDATED STATEMENT OF INCOME 143<br />
CONSOLIDATED BALANCE SHEET 144<br />
CONSOLIDATED STATEMENT OF CASH FLOWS 146<br />
CONSOLIDATED STATEMENT OF CHANGES IN EQUITY 147
NOTES TO THE CONSOLIDATED FINANCIAL STATEMENTS 148<br />
SEGMENT REPORTING 148<br />
BASIC PRINCIPLES AND METHODS 150<br />
NOTES TO THE INCOME STATEMENT 1 76<br />
NOTES TO THE BALANCE SHEET 184<br />
NOTES TO THE CASH FLOW STATEMENT 224<br />
NOTES TO THE SEGMENT REPORT 224<br />
RISK MAN<strong>AG</strong>EMENT AND DERIVATIVE FINANCIAL INSTRUMENTS 227<br />
OTHER DISCLOSURES 234
142<br />
| DEUTSCHE BAHN GROUP<br />
Auditorʼs report<br />
We have audited the consolidated financial statements prepared<br />
by <strong>Deutsche</strong> <strong>Bahn</strong> Aktiengesellschaft, Berlin, comprising the<br />
consolidated statement of income and the reconciliation of the<br />
consolidated comprehensive income, the consolidated balance<br />
sheet, consolidated statement of cash flows, consolidated statement<br />
of changes in equity and the notes to the consolidated<br />
financial statements, together with the group management<br />
report for the business year from January 1 to December 31, <strong>2010</strong>.<br />
The preparation of the consolidated financial statements and<br />
the group management report in accordance with IFRS as adopted<br />
by the EU, and the additional requirements of German commercial<br />
law pursuant to §315a (1) HGB are the responsibility of<br />
the parent company’s management board. Our responsibility is<br />
to express an opinion on the consolidated financial statements<br />
and on the group management report based on our audit.<br />
We conducted our audit of the consolidated financial statements<br />
in accordance with §317 HGB and German generally<br />
accepted standards for the audit of financial statements promulgated<br />
by the Institut der Wirtschaftsprüfer (IDW). Those<br />
standards require that we plan and perform the audit such that<br />
misstatements materially affecting the presentation of the net<br />
assets, financial position and results of operations in the consolidated<br />
financial statements in accordance with the applicable<br />
financial reporting framework and in the group management<br />
report are detected with reasonable assurance. Knowledge of<br />
the business activities and the economic and legal environment<br />
of the Group and expectations as to possible misstatements are<br />
taken into account in the determination of audit procedures.<br />
The effectiveness of the accounting-related internal control<br />
system and the evidence supporting the disclosures in the consolidated<br />
financial statements and the group management report<br />
are examined primarily on a test basis within the framework of<br />
the audit. The audit includes assessing the annual financial<br />
statements of those entities included in consolidation, the<br />
determination of the entities to be included in consolidation,<br />
the accounting and consolidation principles used and significant<br />
estimates made by the management board, as well as evaluating<br />
the overall presentation of the consolidated financial statements<br />
and the group management report. We believe that our audit<br />
provides a reasonable basis for our opinion.<br />
Our audit has not led to any reservations.<br />
In our opinion, based on the findings of our audit the consolidated<br />
financial statements comply with IFRS as adopted by the EU,<br />
and the additional requirements of German commercial law<br />
pursuant to §315a (1) HGB and give a true and fair view of the<br />
net assets, financial position and results of operations of the<br />
Group in accordance with these requirements. The group management<br />
report is consistent with the consolidated financial<br />
statements and as a whole provides a suitable view of the Group’s<br />
position and suitably presents the opportunities and risks of<br />
future development.<br />
Berlin, February 25, 2011<br />
PricewaterhouseCoopers<br />
Aktiengesellschaft<br />
Wirtschaftsprüfungsgesellschaft<br />
Gerd Eggemann<br />
Thomas Kieper<br />
Wirtschaftsprüfer<br />
Wirtschaftsprüfer<br />
(German Public Auditor)<br />
(German Public Auditor)
| CONSOLIDATED FINANCIAL STATEMENTS<br />
| Auditorʼs report<br />
| Statement of income<br />
143<br />
Consolidated statement of income<br />
January 1 through December 31 [ € million ] Note <strong>2010</strong> 2009<br />
Revenues (1) 34,410 29,335<br />
Inventory changes and internally produced and capitalized assets (2) 2,207 1,936<br />
OVERALL PERFORMANCE 36,617 31,271<br />
Other operating income (3) 3,120 3,864<br />
Cost of materials (4) – 19,314 –15,627<br />
Personnel expenses (5) – 11,602 –11,115<br />
Depreciation (6) –2,912 –2,825<br />
Other operating expenses (7) – 4,092 –3,360<br />
OPERATING PROFIT (EBIT) 1,817 2,208<br />
Result from investments accounted for using the equity method (8) 17 9<br />
Net interest income (9) – 911 –826<br />
Other financial result (10) –23 –4<br />
FINANCIAL RESULT –917 –821<br />
PROFIT BEFORE TAXES ON INCOME 900 1,387<br />
Taxes on income (11) 158 –557<br />
NET PROFIT FOR THE YEAR 1,058 830<br />
Net result attributable to:<br />
Shareholders of <strong>Deutsche</strong> <strong>Bahn</strong> <strong>AG</strong> 1,039 821<br />
Minority interests 19 9<br />
Earnings per share (€ per share) (12)<br />
undiluted 2.42 1.91<br />
diluted 2.42 1.91<br />
RECONCILIATION OF CONSOLIDATED COMPREHENSIVE INCOME<br />
January 1 through December 31 [ € million ] 2009<br />
Net profit for the year 1,058 830<br />
CHANGE IN ITEMS COVERED DIRECTLY IN EQUITY<br />
Changes from currency translation 104 29<br />
Shareholder of <strong>Deutsche</strong> <strong>Bahn</strong> <strong>AG</strong> 97 28<br />
Minority interests 7 1<br />
Changes resulting from market valuation of securities 10 5<br />
Changes resulting from market valuation of cash flow hedges 131 71<br />
Share of result items with no impact on the income statement from investments accounted for using the equity method 1 7<br />
BALANCE OF RESULT ITEMS COVERED DIRECTLY IN EQUITY (BEFORE TAXES) 246 112<br />
Changes in deferred taxes on result items covered directly in equity – 40 –23<br />
BALANCE OF RESULT ITEMS COVERED DIRECTLY IN EQUITY (AFTER TAXES) 206 89<br />
COMPREHENSIVE INCOME 1,264 919<br />
Comprehensive income attributable to:<br />
Shareholder of <strong>Deutsche</strong> <strong>Bahn</strong> <strong>AG</strong> 1,238 909<br />
Minority interests 26 10
144<br />
| DEUTSCHE BAHN GROUP<br />
Consolidated balance sheet<br />
ASSETS<br />
As of December 31 [ € million ] Note <strong>2010</strong> 2009<br />
NON-CURRENT ASSETS<br />
Property, plant and equipment (13) 37,873 37,439<br />
Intangible assets (14) 4,154 2,070<br />
Investments accounted for using the equity method (15) 528 369<br />
Available-for-sale financial assets (17) 63 37<br />
Receivables and other assets (19) 162 184<br />
Derivative financial instruments (21) 279 36<br />
Deferred tax assets (16) 1,471 1,173<br />
44,530 41,308<br />
CURRENT ASSETS<br />
Inventories (18) 916 814<br />
Available-for-sale financial assets (17) 1 1<br />
Trade receivables (19) 3,877 3,030<br />
Receivables and other assets (19) 840 504<br />
Current tax receivables (20) 99 150<br />
Derivative financial instruments (21) 96 26<br />
Cash and cash equivalents (22) 1,475 1,470<br />
Assets held for sale (23) 169 0<br />
7,473 5,995<br />
TOTAL ASSETS 52,003 47,303
| CONSOLIDATED FINANCIAL STATEMENTS<br />
| Balance sheet<br />
145<br />
EQUITY AND LIABILITIES<br />
As of December 31 [ € million ] Note <strong>2010</strong> 2009<br />
EQUITY<br />
Subscribed capital (24) 2,150 2,150<br />
Reserves (25) 5,374 5,174<br />
Retained earnings (26) 6,638 5,596<br />
EQUITY ATTRIBUTABLE TO SHAREHOLDERS OF DEUTSCHE BAHN <strong>AG</strong> 14,162 12,920<br />
Minority interests (27) 154 146<br />
14,316 13,066<br />
NON-CURRENT LIABILITIES<br />
Financial debt (28) 16,394 14,730<br />
Other liabilities (29) 327 451<br />
Derivative financial instruments (21) 88 180<br />
Retirement benefit obligations (32) 1,938 1,736<br />
Other provisions (33) 3,743 3,990<br />
Deferred income (34) 1,895 2,096<br />
Deferred tax liabilities (16) 377 176<br />
24,762 23,359<br />
CURRENT LIABILITIES<br />
Financial debt (28) 2,159 1,780<br />
Trade liabilities (29) 4,286 3,267<br />
Other liabilities (29) 3,109 2,732<br />
Current tax liabilities (30) 146 60<br />
Derivative financial instruments (21) 92 68<br />
Other provisions (33) 2,513 2,429<br />
Deferred income (34) 620 542<br />
12,925 10,878<br />
TOTAL EQUITY AND LIABILITIES 52,003 47,303
146<br />
| DEUTSCHE BAHN GROUP<br />
Consolidated statement of cash flows<br />
January 1 through December 31 [ € million ] Note <strong>2010</strong> 2009<br />
Profit before taxes on income 900 1,387<br />
Depreciation on property, plant and equipment and intangible assets 2,912 2,825<br />
Write-ups /write-downs on non-current financial assets 0 33<br />
Result on disposal of property, plant and equipment and intangible assets 16 –465<br />
Result on disposal of financial assets –6 0<br />
Result on sale of consolidated companies –1 0<br />
Interest and dividend income –315 –347<br />
Interest expense 1,225 1,171<br />
Foreign currency result 20 –25<br />
Result from investments accounted for using the equity method –17 –9<br />
Other non-cash expenses and income –142 –440<br />
Changes in inventories, receivables and other assets –665 602<br />
Changes in liabilities and deferred income 186 –735<br />
CASH GENERATED FROM OPERATING ACTIVITIES 4,113 3,997<br />
Interest received 62 55<br />
Dividends and capital distribution received 1 2<br />
Interest paid –780 –725<br />
Reimbursed taxes on income (previous year: taxes on income paid ) 13 –196<br />
CASH FLOW FROM OPERATING ACTIVITIES 3,409 3,133<br />
Proceeds from the disposal of property, plant and equipment and intangible assets 254 248<br />
Payments for purchases of property, plant and equipment and intangible assets – 6,864 – 6,486<br />
Proceeds from investment grants 4,819 4,649<br />
Payments for repaid investment grants –90 –137<br />
Proceeds from the sale of financial assets 24 0<br />
Payments for purchases of financial assets 0 0<br />
Proceeds from the sale of shares in consolidated companies<br />
less net cash and cash equivalents diverted 2 0<br />
Payments for acquisition of shares in consolidated companies<br />
less net cash and cash equivalents acquired – 1,622 –202<br />
Payments for additions to investments accounted for using the equity method –2 –7<br />
CASH FLOW FROM INVESTING ACTIVITIES –3,479 –1,935<br />
Distribution of profits to minority interests –14 –12<br />
Repayment of capital amounts under finance leases –212 –61<br />
Proceeds from issue of bonds 2,477 2,140<br />
Payments for redemption of bonds –1,000 –1,367<br />
Proceeds from interest-free government loans 0 10<br />
Payments for redemption of interest-free government loans –481 –438<br />
Proceeds from borrowings and commercial paper 244 5<br />
Repayment of borrowings and commercial paper –987 –892<br />
CASH FLOW FROM FINANCING ACTIVITIES 27 –615<br />
NET CHANGES IN CASH AND CASH EQUIVALENTS –43 583<br />
Cash and cash equivalents at the beginning of the period (22) 1,470 879<br />
Changes in cash and cash equivalents due to changes in the scope of consolidation 3 4<br />
Changes in funds due to changes in exchange rates 45 4<br />
CASH AND CASH EQUIVALENTS AT THE END OF THE PERIOD (22) 1,475 1,470
| CONSOLIDATED FINANCIAL STATEMENTS<br />
| Statement of cash flows<br />
| Statement of changes in equity<br />
147<br />
Consolidated statement of changes in equity<br />
Capital<br />
reserves<br />
Currency<br />
translation<br />
Fair value<br />
valuation<br />
of securities<br />
1 )<br />
Fair value<br />
valuation<br />
of cash<br />
flow<br />
hedges 1)<br />
Other<br />
movements<br />
Reserves<br />
Total<br />
reserves<br />
Retained<br />
earnings<br />
[ € million ] Subscribed<br />
capital<br />
Equity<br />
attributable<br />
to<br />
shareholder<br />
of<br />
<strong>Deutsche</strong><br />
<strong>Bahn</strong> <strong>AG</strong><br />
Minority<br />
interests<br />
As of Jan 1, <strong>2010</strong> 2,150 5,310 – 91 6 –55 4 5,174 5,596 12,920 146 13,066<br />
+ Capital introduced 0 0 0 0 0 0 0 0 0 0 0<br />
– Capital decrease 0 0 0 0 0 0 0 0 0 0 0<br />
– Reduction of capital<br />
reserves 0 0 0 0 0 0 0 0 0 0 0<br />
– Dividend payments 0 0 0 0 0 0 0 0 0 –14 – 14<br />
+/– Other changes 0 0 0 0 0 1 1 3 4 –4 0<br />
+/– Other changes 0 0 98 8 93 0 199 1,039 1,238 26 1,264<br />
AS OF DEC 31, <strong>2010</strong> 2,150 5,310 7 14 38 5 5,374 6,638 14,162 154 14,316<br />
Total<br />
equity<br />
Capital<br />
reserves<br />
Currency<br />
translation<br />
Fair value<br />
valuation<br />
of securities<br />
1)<br />
Fair value<br />
valuation<br />
of cash<br />
flow<br />
hedges 1)<br />
Other<br />
movements<br />
Reserves<br />
Total<br />
reserves<br />
Retained<br />
earnings<br />
[ € million ] Subscribed<br />
capital<br />
Equity<br />
attributable<br />
to<br />
shareholder<br />
of<br />
<strong>Deutsche</strong><br />
<strong>Bahn</strong> <strong>AG</strong><br />
Minority<br />
interests<br />
As of Jan 1, 2009 2,150 5,310 –119 – 5 –104 4 5,086 4,782 12,018 137 12,155<br />
+ Capital introduced 0 0 0 0 0 0 0 0 0 0 0<br />
– Capital decrease 0 0 0 0 0 0 0 0 0 0 0<br />
– Reduction of capital<br />
reserves 0 0 0 0 0 0 0 0 0 0 0<br />
– Dividend payments 0 0 0 0 0 0 0 0 0 –12 –12<br />
+/– Other changes 0 0 0 0 0 0 0 –7 –7 11 4<br />
+/– Other changes 0 0 28 11 49 0 88 821 909 10 919<br />
AS OF DEC 31, 2009 2,150 5,310 – 91 6 – 55 4 5,174 5,596 12,920 146 13,066<br />
1)<br />
Equity capital includes deferred taxes.<br />
Total<br />
equity
148<br />
| DEUTSCHE BAHN GROUP<br />
Notes to the consolidated financial statements<br />
Segment reporting by business segments<br />
January 1 through December 31 [ € million ]<br />
DB <strong>Bahn</strong><br />
Long-Distance<br />
DB <strong>Bahn</strong><br />
Regional 6)<br />
DB <strong>Bahn</strong><br />
Urban 6) DB Arriva DB Schenker<br />
Rail<br />
<strong>2010</strong> 2009 <strong>2010</strong> 2009 <strong>2010</strong> 2009 <strong>2010</strong> 2009 <strong>2010</strong> 2009<br />
Segment revenues<br />
External revenues 3,602 3,435 7,482 7,509 1,227 1,219 1,046 – 4,314 3,791<br />
Internal revenues 127 130 77 78 45 33 0 – 270 264<br />
TOTAL REVENUES 3,729 3,565 7,559 7,587 1,272 1,252 1,046 – 4,584 4,055<br />
Other external segment revenues 173 140 267 259 53 46 56 – 278 249<br />
Other internal segment revenues 50 51 111 106 2 6 0 – 47 37<br />
TOTAL SEGMENT REVENUES 3,952 3,756 7,937 7,952 1,327 1,304 1,102 – 4,909 4,341<br />
Segment profit /loss (EBIT) 160 80 656 678 23 71 55 – –71 –291<br />
Adjustment special items 1) –43 61 73 221 39 0 0 – 83 102<br />
Segment result (EBIT adjusted 1) ) 117 141 729 899 62 71 55 – 12 –189<br />
EBITDA 524 443 1,156 1,186 93 146 132 – 219 5<br />
EBITDA adjusted 1) 481 504 1,229 1,407 132 146 132 – 302 107<br />
Net interest income<br />
Results from investments accounted for using the equity method 0 0 0 0 0 0 3 – 7 –2<br />
Other financial result<br />
Profit before taxes on income<br />
Taxes on income<br />
NET PROFIT FOR THE YEAR<br />
Segment assets 2), 3) 2,277 2,599 5,504 5,767 454 454 4,166 – 4,519 4,481<br />
Investments accounted for using the equity method 2) 0 0 16 15 2 2 105 – 104 97<br />
TOTAL ASSETS 2) 2,277 2,599 5,520 5,782 456 456 4,271 – 4,623 4,578<br />
thereof goodwill 0 0 17 17 5 5 1,338 – 462 452<br />
Segment liabilities 2), 3) 1,029 1,026 2,569 2,322 286 261 983 – 1,531 1,528<br />
Segment capital expenditures 48 57 212 407 91 57 3,571 – 354 674<br />
Additions to assets from changes in scope of consolidation 0 10 0 0 0 0 3,400 – 4 355<br />
Additions to assets from gross capital expenditures 48 47 212 407 91 57 171 – 350 319<br />
Investment grants received 0 0 –19 –37 –17 –10 0 – –2 –7<br />
NET CAPITAL EXPENDITURES 48 47 193 370 74 47 171 – 348 312<br />
Scheduled depreciation 4) 364 363 490 492 71 75 76 – 287 276<br />
Impairment losses recognized /reversed 4) 0 0 10 16 –1 0 1 – 3 20<br />
Employees 5) 15,270 15,043 29,008 28,668 9,009 8,972 36,454 – 32,618 34,145<br />
1)<br />
Adjusted for income respectively expenses from the disposal of financial assets and special items.<br />
2)<br />
Segment assets, investments in associated companies and segment liabilities are stated as of December 31; the remaining items relate to the reporting period.<br />
3)<br />
Profit transfer agreements were not assigned to segment assets or liabilities.<br />
4)<br />
The non-cash items are included in the segment result shown.<br />
Segment reporting by regions January 1 through December 31 [ € million ]<br />
External revenues<br />
Segment assets 1)<br />
thereof non-current assets 1)<br />
1)<br />
Statement as of December 31.
| CONSOLIDATED FINANCIAL STATEMENTS<br />
| Notes<br />
149<br />
DB Schenker<br />
DB Netze<br />
DB Netze<br />
DB Services Subsidiaries /<br />
Sum of Consolidation 6)<br />
Total<br />
Logistics<br />
Track<br />
Stations<br />
Other<br />
segments<br />
<strong>2010</strong> 2009 <strong>2010</strong> 2009 <strong>2010</strong> 2009 <strong>2010</strong> 2009 <strong>2010</strong> 2009 <strong>2010</strong> 2009 <strong>2010</strong> 2009 <strong>2010</strong> 2009<br />
14,257 11,249 913 764 387 373 128 109 1,054 886 34,410 29,335 0 0 34,410 29,335<br />
53 43 3,667 3,605 657 652 1,146 1,128 2,311 2,218 8,353 8,151 – 8,353 –8,151 0 0<br />
11,292 4,580 4,369 1,044 1,025 1,274 1,237 3,365 3,104 42,763 37,486 –8,353 –8,151 34,410 29,335<br />
125 140 760 1,355 201 127 327 231 820 1,287 3,060 3,834 60 30 3,120 3,864<br />
3 2 214 210 28 25 1,561 1,396 1,673 1,667 3,689 3,500 – 3,689 –3,500 0 0<br />
14,438 11,434 5,554 5,934 1,273 1,177 3,162 2,864 5,858 6,058 49,512 44,820 – 11,982 –11,621 37,530 33,199<br />
248 108 411 1,017 221 214 177 104 – 112 275 1,768 2,256 49 –48 1,817 2,208<br />
56 91 190 –459 –4 3 –48 21 –237 –573 109 –533 – 60 10 49 –523<br />
304 199 601 558 217 217 129 125 – 349 –298 1,877 1,723 –11 –38 1,866 1,685<br />
426 280 1,457 2,039 347 339 335 276 25 398 4,714 5,112 15 –79 4,729 5,033<br />
478 371 1,524 1,472 343 342 287 297 –212 –175 4,696 4,471 – 45 –69 4,651 4,402<br />
–911 –826<br />
2 1 0 0 0 0 0 0 5 10 17 9 0 0 17 9<br />
–23 –4<br />
900 1,387<br />
158 –557<br />
1,058 830<br />
5,578 4,841 21,341 21,721 3,374 3,241 1,213 1,195 3,787 3,894 52,213 48,193 –738 –1,259 51,475 46,934<br />
10 11 1 1 0 0 0 0 290 243 528 369 0 0 528 369<br />
5,588 4,852 21,342 21,722 3,374 3,241 1,213 1,195 4,077 4,137 52,741 48,562 –738 –1,259 52,003 47,303<br />
1,076 980 0 0 0 0 0 0 13 13 2,911 1,467 0 0 2,911 1,467<br />
2,739 2,291 2,467 2,380 383 393 663 685 5,826 5,949 18,476 16,835 19,211 17,402 37,687 34,237<br />
199 208 4,986 4,624 511 488 177 138 192 256 10,341 6,909 – 35 –70 10,306 6,839<br />
10 12 0 0 0 0 0 0 1 0 3,415 377 0 0 3,415 377<br />
189 196 4,986 4,624 511 488 177 138 191 256 6,926 6,532 –35 –70 6,891 6,462<br />
0 0 –4,321 –4,109 –363 –411 0 0 – 97 –75 –4,819 –4,649 0 0 –4,819 –4,649<br />
189 196 665 515 148 77 177 138 94 181 2,107 1,883 –35 –70 2,072 1,813<br />
175 172 934 953 125 125 157 171 136 123 2,815 2,750 –34 –32 2,781 2,718<br />
3 0 112 69 1 0 1 1 1 0 131 106 0 1 131 107<br />
58,671 57,134 39,849 40,354 4,636 4,601 25,131 24,460 25,664 26,005 276,310 239,382 0 0 276,310 239,382<br />
5)<br />
The number of employees represents the number of employees as of December 31 (part-time employees converted into equivalent full-time employees).<br />
6)<br />
Previous year data adjusted: reclassification of S-<strong>Bahn</strong> Berlin GmbH und S-<strong>Bahn</strong> Hamburg GmbH from the segment DB <strong>Bahn</strong> Urban to the segment DB <strong>Bahn</strong><br />
Regional.<br />
Germany Rest of Europe North America Asia /Pacific Rest of World Reconciliation DB Group<br />
2009 <strong>2010</strong> 2009 <strong>2010</strong> 2009 <strong>2010</strong> 2009 <strong>2010</strong> 2009 <strong>2010</strong> 2009 <strong>2010</strong> 2009<br />
21,393 19,930 8,664 6,245 1,780 1,371 2,099 1,472 474 317 0 0 34,410 29,335<br />
39,429 40,402 8,908 4,410 579 465 1,466 1,181 170 143 923 333 51,475 46,934<br />
35,719 36,781 6,166 2,667 197 186 654 580 29 31 –621 –615 42,144 39,630
150<br />
| DEUTSCHE BAHN GROUP<br />
BASIC PRINCIPLES AND METHODS<br />
Fundamental information<br />
<strong>Deutsche</strong> <strong>Bahn</strong> <strong>AG</strong> (DB <strong>AG</strong>), and its subsidiaries (together “DB<br />
Group”) provide services in the fields of passenger transport,<br />
transport and logistics, and operate an extensive rail infrastructure<br />
which is also available to non-Group users on a non-discriminatory<br />
basis. Whereas passenger transport and rail infrastructure<br />
activities are conducted primarily in the company’s domestic<br />
market of Germany, transport and logistics activities are conducted<br />
on a worldwide basis.<br />
In the year under review, following approval by the cartel<br />
authorities, DB Group acquired all shares in the British transport<br />
company Arriva Plc, Sunderland/UK (referred to in the following<br />
as “Arriva”).<br />
DB <strong>AG</strong>, Potsdamer Platz 2, 10785 Berlin is an Aktiengesellschaft<br />
(joint stock corporation); its shares are held entirely by<br />
the Federal Republic of Germany (government). The company<br />
is maintained under the number HRB 50000 in the commercial<br />
register of the Amtsgericht (local court) Berlin-Charlottenburg.<br />
DB Group has issued securities in accordance with section 2 (1)<br />
clause 1 of the Securities Trading Act (Wertpapierhandelsgesetz;<br />
WpHG); these securities are traded on organized markets in<br />
accordance with section 2 (5) WpHG.<br />
These consolidated financial statements have been prepared<br />
by the Management Board, and will be handed over to the Supervisory<br />
Board for the Supervisory Board meeting on March 30, 2011.<br />
Principles of preparing financial statements<br />
The consolidated financial statements are prepared on the basis<br />
of section 315a HGB and in accordance with the International<br />
Financial <strong>Report</strong>ing Standards (IFRS) as applied in the EU and<br />
their interpretation by the International Financial <strong>Report</strong>ing<br />
Interpretations Committee (IFRIC). The accounting standards<br />
have been consistently applied throughout the entire reporting<br />
period with no changes compared with the previous year.<br />
The financial year of DB <strong>AG</strong> and its incorporated subsidiaries<br />
is the same as the calendar year. The consolidated financial<br />
statements are prepared in euros. Unless otherwise specified,<br />
all figures are stated in euro million (€ million).<br />
A) STANDARDS, REVISIONS OF STANDARDS<br />
AND INTERPRETATIONS WHICH ARE THE SUBJECT<br />
OF MANDATORY FIRST-TIME ADOPTION FOR<br />
REPORTING PERIODS AFTER JANUARY 1, <strong>2010</strong><br />
In the year under review, DB consolidated financial statements<br />
took account of all new and revised standards and interpretations<br />
which are the subject of initial binding adoption starting<br />
January 1, <strong>2010</strong>, which are also relevant for DB Group and which<br />
have not been the subject of early adoption in previous periods.<br />
The changes to the standards have been recognized in accordance<br />
with the transitional regulations. Initial adoption of these new<br />
regulations has not had any material impact on the consolidated<br />
financial statements. They are set out in the following:<br />
a IAS 27: Consolidated and Separate Financial Statements<br />
(revised January 2008; applicable for reporting periods<br />
starting July 1, 2009)<br />
IAS 27 governs the treatment of acquisitions and sales of<br />
shares after acquiring and retaining control. In future, losses<br />
which are attributable to minorities and which exceed the<br />
relevant recognized value must be shown as negative carrying<br />
amounts in consolidated equity. There will be adjustments<br />
for future transactions.<br />
a IAS 39: Changes to IAS 39 “Financial Instruments: Recognition<br />
and Measurement: Eligible Underlyings” (revised July 2008;<br />
applicable for reporting periods starting July 1, 2009)<br />
IAS 39 specifies how the principles set out in IAS 39 for<br />
presenting hedges (Hedge Accounting) are applicable for<br />
two special situations: in the case of a unilateral risk in<br />
relation to a hedged underlying and in the case of inflation<br />
in a financially hedged underlying. This does not have any<br />
material impact on DB Group.<br />
a IFRS 1: First-Time Adoption of International Financial<br />
<strong>Report</strong>ing Standards (revised November 2008; applicable<br />
for reporting periods starting July 1, 2009)<br />
IFRS 1 has been restructured as part of the revision process.<br />
No changes have been made to the contents.<br />
a IFRS 1: Changes to IFRS 1 “First-time Adoption of International<br />
Financial <strong>Report</strong>ing Standards: Additional exemptions<br />
for First-time Adopters” (revised July 2009; applicable for<br />
reporting periods starting January 1, <strong>2010</strong>)<br />
IFRS 1 specifies that companies which apply the full-cost<br />
method are exempted from the retrospective application<br />
of IFRS for oil and gas assets. In addition, under certain<br />
conditions, companies are exempted from reassessing<br />
existing agreements to determine whether they include<br />
leases. The standard is currently not relevant for DB Group.
| CONSOLIDATED FINANCIAL STATEMENTS<br />
| Notes<br />
151<br />
a IFRS 2: Change to IFRS 2 “Share-Based Payment: Share-Based<br />
Payments with Cash Settlement by a Company in the Group”<br />
(revised June 2009; applicable for reporting periods starting<br />
January 1, <strong>2010</strong>)<br />
IFRS 2 contains clarifications regarding the accounting<br />
treatment of cash-settled share-based payment involving<br />
several group companies. The standard is currently not<br />
relevant for DB Group.<br />
a IFRS 3: Business Combinations (revised January 2008; appli-<br />
cable for business combinations for which the time of acquisition<br />
is after July 1, 2009)<br />
IFRS 3 contains regulations particularly with regard to purchase<br />
price components, with regard to the treatment of<br />
minority interests and goodwill and also with regard to the<br />
extent of assets, liabilities and contingent liabilities to be<br />
recognized. Adjustments have resulted.<br />
a Improvements to IFRS 2009: “Improvements to IFRS” (published<br />
April 2009; applicable for reporting periods starting<br />
January 1, <strong>2010</strong>)<br />
“Improvements to IFRS 2009” is a second collective standard<br />
for amending various IFRS. This contains 15 different<br />
changes to 12 existing IFRS. These mainly comprise amendments<br />
which are considered to be insignificant, such as the<br />
removal of inconsistencies within the standards and the<br />
clarification of misleading formulations. A change in relation<br />
to the classification of lease arrangements for land has<br />
had an impact on DB Group. All other changes have not had<br />
any major impact.<br />
a IFRIC 12: Service Concession Arrangements (published<br />
November 2006; applicable for reporting periods starting<br />
March 29, 2009 [1])<br />
IFRIC 12 deals with the accounting treatment of service<br />
concession arrangements between the public sector (the<br />
licensor) and a private company (the operator). We are not<br />
assuming any impact for DB Group.<br />
a IFRIC 15: Agreements for the Construction of Real Estate (published<br />
July 2008; applicable for reporting periods starting<br />
January 1, <strong>2010</strong> [2])<br />
IFRIC 15 regulates the recognition of real estate sales in<br />
which the contract is signed before the completion of the<br />
building work. The interpretation is currently not relevant<br />
for DB Group.<br />
a IFRIC 16: Hedges of a Net Investment in a Foreign Operation<br />
(published July 2008; applicable for reporting periods starting<br />
June 30, 2009 [3])<br />
IFRIC 16 governs issues in connection with the recognition<br />
of hedges of exchange rate risks within a company and its<br />
international operations. The interpretation is currently not<br />
relevant for DB Group.<br />
a IFRIC 17<br />
: Distributions of Non-Cash Assets to Owners (pub-<br />
lished November 2008; applicable for reporting periods<br />
starting November 1, 2009 [4])<br />
IFRIC 17 contains regulations regarding the accounting and<br />
valuation of distributions of non-cash assets. The interpretation<br />
is currently not relevant for DB Group.<br />
a IFRIC 18: Transfer of Assets from Customers (published January<br />
2009; applicable for reporting periods starting November 1,<br />
2009 [4])<br />
IFRIC 18 governs the accounting treatment in those cases<br />
in which a company receives assets from its customers in<br />
order to provide the customer with access to a network or<br />
permanent access to services or the delivery of goods. There<br />
has been an impact for DB Group.<br />
| [1] A The time of application for the interpretation envisaged<br />
by the IASB has been postponed by the EU from January 1, 2008<br />
to March 29, 2009.<br />
| [2] A The time of application for the interpretation envisaged<br />
by the IASB has been postponed by the EU from January 1, 2009<br />
to January 1, <strong>2010</strong>.<br />
| [3] A The time of application for the interpretation envisaged<br />
by the IASB has been postponed by the EU from October 1, 2008<br />
to June 30, 2009.<br />
| [4] A The time of application for the interpretation envisaged<br />
by the IASB has been postponed by the EU from July 1, 2009 to<br />
November 1, 2009.
152<br />
| DEUTSCHE BAHN GROUP<br />
B) STANDARDS, REVISIONS OF STANDARDS AND INTER-<br />
PRETATIONS WHICH HAD BEEN ADOPTED AS OF THE<br />
REPORTING DATE BUT WHICH ARE NOT YET THE SUBJECT<br />
OF MANDATORY ADOPTION AND EARLY ADOPTION<br />
a IAS 12: Change to IAS 12 “Income Taxes: Deferred Tax: Recovery<br />
of Underlying Assets” (published December <strong>2010</strong>; applicable<br />
for reporting periods starting January 1, 2012)<br />
According to IAS 12, the measurement of deferred taxes<br />
depends on whether the existing differences are realized<br />
as part of continuing use or as a result of a sale. In the case<br />
of investment properties in accordance with IAS 40 which<br />
are measured at fair value, this change introduces the refutable<br />
assumption that such differences are realized by way<br />
of a sale. The change currently is not relevant for DB Group.<br />
a IAS 24: Related Party Disclosures (revised November 2009;<br />
applicable for reporting periods starting January 1, 2011)<br />
IAS 24 has been changed in such a way that public sector<br />
enterprises have been partially exempted from certain<br />
disclosure obligations. The definition of a related party has<br />
also been specified in greater detail. The standard will have<br />
an impact on related party disclosures in the financial<br />
statements of DB Group.<br />
a IAS 32: Change to IAS 32 Financial Instruments: Presentation:<br />
Classification of Subscription Rights (revised October 2009;<br />
applicable for reporting periods starting February 1, <strong>2010</strong>)<br />
IAS 32 governs the accounting treatment for subscription<br />
rights which are denominated in a currency other than the<br />
functional currency. In the past, such subscription rights<br />
have been recognized as derivative liabilities. In future,<br />
such rights have to be classified as shareholders’ equity<br />
under certain conditions. We are assuming that there will<br />
be no impact for DB Group.<br />
a IFRS 1: Change to IFRS 1 “First-Time Adoption of International<br />
Financial <strong>Report</strong>ing Standards: Limited Exemption for First-<br />
Time Adopters of Comparison Figures in Accordance with<br />
IFRS 7” (revised January <strong>2010</strong>; applicable for reporting periods<br />
starting July 1, <strong>2010</strong>)<br />
IFRS 1 has been modified in such a way that IFRS first-time<br />
adopters are exempt from the disclosure requirements<br />
which were introduced in March 2009 as a result of the<br />
change to IFRS 7. This ensures that the transitional regulations<br />
regarding the application of the changed IFRS 7 are<br />
also applicable for IFRS first-time adopters.<br />
a IFRS 1: Change to IFRS 1 “First-Time Adoption of International<br />
Financial <strong>Report</strong>ing Standards: Severe Hyperinflation and<br />
Removal of Fixed Dates for First-time Adopters” (published<br />
December <strong>2010</strong>; applicable for reporting periods starting<br />
July 1, 2011)<br />
As a result of this change, the references to the fixed date<br />
January 1, 2004 which had previously been included in<br />
IFRS 1 was replaced by a reference to the time of the changeover<br />
to IFRS 1. Additional application guidelines have been<br />
included, specifying the procedure for presenting financial<br />
statements which comply with IFRS for situations in which<br />
a company was not able to comply with the IFRS regulations<br />
for a certain period because its functional currency was<br />
exposed to severe hyperinflation. The change does not<br />
have any impact on the financial statements of DB Group.<br />
a IFRS 7: Change to IFRS 7 “Financial Instruments: Disclosures:<br />
Transfers of Financial Assets” (published October <strong>2010</strong>;<br />
applicable for reporting periods starting July 1, 2011)<br />
The changes relate to extended disclosure obligations for<br />
transfers of financial assets. They are intended to provide<br />
a better understanding of the effects of the risks retained<br />
by the company as well as the retained or transferred rights<br />
and obligations. The change will have an impact on the<br />
financial statements of DB Group.<br />
a IFRS 9: Financial Instruments (published November 2009/<br />
extended October <strong>2010</strong>; applicable for reporting periods<br />
starting January 1, 2013)<br />
The part of IFRS 9 published in November 2009 restates the<br />
classification and measurement of financial assets. There<br />
will be only two measurement categories (amortized cost<br />
and fair value). In future, the classification of financial assets<br />
will be based on the business model of the company and<br />
also the characteristic properties of the contractual cash<br />
flows of the respective financial assets.<br />
That part which was extended in October <strong>2010</strong> governs<br />
the classification and measurement of financial liabilities.<br />
The existing rules of IAS 39 have been taken over in this<br />
respect. A change has resulted for financial liabilities<br />
which are measured at fair value. In the case of such liabilities,<br />
that part of the change in fair value which results<br />
from a change in the company’s own credit risk has to be<br />
shown in other result and not as profit or loss.
| CONSOLIDATED FINANCIAL STATEMENTS<br />
| Notes<br />
153<br />
The rules regarding the derecognition of financial instruments<br />
in IAS 39 have also been transferred unchanged to<br />
IFRS 9.<br />
The change to IFRS 9 will have an impact on the recognition<br />
of financial instruments in DB Group. In 2011,<br />
IFRS 9 is to be extended to include regulations concerning<br />
additional issues.<br />
a Improvements to IFRS <strong>2010</strong>: “Improvements to IFRS” (published<br />
May <strong>2010</strong>; applicable for reporting periods starting<br />
January 1, 2011)<br />
“Improvements to IFRS <strong>2010</strong>” is a third collective standard<br />
for changing various IFRS. It contains changes to nine existing<br />
IFRS. These are essentially changes which are considered<br />
to be of a minor nature, such as the removal of inconsistencies<br />
within the standards and clarification of formulations<br />
which might lead to misunderstanding. DB Group is currently<br />
assessing the effects resulting from future application for<br />
the consolidated financial statements.<br />
a IFRIC 14: Change to IFRIC 14 “The Limit on a Defined Benefit<br />
Asset, Minimum Funding Requirements and Their Interaction:<br />
Advance Payments under Minimum Funding Requirements”<br />
(published November 2009; applicable for reporting periods<br />
starting January 1, 2011)<br />
IFRIC 14 has been changed in such a way that companies<br />
which are subject to minimum funding requirements and<br />
which make advance contribution payments in order to<br />
fulfill these minimum funding requirements are permitted<br />
to recognize the benefit arising from such an advance payment<br />
as an asset. We are assuming that there will not be a<br />
major impact for DB Group.<br />
a IFRIC 19: Extinguishing Financial Liabilities with Equity Instruments<br />
(published November 2009; applicable for reporting<br />
periods starting July 1, <strong>2010</strong>)<br />
IFRIC 19 governs the accounting treatment of so-called<br />
debt-for-equity swaps. Under such arrangements, a company<br />
partially or completely repays a financial liability by way of<br />
issuing shares or other instruments of shareholders’ equity.<br />
This interpretation is currently not relevant for DB Group.<br />
Structure of the balance sheet and<br />
the income statement<br />
Assets and liabilities are stated in the balance sheet either as<br />
current or non-current items. Assets and liabilities are classified<br />
as current if they are realized or due within 12 months after<br />
the end of the reporting period. The structure of the balance<br />
sheet takes account of the requirements of the ordinance<br />
relating to the structure of the financial statements of transport<br />
companies. The income statement uses the structure of the<br />
cost summary method.<br />
Principles underlying the consolidated<br />
financial statements<br />
COMPARABILITY WITH THE PREVIOUS YEAR<br />
After due consideration is given to the following issues, the<br />
financial information presented for the year under review is<br />
comparable with the financial information for the previous year:<br />
CHANGES IN THE SCOPE OF CONSOLIDATION<br />
For the year under review, changes in the scope of consolidation,<br />
and in particular the acquisition of Arriva, have resulted in<br />
financial information in the balance sheet, the income statement,<br />
the cash flow statement as well as segment reporting which is<br />
not directly comparable with that of the previous period. Detailed<br />
information relating to these acquisitions as well as explanations<br />
concerning the other transactions are set out in the section<br />
“Changes in the Group.”<br />
CHANGES IN SEGMENT ALLOCATION<br />
With effect from January 1, <strong>2010</strong>, S-<strong>Bahn</strong> Berlin GmbH and S-<strong>Bahn</strong><br />
Hamburg GmbH, which previously had been allocated to the<br />
DB <strong>Bahn</strong> Urban segment, were allocated to the DB <strong>Bahn</strong> Regional<br />
segment. The previous year figures have been adjusted accordingly.<br />
Other changes which were made in segment allocation<br />
were insignificant.<br />
CONSOLIDATION METHODS<br />
A) CONSOLIDATION PRINCIPLES<br />
DB <strong>AG</strong> and all companies (subsidiaries) whose financial and<br />
business policy can be determined by DB <strong>AG</strong> are fully consolidated<br />
in the consolidated financial statements of DB <strong>AG</strong>. They<br />
are incorporated in the consolidated financial statements at<br />
the point at which DB <strong>AG</strong> acquires the possibility of control. At<br />
the subsidiaries, “control” is defined as a situation in which<br />
DB <strong>AG</strong> directly or indirectly holds a majority of voting rights.<br />
The reference date for determining the point at which a company
154<br />
| DEUTSCHE BAHN GROUP<br />
is taken out of the group of fully consolidated companies is<br />
established on the basis of the time at which the possibility of<br />
control terminates.<br />
For the purpose of uniform accounting, the affiliated companies<br />
have applied the accounting guidelines of the parent<br />
company.<br />
Minority interests in the shareholders’ equity of subsidiaries<br />
are shown separately from the shareholders’ equity of Group<br />
shareholders. The extent of the minority interests is calculated<br />
as the minority interests applicable at the point at which the<br />
subsidiary was acquired and also that proportion of the change<br />
in the shareholders’ equity of the subsidiary since the acquisition<br />
attributable to the third party. Pro rata losses attributable to<br />
the minority interests which exceed the minority interests in<br />
the shareholders’ equity are ascribed to the shareholders’ equity<br />
of the Group shareholders, unless the external shareholders<br />
have a binding obligation to absorb such losses and are economically<br />
and financially in a position to do so.<br />
Internal liabilities within the Group as well as expenses and<br />
income and intercompany results between fully consolidated<br />
companies are completely eliminated.<br />
B) BUSINESS COMBINATIONS<br />
All subsidiaries acquired after December 31, 2002 have been<br />
consolidated using the acquisition method under IFRS 3. Accordingly,<br />
the acquirer shall measure the cost of a business combination<br />
as the aggregate of the fair values, at the date of exchange,<br />
of assets given and liabilities incurred or assumed. The acquired<br />
identifiable assets, liabilities and contingent liabilities are valued<br />
under IFRS 3 with their fair value at the date of acquisition,<br />
irrespective of any minority interests. Alternatively, acquired<br />
long-term assets or groups of assets which are classified as<br />
available-for-sale in accordance with IFRS 5 are shown with their<br />
fair value less costs to sell.<br />
Any difference between the purchase costs of the business<br />
combination and the acquired assets valued at fair value is shown<br />
as goodwill. If the purchase price is lower than the fair value of<br />
the acquired assets, the difference is shown immediately in the<br />
income statement.<br />
Minority interests are calculated on a pro rata basis from<br />
the assets, liabilities and contingent liabilities valued with their<br />
fair value.<br />
The acquisition and sale of shares in an already fully consolidated<br />
company which does not result in a change of control is shown<br />
directly in equity. There have accordingly been no changes to<br />
the carrying amounts of the assets and liabilities recognized<br />
from such transactions.<br />
C) JOINT VENTURES AND ASSOCIATED COMPANIES<br />
Joint ventures are defined as companies which are managed by<br />
DB <strong>AG</strong> jointly with another party either directly or indirectly.<br />
Associated companies are defined as equity participations<br />
for which DB Group is able to exercise a major influence on the<br />
financial and business policy. Major influence is normally defined<br />
as a situation in which DB <strong>AG</strong> directly or indirectly holds 20 to<br />
50 % of the voting rights in these companies and the related<br />
assumption of association is not refuted.<br />
Joint ventures and associated companies are accounted for<br />
using the equity method. Alternatively, they are valued in accordance<br />
with IFRS 5 if the shares are classified as available-for-sale.<br />
As part of the process of accounting for participations using<br />
the equity method, shares in associated companies and joint<br />
ventures are shown at cost in the consolidated financial statements,<br />
adjusted for the related changes in the net assets of the<br />
associated company and joint venture and any impairments<br />
resulting from the impairment test. Any pro rata losses attributable<br />
to DB Group which exceed the total investment in the<br />
associated company or joint venture, consisting of the amortized<br />
equity figure as well as other long-term receivables, are not<br />
recognized, unless DB Group has taken on corresponding obligations<br />
or made payments.<br />
Any positive difference between the cost of the purchased<br />
shares and the pro rata assets acquired at the point of purchase<br />
and valued at fair value constitutes goodwill, which is contained<br />
in the amortized equity figure and is thus also subject to the<br />
impairment test. If the purchase price is lower than the fair value<br />
following the pro rata assets which have been acquired, the<br />
difference is taken immediately to the income statement.<br />
Intercompany results attributable to transactions with<br />
associated companies or joint ventures are eliminated on a pro<br />
rata basis.
| CONSOLIDATED FINANCIAL STATEMENTS<br />
| Notes<br />
155<br />
CHANGES IN THE GROUP<br />
A) SUBSIDIARIES<br />
Movements in the group of fully consolidated companies of<br />
DB Group are detailed in the following:<br />
[Number] German <strong>2010</strong> Foreign <strong>2010</strong> Total <strong>2010</strong> Total 2009<br />
FULLY CONSOLIDATED SUBSIDIARIES<br />
As of Jan 1 184 395 579 530<br />
Additions 1 334 335 38<br />
Addition due to changes in type of inclusion 0 5 5 24<br />
Disposals 15 43 58 13<br />
Disposal due to changes in type of inclusion 1 0 1 0<br />
AS OF DEC 31 169 691 860 579<br />
Activities in connection with the production of installations from<br />
track infrastructure are to some extent carried out in the form<br />
of Gesellschaften bürgerlichen Rechts (company constituted<br />
under civil law) (common project units). These common project<br />
units are terminated when the particular project is completed.<br />
They carry out their business activities mainly over a period of<br />
between one and five years. Because these common project<br />
units are assessed mainly as jointly conducted activities, they<br />
are not fully consolidated.<br />
No subsidiary (previous year: one) has not been consolidated,<br />
that is of minor significance for the presentation of the net assets,<br />
financial position and results of operations of DB Group.<br />
Additions of companies and parts of companies<br />
Overall, expenses of € 1,929 million were incurred for purchasing<br />
companies in the year under review (previous year: € 212 million).<br />
The additions to the scope of consolidation comprise of<br />
ten new companies which were established in the year under<br />
review as well as the acquisition of all shares in the British<br />
transport company Arriva (322 companies) as well as three<br />
further acquisitions.<br />
The additions resulting from the change in type of recognition<br />
comprise the acquisition of further shares in NordCargo<br />
S.r.l, Milan/Italy, Masped-Schenker Légi és Tengeri Szállitmányozási<br />
Kft., Budapest /Hungary, MASPED-RAILOG Vasúti Szállitmányozási<br />
Kft., Budapest /Hungary and Transorient SA,<br />
Bucharest /Romania, which had previously been accounted for<br />
using the equity method, as well as one company which previously<br />
had been recognized at amortized cost.<br />
The main transactions are detailed in the following:<br />
a On August 27, <strong>2010</strong> (closing), following the approval of the<br />
cartel authorities, DB Holding UK Limited, London/Great<br />
Britain, acquired all shares in the British transport company<br />
Arriva for a purchase price of € 1,916 million. In the future,<br />
DB Group will bundle all local transport activities outside<br />
Germany under the umbrella of DB Arriva. In accordance<br />
with the requirements of the EU Commission, the German<br />
subsidiaries of Arriva were sold in a package in December<br />
<strong>2010</strong> to the Italian railway Ferrovie dello Stato. Arriva operates<br />
train and bus services in eleven other European countries<br />
apart from Germany. In 2009, the company generated<br />
revenues of around GBP 3.15 billion, and employed approximately<br />
37,000 persons outside Germany. After September<br />
<strong>2010</strong>, the company has been included in segment reporting<br />
in the DB Arriva segment.<br />
a With the agreement of June 2, <strong>2010</strong> (legally effective on<br />
September 7, <strong>2010</strong>), DB Hungaria Holding Kft., Budapest /<br />
Hungary acquired the remaining shares in the joint ventures<br />
MASPED-RAILOG Vasúti Szállitmányozási Kft. and Masped-<br />
Schenker Legi es Tengeri Szállitmányozási Kft. retrospectively<br />
as of January 1, <strong>2010</strong> for a purchase price totaling<br />
€ 9 million. In segment reporting, the company has been<br />
shown in DB Schenker Logistics segment since September<br />
<strong>2010</strong>. As of December 31, <strong>2010</strong>, these companies as well<br />
as Hungarocargo Kft., Budapest /Hungary and Romtrans<br />
Hungaria Szállitmányozási KFT., Budapest /Hungary were<br />
merged with Schenker Nemzetközi Szállitmányozási és<br />
Logisztikai Kft., Budapest /Hungary.
156<br />
| DEUTSCHE BAHN GROUP<br />
a On January 11, <strong>2010</strong>, DB Schenker Rail increased its holding<br />
in the Italian freight rail company NordCargo S.r.l (Nord-<br />
Cargo), Milan/Italy by a further 11 %, and now holds 60 %<br />
of the shares in the company. NordCargo operates around<br />
7,000 trains annually, and covers approximately 1.4 million<br />
train kilometers. The company is responsible for traction<br />
in international routes along the Adriatic and Tyrrhenian<br />
coasts between Milan and Naples. In segment reporting,<br />
these operations have been shown in the DB Schenker Rail<br />
segment since January <strong>2010</strong>.<br />
a With the agreement of June 30, <strong>2010</strong> (legally effective on<br />
September 6, <strong>2010</strong>), <strong>Deutsche</strong> <strong>Bahn</strong> Iberica Holding, S.L.,<br />
Barcelona /Spain acquired a further 20.2 % of shares in<br />
Transportes Ferroviarios Especiales S.A., Madrid/Spain, for<br />
a purchase price of € 24 million. The transaction resulted in<br />
a difference of € 11 million. Previously, <strong>Deutsche</strong> <strong>Bahn</strong> Iberica<br />
Holding, S.L., Barcelona /Spain, sold its 10 % stake in Societé<br />
de Transports de Véhicules Automóbiles (STVA), S.A., Paris/<br />
France, to a third party also for a purchase price of € 24 million.<br />
This transaction resulted in a book profit of € 13 million.<br />
The costs of purchase and the fair value of the acquired net<br />
assets are shown in the following (cumulatively) for all changes<br />
in the scope of consolidation. All purchase price allocations for<br />
acquisitions in the period under review are consistent with IFRS 3.<br />
The goodwill is calculated as follows:<br />
[ € million ] <strong>2010</strong> Thereof<br />
Arriva<br />
PURCHASE PRICE<br />
Thereof<br />
Masped<br />
Thereof<br />
NordCargo<br />
Payments 1,929 1,916 8 5<br />
+ Outstanding payments 1 0 1 0<br />
TOTAL PURCHASE PRICE 1,930 1,916 9 5<br />
– Fair value of net assets acquired 543 541 1 1<br />
GOODWILL 1,387 1,375 8 4<br />
Of the overall purchase price for NordCargo, € 1.6 million is<br />
attributable to the year under review.<br />
Goodwill is to a large extent substantiated by the synergy<br />
effects expected for the period after the acquisition. In addition,<br />
a considerable proportion of goodwill is attributable to assets<br />
which are not eligible for recognition under IFRS 3, and in particular<br />
the employee base and the future revenue potential.
| CONSOLIDATED FINANCIAL STATEMENTS<br />
| Notes<br />
157<br />
Purchase price allocation Arriva<br />
The acquired net assets are broken down as follows:<br />
[ € million ] Fair value<br />
Property, plant and equipment 1,326<br />
Intangible assets 700<br />
Investments accounted for using the equity method 100<br />
Available-for-sale financial assets 169<br />
Inventories 40<br />
Receivables from financing 66<br />
Trade receivables 250<br />
Other receivables and assets 237<br />
Derivative financial instruments 94<br />
Cash and cash equivalents 327<br />
Deferred tax assets 54<br />
ASSETS 3,363<br />
Financial debt 1,510<br />
Other liabilities 638<br />
Derivative financial instruments 37<br />
Retirement benefit obligations 174<br />
Other provisions 155<br />
Deferred income 74<br />
Deferred tax liabilities 204<br />
LIABILITIES 2,792<br />
thereof recognized contingent liabilities in accordance with IFRS 3 5<br />
Share of third parties 30<br />
NET ASSETS 541<br />
Share of DB Group in net assets before acquisition 0<br />
NET ASSETS ACQUIRED 541<br />
Purchase price paid in cash and cash equivalents 1,916<br />
Cash and cash equivalents acquired with acquisition 327<br />
OUTFLOW OF CASH AND CASH EQUIVALENTS THROUGH TRANSACTION<br />
The fair value of the intangible assets essentially relates to<br />
acquired customer and franchise agreements (depreciated over<br />
the residual useful life of between one and 15 years) and the<br />
acquired Arriva brand (unlimited useful life).<br />
We do not expect that some of the goodwill will be allowable<br />
for income tax purposes.<br />
The fair value of the trade accounts receivable is € 250 million,<br />
including impairments of € 7 million.<br />
If Arriva had been included in the DB consolidated financial<br />
statements as of January 1, <strong>2010</strong>, DB Group would have reported<br />
additional revenues of € 2.0 billion and an additional net profit<br />
of € 23 million.
158<br />
| DEUTSCHE BAHN GROUP<br />
Purchase price allocation Masped Group<br />
[ € million ] Fair value<br />
Property, plant and equipment 0<br />
Intangible assets 2<br />
Trade receivables 11<br />
Other receivables and assets 1<br />
Cash and cash equivalents 1<br />
ASSETS 15<br />
Financial debt 6<br />
Other liabilities 8<br />
Other provisions 0<br />
LIABILITIES 14<br />
thereof recognized contingent liabilities in accordance with IFRS 3 0<br />
Share of third parties 0<br />
NET ASSETS 1<br />
Share of DB Group in net assets before acquisition 0<br />
NET ASSETS ACQUIRED 1<br />
Purchase price paid in cash and cash equivalents 9<br />
Cash and cash equivalents acquired with acquisition 1<br />
OUTFLOW OF CASH AND CASH EQUIVALENTS THROUGH TRANSACTION 8<br />
There have been no major adjustments to the assets and liabilities.<br />
The fair value of the trade receivable is € 11 million, including<br />
impairments of € 0.6 million.<br />
We do not expect that some of the goodwill will be allowable for<br />
income tax purposes.
| CONSOLIDATED FINANCIAL STATEMENTS<br />
| Notes<br />
159<br />
Purchase price allocation NordCargo<br />
The acquired net assets are broken down as follows:<br />
[ € million ] Fair value<br />
Property, plant and equipment 0<br />
Intangible assets 0<br />
Trade receivables 8<br />
Other receivables and assets 5<br />
Cash and cash equivalents 0<br />
Deferred tax assets 1<br />
ASSETS 14<br />
Financial debt 0<br />
Other liabilities 11<br />
Retirement benefit obligations 1<br />
Other provisions 0<br />
Deferred income 0<br />
Deferred tax liabilities 0<br />
LIABILITIES 12<br />
thereof recognized contingent liabilities in accordance with IFRS 3 0<br />
Share of third parties 1<br />
NET ASSETS 1<br />
Share of DB Group in net assets before acquisition 0<br />
NET ASSETS ACQUIRED 1<br />
Purchase price paid in cash and cash equivalents 5<br />
Cash and cash equivalents acquired with acquisition 0<br />
OUTFLOW OF CASH AND CASH EQUIVALENTS THROUGH TRANSACTION<br />
There have been no major adjustments to the assets and liabilities.<br />
The fair value of the trade receivables is € 8 million; this figure<br />
does not include any impairments.<br />
We do not expect that some of the goodwill will be allowable for<br />
income tax purposes.
160<br />
| DEUTSCHE BAHN GROUP<br />
The disposals from the scope of consolidation relate to 40 mergers<br />
as well as 15 liquidations and three sales.<br />
The liquidations and sales have had the following cumulative<br />
impact on the net assets, financial position and results of operations<br />
of DB Group:<br />
[ € million ] Dec 31, <strong>2010</strong> Thereof<br />
Schenker Libya<br />
Sale price<br />
– Received payments 2 2<br />
– Directly attributable costs 0 0<br />
TOTAL SALE PRICE 2 2<br />
Cash and cash equivalents sold with companies 0 0<br />
INFLOW OF CASH AND CASH EQUIVALENTS THROUGH DIVESTITURES 2 2<br />
The revenues and profits included up to the point of deconsolidation<br />
are as follows:<br />
[ € million ] <strong>2010</strong> 2009 Thereof<br />
Schenker Libya<br />
Revenues 1 13 11<br />
Net profit for the year –1 –7 0<br />
The disposal resulting from the change in the type of incorporation<br />
relates to one company which has been recognized as a<br />
joint venture since January 1, <strong>2010</strong>.<br />
The following table shows a summary of the effects on the<br />
consolidated income statement resulting from the changes in<br />
the scope of consolidation which have taken place compared<br />
with the previous year period:<br />
[ € million ] DB Group<br />
Jan 1 through<br />
Dec 31, <strong>2010</strong><br />
Thereof due<br />
to changes in<br />
the scope of<br />
consolidation<br />
Thereof<br />
Arriva<br />
Amounts due<br />
to disposals<br />
from the scope of<br />
consolidation<br />
Revenues 34,410 1,290 1,046 – 4<br />
Inventory changes and internally produced and capitalized assets 2,207 6 3 0<br />
Overall performance 36,617 1,296 1,049 – 4<br />
Other operating income 3,120 67 56 – 1<br />
Cost of materials –19,314 –511 –343 2<br />
Personnel expenses –11,602 – 509 – 439 0<br />
Depreciation –2,912 –95 –77 0<br />
Other operating expenses –4,092 –210 –191 9<br />
OPERATING PROFIT (EBIT) 1,817 38 55 6<br />
Result from investments accounted for using the equity method 17 3 3 0<br />
Net interest income –911 –23 –17 0<br />
Other financial result –23 –12 –11 0<br />
FINANCIAL RESULT –917 –32 –25 0<br />
PROFIT BEFORE TAXES ON INCOME 900 6 30 6<br />
Taxes on income 158 –8 –12 0<br />
NET PROFIT FOR THE YEAR 1,058 –2 18 6
| CONSOLIDATED FINANCIAL STATEMENTS<br />
| Notes<br />
161<br />
The revenues of € 1,290 million resulting from additions to the<br />
scope of consolidation mainly relate to Arriva (€ 1,046 million),<br />
DB Schenker Rail Polska, which was acquired in the previous<br />
year (€ 129 million), MASPED-RAILOG Vasúti Szállitmányozási<br />
Kft. (€ 29 million) and Masped-Schenker Légi és Tengeri Szállitmányozási<br />
Kft. (€ 28 million).<br />
The figures shown for disposals from the scope of consolidation<br />
relate mainly to Transcanal SA, Constanţa /Romania, which was<br />
sold in the previous year and UVW Unternehmensverbund Westpfalz<br />
GmbH.<br />
B) JOINT VENTURES AND ASSOCIATED COMPANIES<br />
[Number] German <strong>2010</strong> Foreign <strong>2010</strong> Total <strong>2010</strong> Total 2009<br />
JOINT VENTURES ACCOUNTED FOR USING THE EQUITY METHOD<br />
As of Jan 1 11 8 19 18<br />
Additions 0 7 7 1<br />
Additions due to changes in type of inclusion 1 0 1 0<br />
Disposals 0 0 0 0<br />
Disposal due to change in type of inclusion 0 1 1 0<br />
AS OF DEC 31 12 14 26 19<br />
ASSOCIATED COMPANIES ACCOUNTED FOR USING THE EQUITY METHOD<br />
As of Jan 1 65 38 103 107<br />
Additions 1 23 24 6<br />
Addition due to changes in type of inclusion 1 3 4 0<br />
Disposals 4 1 5 4<br />
Disposal due to change in type of inclusion 0 4 4 6<br />
AS OF DEC 31 63 59 122 103<br />
Of the 31 additions comprising joint ventures and associates,<br />
23 are companies which were included in connection with the<br />
acquisition of Arriva. The other additions are eight (previous year:<br />
seven) companies with costs of purchase totaling € 3 million.<br />
The following selected financial data are provided for the major<br />
associates and joint ventures; this information has been taken<br />
from the consolidated financial statements or the annual financial<br />
statements of the relevant companies for the period ended<br />
December 31, <strong>2010</strong>:
162<br />
| DEUTSCHE BAHN GROUP<br />
Aggregated financial data<br />
As of December 31 [ € million ]<br />
JOINT VENTURES<br />
Equity<br />
holding<br />
Assets Equity Liabilities Revenues Net profit<br />
<strong>2010</strong> 2009 <strong>2010</strong> 2009 <strong>2010</strong> 2009 <strong>2010</strong> 2009 <strong>2010</strong> 2009<br />
Aquabus BV, Heerenveen /<br />
The Netherlands 1), 2), 5 ), 6 ) 50.00 % 11 4 7 7 0<br />
ATN Auto Terminal Neuss<br />
GmbH & Co. KG, Neuss 4), 6) 50.00 % 8 10 4 5 4 5 11 13 –1 0<br />
London Overground Rail Operations<br />
Limited, London /Great Britain 4), 6) 50.00 % 41 28 4 0 37 28 0 0 4 4<br />
PKV Planungsgesellschaft kombinierter<br />
Verkehr Duisburg mbH, Duisburg 4), 6) 50.00 % 13 11 1 1 12 10 1 1 0 0<br />
ASSOCIATED COMPANIES<br />
ALSTOM Lokomotiven Service GmbH,<br />
Stendal 3), 6) 49.00 % 32 36 19 20 13 16 38 52 2 –2<br />
Autoport Emden GmbH, Emden 33.30 % 3 3 0 0 3 3 18 13 0 0<br />
Barraqueiro SGPS SA,<br />
Lisbon /Portugal 1), 2) 21.50 % 529 215 314 288 12<br />
BLS Cargo <strong>AG</strong>, Bern /Switzerland 4), 6) 44.10 % 147 156 63 66 84 90 107 127 –2 1<br />
BwFuhrparkService GmbH, Troisdorf 4), 6) 24.90 % 226 199 98 97 128 102 285 260 1 1<br />
Container Terminal Dortmund GmbH,<br />
Dortmund 4), 6) 30.00 % 5 4 2 2 3 2 14 14 1 34<br />
CTS Container-Terminal GmbH<br />
Rhein-See-Land-Service, Cologne 4), 6) 22.50 % 8 8 3 3 5 5 3 3 1 0<br />
DAP Barging B.V., Rotterdam /<br />
The Netherlands 4), 6) 53.90 % 4 7 2 3 2 4 19 38 1 0<br />
DCH Düsseldorfer Container-Hafen GmbH,<br />
Düsseldorf 3), 4), 6 ) 51.00 % 3 4 1 1 2 3 13 17 0 1<br />
EUROFIMA Europäische Gesellschaft<br />
für die Finanzierung von Eisen bahnmaterial,<br />
Basel /Switzerland 5 ), 6 ), 7 ) 22.60 % 27,416 25,200 1,152 938 26,264 24,262 0 0 34 14<br />
Express Air Systems GmbH (EASY),<br />
Kriftel 5) 50.00 % 7 5 3 2 4 3 14 27 1 1<br />
Güterverkehrszentrum Entwicklungs -<br />
gesellschaft Dresden mbH, Dresden 4), 6) 24.53 % 19 19 2 1 17 18 1 1 0 0<br />
Hispanauto – Empresas Agrupadas<br />
A.E.I.E. © , Madrid /Spain 58.04 % 6 7 0 0 6 7 23 28 0 2<br />
Intercambiador de Transportes<br />
Principe PIO S.A., Madrid /Spain 1), 2) 30.00 % 67 9 58 7 –1<br />
INTERCONTAINER — INTERFRIGO SA,<br />
Brussels /Belgium 4), 6 ), 9) 35.66 % 45 64 5 17 40 47 144 –14 3<br />
Kahlgrund-Verkehrs-Gesellschaft mit<br />
beschränkter Haftung, Schöllkrippen 4), 6) 28.00 % 13 11 10 9 3 2 9 8 1 0<br />
KM S.P.A., Cremona /Italy 1), 2), 8) 49.00 % 11 4 7 0 0<br />
Kombiverkehr <strong>Deutsche</strong> Gesellschaft<br />
für kombinierten Güterverkehr<br />
mbH & Co. Kommanditgesellschaft,<br />
Frankfurt am Main 4), 6) 50.00 % 45 45 15 15 30 30 347 432 0 0
| CONSOLIDATED FINANCIAL STATEMENTS<br />
| Notes<br />
163<br />
As of December 31 [ € million ]<br />
ASSOCIATED COMPANIES<br />
Equity<br />
holding<br />
Assets Equity Liabilities Revenues Net profit<br />
<strong>2010</strong> 2009 <strong>2010</strong> 2009 <strong>2010</strong> 2009 <strong>2010</strong> 2009 <strong>2010</strong> 2009<br />
LogCap-IR Grundverwertungsgesellschaft<br />
mbH, Vienna /Austria 49.00 % 22 22 5 4 17 18 1 1 0 –5<br />
Lokomotion Gesellschaft für<br />
Schienentraktion mbH, Munich 4), 6) 29.40 % 14 14 6 7 8 7 23 32 – 1 0<br />
METRANS a. s., Prague /Czech Republic 34.33 % 169 167 97 82 72 85 132 110 22 0<br />
Omfesa Logística S.A., Madrid /Spain 38.66 % 23 23 3 2 20 21 16 13 – 3 0<br />
POLZUG Intermodal GmbH, Hamburg 5) 33.33 % 10 11 7 7 3 4 41 43 0 –2<br />
Pool Ibérico Ferroviario A.E.I.E.,<br />
Madrid /Spain 9.02 % 5 6 0 0 5 6 20 20 0 2<br />
PORT HANDLOWY ŚWINOUJŚCIE<br />
Sp. z o.o., Świnoujście /Poland 6) 42.80 % 9 8 4 2 5 6 19 13 1 0<br />
Prometro S.A., Porto /Portugal 1), 2), 5 ), 6 ) 20.00 % 22 4 18 28 0<br />
Railmax C.V., Nijmegen /<br />
The Netherlands 4) 38.27 % 3 0 0 0 3 0 16 0 0 0<br />
Saarländische Nahverkehrs-Service<br />
GmbH, Saarbrücken 4), 6) 30.00 % 0 0 0 0 0 0 24 25 0 0<br />
Sociedad de Estudios y Explotacion<br />
Material Auxiliar de Transportes,<br />
S.A. (“SEMAT”), Madrid /Spain 6) 48.56 % 38 40 12 15 26 25 19 22 –2 0<br />
SSG Saar-Service GmbH, Saarbrücken 4), 6) 25.50 % 3 3 1 1 2 2 13 12 0 0<br />
TFG Transfracht Internationale Gesellschaft<br />
für kombinierten Güterverkehr<br />
mbH & Co. KG, Frankfurt am Main 50.00 % 28 28 – 1 5 29 23 218 211 –5 0<br />
Trieste Trasporti S.P.A.,<br />
Triest /Italy 1), 2), 6 ) 39.94 % 101 44 57 71 7<br />
Unternehmensgesellschaft<br />
Verkehrsverbund Rhein-Neckar GmbH<br />
(URN GmbH), Mannheim 4), 6) 34.15 % 5 6 0 0 5 6 4 4 0 0<br />
VT-Transman Szemelyszallito es Szolgaltato<br />
Kft, Szekesfehervar/ Hungary 1), 2), 5 ) 49.91 % 13 4 9 17 1<br />
1)<br />
No data for 2009 financial year<br />
2)<br />
Addition in <strong>2010</strong><br />
3)<br />
Deviating financial year<br />
4)<br />
Figures from 2009 financial year<br />
6)<br />
Figures according to local GAAP<br />
7)<br />
Concerns financing transactions exclusively<br />
8)<br />
Data as of acquisition date<br />
9)<br />
Incomplete data<br />
5)<br />
Based on preliminary figures
164<br />
| DEUTSCHE BAHN GROUP<br />
CURRENCY TRANSLATION<br />
A) FUNCTIONAL CURRENCY AND REPORTING CURRENCY<br />
Currency translation uses the concept of the functional currency.<br />
The functional currency of all subsidiaries included in<br />
the consolidated financial statements of DB <strong>AG</strong> is the relevant<br />
local currency.<br />
The consolidated financial statements are prepared in euros<br />
(reporting currency).<br />
B) TRANSACTIONS AND BALANCES<br />
Transactions which are not carried out in the functional currency<br />
of a company included in the scope of consolidation (foreign<br />
currency transactions) are translated into the functional currency<br />
of the corresponding entity using the rate applicable at the time<br />
of the transaction. Exchange rate gains and losses resulting from<br />
processing such transactions and valuing monetary assets and<br />
liabilities at the rate applicable on the reporting date in the<br />
financial statements are recognized in the income statement.<br />
C) SUBSIDIARIES<br />
Subsidiaries whose functional currency is not the euro translate<br />
their financial statements which are prepared in local currency<br />
into the reporting currency (euro) for the purpose of being<br />
included in the consolidated financial statements of DB <strong>AG</strong> as<br />
follows: assets and liabilities are translated using the exchange<br />
rate applicable on the reporting date, income and expenditure<br />
are translated using the average rate. Differences resulting<br />
from currency translation are shown separately under shareholders’<br />
equity.<br />
The shareholders’ equity which has to be initially consolidated<br />
as part of an acquisition of foreign subsidiaries is translated as<br />
of the relevant balance sheet date using the historical rate<br />
applicable at the time of the acquisition. Any differences<br />
resulting from the currency translation are shown separately<br />
under shareholders’ equity.<br />
As long as the subsidiary is included in the scope of consolidation,<br />
the translation differences continue to be shown<br />
under consolidated shareholders’ equity. If subsidiaries are no<br />
longer included in the scope of consolidation, the corresponding<br />
translation differences are eliminated and recognized in the<br />
income statement.<br />
Goodwill and adjustments to the fair values of assets and<br />
liabilities due to acquisitions of foreign subsidiaries are treated<br />
as assets and liabilities of the foreign companies and are translated<br />
using the exchange rate applicable on the reporting date.<br />
The annual financial statements of subsidiaries which are<br />
domiciled in hyperinflationary economies are translated in accordance<br />
with IAS 29. No major subsidiary was domiciled in a hyperinflationary<br />
economy in the reporting and comparison period.<br />
Currency translation differences resulting from the translation<br />
of shares in a foreign subsidiary and also resulting from<br />
loans which are part of the net investment in such foreign<br />
subsidiaries are shown under shareholders’ equity. When the<br />
foreign subsidiary is no longer included in the scope of consolidation,<br />
the currency translation differences are eliminated<br />
via the income statement.<br />
The following exchange rates are some of the rates used<br />
for currency translation purposes:<br />
[€] Closing rates Average rates<br />
<strong>2010</strong> 2009 <strong>2010</strong> 2009<br />
1 Australian Dollar (AUD) 0.76127 0.62469 0.69323 0.56402<br />
1 Swiss Franc (CHF) 0.79974 0.67404 0.72431 0.66223<br />
1 Yuan Renminbi (CNY) 0.11335 0.10168 0.11145 0.10500<br />
1 Pound Sterling (GBP) 1.16178 1.12600 1.16543 1.12222<br />
1 Hong Kong Dollar (HKD) 0.09629 0.08952 0.09708 0.09253<br />
1 Japanese Yen ( JPY) 0.00920 0.00751 0.00860 0.00767<br />
1 Norwegian Krona (NOK) 0.12821 0.12048 0.12493 0.11459<br />
1 Polish Zloty (PLN) 0.25157 0.24364 0.25041 0.23105<br />
1 Swedish Krona (SEK) 0.11154 0.09754 0.10484 0.09416<br />
1 US Dollar (USD) 0.74839 0.69416 0.75422 0.71727
| CONSOLIDATED FINANCIAL STATEMENTS<br />
| Notes<br />
165<br />
RECOGNITION OF INCOME AND EXPENDITURE<br />
The revenues generated in DB Group relate to the provision of<br />
passenger transport, transport and logistics services, the provision<br />
of rail infrastructure, the sale of goods and other services<br />
related particularly to rail operations, less turnover tax, discounts<br />
and any price deductions. They are recognized with<br />
their fair value.<br />
The services provided by DB Group are normally completed<br />
within a few hours/days. Revenues resulting from the provision<br />
of services are therefore recognized as soon as the service has<br />
been provided, the extent of the revenues and the costs is reliably<br />
measurable and the economic benefit will probably accrue<br />
to the Group.<br />
Dividend income is recognized at the point at which the<br />
right to receive the payment arises. Interest income is recognized<br />
in the income statement using the effective interest method in<br />
the period in which the income arises.<br />
All expense and income items are normally recognized<br />
without being netted, unless the accounting principles under<br />
IFRS permit or require netting.<br />
Expenses are recognized in the income statement at the<br />
point at which the service is used or at the point at which the<br />
expenses are incurred.<br />
ACCOUNTING AND VALUATION METHODS<br />
A) PROPERTY, PLANT AND EQUIPMENT<br />
Property, plant and equipment is recognized at cost of purchase<br />
and cost of production less cumulative depreciation, and also<br />
with due consideration being given to impairments and reversals<br />
of previous impairments. Costs of purchase comprise the purchase<br />
price plus ancillary purchase costs less purchase price reductions.<br />
If there are any closure or restoration obligations, they are<br />
recognized in the costs of purchase and production of the property,<br />
plant and equipment, and a provision is shown at the same<br />
time. Cost of production comprises individual costs as well as<br />
overhead costs which are directly allocatable.<br />
If a considerable period is required for manufacturing an<br />
asset in order to place it in its intended state in which it is capable<br />
of being used or sold, directly attributable borrowing costs are<br />
capitalized as costs of production of the asset. If a direct link<br />
cannot be established, the average borrowing cost rate of the<br />
year under review is used. Turnover tax incurred in connection<br />
with the purchase or production of property, plant and equipment<br />
is only capitalized if input tax is not permitted to be deducted.<br />
Subsequent costs are capitalized if the expenses enhance the<br />
economic benefit of the property, plant and equipment and if<br />
the costs can be reliably measured. On the other hand, all other<br />
repairs or maintenance are expensed.<br />
Depreciation is taken to the income statement on a straightline<br />
basis over the expected service life of the asset. The following<br />
service lives for the main groups of property, plant and equipment<br />
are taken as a basis:<br />
. Years<br />
Permanent way structures, tunnels, bridges 75<br />
Track infrastructure 20–25<br />
Buildings and other constructions 10–50<br />
Land improvements 8–20<br />
Signaling equipment 20<br />
Telecommunications equipment 5–20<br />
Rolling stock 15 –30<br />
Other technical equipment, machinery and vehicles 3 –25<br />
Factory and office equipment 2–20<br />
The appropriateness of the chosen depreciation method and<br />
the service lives is subject to an annual review. Our expectations<br />
regarding the residual value are also updated annually.<br />
Investment grants are deducted directly from the cost of<br />
purchase or cost of production of the assets for which the grants<br />
have been given.<br />
B) FINANCE LEASE ASSETS<br />
Rented and leased assets where the underlying leases are classified<br />
as finance leases under IAS 17 are capitalized with the lower<br />
of fair value or the present value of minimum lease payments<br />
at the start of the lease, and are depreciated using the straightline<br />
method over the financial service life of the asset or the<br />
shorter duration of the lease.
166<br />
| DEUTSCHE BAHN GROUP<br />
C) INTANGIBLE ASSETS AND GOODWILL<br />
Intangible assets acquired for a monetary consideration are<br />
recognized at cost of purchase. Intangible assets manufactured<br />
in-house are recognized with their cost of production, and consist<br />
exclusively of software. The costs of the development phase<br />
are capitalized if a future economic benefit accrues to DB Group<br />
and if the other capitalization criteria are satisfied. The costs of<br />
production comprise all costs which can be directly allocated<br />
and those costs which are incurred in order to prepare the asset<br />
for its envisaged use.<br />
Costs of production comprise mainly costs for material and<br />
services, wage and salary costs as well as relevant overhead costs.<br />
If a considerable period is required for manufacturing an<br />
asset in order to place it in its intended state in which it is capable<br />
of being used or sold, directly attributable borrowing costs are<br />
capitalized as costs of production of the asset. If a direct link<br />
cannot be established, the average borrowing cost rate of the<br />
year under review is used.<br />
Turnover tax incurred in connection with the purchase and<br />
production of intangible assets is only capitalized if input tax<br />
is not deductible.<br />
Intangible assets (excluding goodwill) are subsequently<br />
valued at cost of purchase or cost of production less depreciation<br />
and impairments plus any reversals of previous impairments.<br />
Depreciation is calculated using the straight-line method. The<br />
adequacy of the depreciation method and the service life are<br />
subject to an annual review.<br />
The following probable service lives are used as the basis<br />
for depreciation on intangible assets:<br />
D) IMPAIRMENTS OF ASSETS<br />
IAS 36 governs the impairment test for tangible and intangible<br />
assets with a certain economic life, which is carried out using a<br />
so-called indicator-based asset impairment test. Such an asset<br />
impairment test has to be carried out when indicators (so-called<br />
triggering events) indicate a possible loss of value. In addition,<br />
according to IAS 36, goodwill as well as intangible assets with an<br />
indefinite service life have to be subjected at least once a year<br />
to an impairment test in the form of a goodwill impairment test.<br />
Definition of cash-generating units<br />
Goodwill impairment tests have to be carried out at the level of<br />
individual assets as part of the asset impairment test. If it is not<br />
possible to determine future cash flows, which are to a large<br />
extent independent, for an individual asset, so-called cashgenerating<br />
units (CGUs) have to be formed. The criteria for<br />
defining the CGUs are based on the structure of the operating<br />
business. In DB Group, the CGUs to a large extent correspond<br />
to the operating segments, whereby further differentiation has<br />
taken place within the segment DB Services as a result of different<br />
contents. Due to the congruence between management<br />
structure and legal structure, a CGU always consists of at least<br />
one legal unit. This means that the data necessary for the asset<br />
impairment test can be derived from annual financial statements<br />
and planning data.<br />
. Years<br />
Duration of<br />
Franchises, rights, etc.<br />
contract<br />
Trademarks<br />
Brand names<br />
Customer base<br />
Economic life<br />
Economic life<br />
Economic life<br />
Purchased software 3–5<br />
Software produced in-house 3<br />
Goodwill arises as a positive difference between the costs of<br />
purchasing the shares and the fair values of the individually<br />
acquired assets, absorbed liabilities and contingent liabilities.<br />
They are not depreciated; instead, they are subject to an annual<br />
impairment test. Impairment losses in relation to goodwill are<br />
not reversed.
| CONSOLIDATED FINANCIAL STATEMENTS<br />
| Notes<br />
167<br />
The impairment test for goodwill is carried out at the level of<br />
the CGU to which the goodwill has been allocated. Significant<br />
goodwill currently exists in the CGUs DB Schenker Logistics and<br />
DB Schenker Rail. Arriva, which was acquired in August <strong>2010</strong> and<br />
which is maintained as an independent CGU in DB Group, was<br />
not considered in the impairment regulation process in accordance<br />
with IAS 36 for the <strong>2010</strong> financial statements. In the year<br />
under review, the acquisition-related goodwill of Arriva (€1,338 million)<br />
was completely allocated to the new CGU DB Arriva. The<br />
annual impairment test for the goodwill of DB Arriva was derived<br />
from the knowledge of the valuations carried out for the acquisition<br />
of Arriva (discounted cash flow method) in order to determine<br />
the plausibility of the purchase price. The free cash flows<br />
(after tax) for calculating the fair value less cost to sell was<br />
derived from the five-year planning of DB Arriva which was<br />
submitted by the Management Board of DB Arriva at that time<br />
of valuation. The growth rate for extrapolating the last forecast<br />
year was 2 % p.a. A weighted average cost of (WACC) 9.0 % was<br />
used for discounting the free cash flows. In consequence, the<br />
purchase price is covered by the fair value less cost to sell of<br />
DB Arriva, which means that there is no impairment requirement<br />
in accordance with IAS 36.<br />
The annual impairment test for the Arriva brand has been<br />
carried out at the level of the CGU Arriva based on the assumptions<br />
described above. In consequence, it has been possible to<br />
confirm the value of the brand on the basis of the fair value less<br />
costs to sell.<br />
Method<br />
In the impairment test in accordance with IAS 36, the carrying<br />
amount of an asset, a CGU or for the goodwill impairment test<br />
on the basis of a group of CGUs has to be compared with the<br />
corresponding recoverable amount. If the carrying amount is<br />
no longer covered by the recoverable amount, this results in a<br />
corresponding impairment.<br />
The carrying amount of a CGU is established by adding the<br />
carrying amounts of the assets less the liabilities which are<br />
related to the relevant assets. In addition, for determining the<br />
carrying amount of a CGU, it is also necessary to recognize<br />
corporate assets and corporate liabilities jointly used by several<br />
CGUs, and the net working capital necessary for the corresponding<br />
CGU must also be taken into consideration.<br />
The recoverable amount is defined as the higher of the fair value<br />
less costs to sell and the value in use. In the impairment tests<br />
carried out in DB Group, the recoverable amount is represented<br />
by the value in use. The value in use is established as the present<br />
value of the free cash flows before interest and before tax<br />
attributable to the continuation of a CGU or a group of CGUs.<br />
The forecast of cash flows reflects previous experience, and<br />
takes account of management expectations with regard to future<br />
market developments. The average growth rates are in line with<br />
the expectations of the industry. These cash flow forecasts are<br />
based on the medium-term planning which is submitted to the<br />
Supervisory Board of DB <strong>AG</strong> and which covers a planning horizon<br />
of five years. If cash flow forecasts are necessary beyond the<br />
five-year planning horizon, a sustainable free cash flow is derived<br />
from the forecast and is extrapolated on the basis of a growth<br />
rate related to the specific market development. In general, an<br />
average growth rate of 1 % p.a. is assumed (unchanged to the<br />
previous year).<br />
A weighted average cost of capital (WACC) is used for<br />
discounting the free cash flows; this reflects the expectation of<br />
return of the capital market for providing debt capital and<br />
shareholders’ equity to DB Group. In order to maintain consistency<br />
with the process of establishing the free cash flows before<br />
corporate taxes, a WACC before corporate taxes is used. Risks<br />
of free cash flows are recognized by a risk-equivalent capitalization<br />
rate. In view of the sub-group structure on the one hand<br />
and the fact that there is to a large extent a community of risk<br />
and resources within DB Group on the other hand, this rate is<br />
defined uniformly as 10.2 % for all CGUs of DB ML Group (previous<br />
year: 10.5 %) and 8.0 % for the CGUs of Infrastructure (previous<br />
year: 8.4 %). The slight reduction in the WACCs compared with<br />
the previous year is attributable to the medium- to long-term<br />
development of the external capital market.
168<br />
| DEUTSCHE BAHN GROUP<br />
Asset impairment test<br />
Processes which comply with the specific requirements of<br />
IAS 36 have been implemented in order to carry out the asset<br />
impairment test. The service lives of the individual CGUs used<br />
for the asset impairment test are based on the service life of the<br />
asset or a group of homogenous assets which is (are) most<br />
significant for the particular CGU.<br />
In addition, the process of establishing the service life<br />
disregards future cash flows which result from major structural<br />
changes, disinvestment measures or extension investments.<br />
Resulting adjustments to the original plans relate mainly to the<br />
major new and expansion infrastructure projects, where it is<br />
assumed that the construction process will not be completed<br />
in the medium-term, but beyond 2015.<br />
The cash flow forecasts take account of internal transfer<br />
prices within DB Group on the basis of arm’s length assessments<br />
of the companies involved. The published infrastructure prices<br />
are applicable for products and services exchanged between<br />
transport and infrastructure segments; price increases in the<br />
period covered by the planning period have also been taken into<br />
consideration.<br />
After the medium-term planning has been completed, a<br />
regular check is carried out to determine whether impairments<br />
are necessary at the CGU level. In addition to this annual cycle,<br />
a test is also performed if current issues arising from the development<br />
in business or changes in assumptions indicate that<br />
there has been a major deterioration in the value in use.<br />
The voluntary impairment tests carried out in the period<br />
under review did not identify any impairment requirement for<br />
any CGU. The voluntary asset impairment test carried out in<br />
December <strong>2010</strong> after the medium-term planning was adopted<br />
also did not identify any impairment requirement for any CGU.<br />
Goodwill impairment test<br />
A goodwill impairment test must be carried out annually for all<br />
CGUs or groups of CGUs to which goodwill can be allocated.<br />
Because the goodwill which arises in DB Group as a result of<br />
acquisitions can always be clearly allocated to a CGU, this goodwill<br />
impairment test is an integral part of the asset impairment<br />
test which is always carried out annually on a voluntary basis<br />
for all CGUs.<br />
The goodwill impairment tests carried out for the CGUs did not<br />
identify any impairment requirement. The respective recoverable<br />
amount is represented by the value in use of the CGU (with the<br />
exception of the CGU DB Arriva), which in turn has been derived<br />
from the medium-term planning of the two segments. The details<br />
relating to methods presented above are thus applicable correspondingly.<br />
At DB Schenker Logistics and DB Schenker Rail,<br />
it also has to be borne in mind that separate assumptions relating<br />
to the development of the economy, market and competition<br />
as well as currency relations have been made for the relevant<br />
international markets. These assumptions have been based on<br />
the external and internal expert assessments available at the<br />
time of the planning.<br />
E) SHARES IN COMPANIES ACCOUNTED FOR<br />
USING THE EQUITY METHOD<br />
Shares in associated companies and joint ventures are accounted<br />
for using the equity method in accordance with IAS 28 (Shares<br />
in Associated Companies) or in accordance with the option<br />
specified in IAS 31 (Shares in Joint Ventures). Based on the Group<br />
costs of purchase at the time of the purchase, the figure for the<br />
change in shareholders’ equity at the company accounted for<br />
using the equity method attributable to the shares of DB Group<br />
is extrapolated.<br />
F) FINANCIAL ASSETS<br />
Arm’s length purchases or sales of financial assets are recognized<br />
or eliminated on the settlement date. At present, there are the<br />
following categories in DB Group in accordance with IAS 39:<br />
Available-for-sale financial assets<br />
Available-for-sale financial assets are normally recognized with<br />
their fair value. If the fair value of equity instruments is not<br />
reliably measurable, the available-for-sale financial assets are<br />
recognized at cost of purchase less any impairment.<br />
Shares in non-consolidated subsidiaries and other equity<br />
investments are also considered to be available-for-sale financial<br />
assets. They are normally shown with their amortized cost of<br />
purchase because the future cash flows for determining the<br />
market value of the shares cannot be reliably established.<br />
Available-for-sale long- or short-term securities are recognized<br />
with their market values as of the reporting date – where<br />
such values exist. Changes in fair value are recognized with no<br />
impact on the income statement in the reserve attributable to<br />
the marking-to-market of securities.
| CONSOLIDATED FINANCIAL STATEMENTS<br />
| Notes<br />
169<br />
Receivables and other financial assets<br />
Receivables and other financial assets are initially measured at<br />
fair value. In general, this is equivalent to the costs of purchase.<br />
Long-term interest-free or low-interest receivables (receivables<br />
due after more than one year) are discounted to the present<br />
value of future cash flows. Discounted receivables are adjusted<br />
for cumulative interest in subsequent periods with the effective<br />
interest fixed for initial valuation.<br />
Receivables for which there are substantial objective indications<br />
of an impairment are adjusted appropriately. Portfolio-based<br />
allowances are also recognized in relation to groups of assets;<br />
in particular, historical default rates are taken into consideration.<br />
Cash and cash equivalents<br />
This item comprises cash in hand and checks, deposits at banks<br />
which are due on sight, as well as cash and cash equivalents.<br />
Balances at banks comprise overnight money as well as time<br />
deposits due within three months.<br />
Liquid assets are recognized with their nominal value.<br />
G) INVENTORIES<br />
All costs which are directly related to the procurement process<br />
are capitalized as the costs of purchase of the inventories. The<br />
average method is used as the basis for establishing the cost of<br />
purchase of fungible and homogeneous raw materials and supplies.<br />
Costs of production comprise individual costs as well as<br />
the directly attributable overhead costs.<br />
As of the balance sheet date, inventories are measured with<br />
the lower of cost or net realizable value.<br />
H) AVAILABLE-FOR-SALE NON-CURRENT ASSETS<br />
Under IFRS 5, non-current assets are classified as available-forsale<br />
non-current assets if their carrying amount is to be realized<br />
by way of sale and not by way of continued use. This can be an<br />
individual asset, a disposal group or part of a company. Noncurrent<br />
available-for-sale assets are stated with the lower of<br />
carrying amount or market value less costs which are incurred.<br />
In the year under review, reclassifications related almost exclusively<br />
to the acquired business of Arriva in Germany.<br />
I) DEFERRED TAXES<br />
Deferred taxes are calculated in accordance with IAS 12 (Income<br />
Taxes).<br />
The Group tax rate for domestic companies used as the<br />
basis for calculating deferred taxes was 30.5 %. The Group tax<br />
rate comprises the corporation tax rate plus solidarity surcharge<br />
and an average trade tax rate. Foreign subsidiaries use their<br />
relevant local tax rates for calculating deferred taxes.<br />
A deferred tax asset is recognized in accordance with<br />
IAS 12.24 or IAS 12.34 if, after corresponding deferred tax liabilities<br />
have been deducted, it is likely that adequate taxable<br />
income is available. The medium-term planning with additional<br />
estimates is used as the basis of this process. Deferred tax<br />
assets relating to income which can be generated after the<br />
medium-term period are not recognized, on the grounds that<br />
they cannot be reliably determined.<br />
Deferred taxes are established on the basis of the tax rates<br />
which can be expected for the period in which the deferred tax<br />
is realized on the basis of existing laws or laws which have in<br />
essence been adopted.<br />
J) FINANCIAL DEBT AND LIABILITIES<br />
Current liabilities are normally recognized with their nominal<br />
amount, which corresponds to the fair value at the point at<br />
which the liability is initially recognized and the amortized costs<br />
of purchase up to the date at which the liability is settled.<br />
Financial debt and other non-current liabilities, when initially<br />
recognized, are stated with the amount which corresponds to<br />
the fair value of the received assets, where appropriate less<br />
transaction costs. Subsequently, they are stated using amortized<br />
costs of purchase using the effective interest method. The differences<br />
between the amount paid out less transaction costs<br />
and the amount repaid are recognized in the income statement<br />
over the life of the liability.
170<br />
| DEUTSCHE BAHN GROUP<br />
Interest-free Federal Government loans which are related to<br />
infrastructure capital expenditures are recognized with the<br />
present value of the amounts to be repaid, and are adjusted to<br />
their nominal repayment amount over their life. The difference<br />
between the nominal amount of the loan and the present value<br />
is recognized as an interest benefit under accruals. Interest<br />
income attributable to the pro rata reversal of these accruals<br />
compensates for the interest expense relating to the compounding<br />
of the loans.<br />
Liabilities arising from leases which are classified as finance<br />
leases in accordance with the allocation criteria of IAS 17 are<br />
recognized at the lower of fair value and the present value of<br />
minimum leasing payments at the beginning of the lease, and<br />
are subsequently stated under financial debt in the amount of<br />
amortized cost of purchase. The leasing installments are broken<br />
down into an interest component and a repayment component.<br />
The interest component of the leasing installment is recognized<br />
in the income statement.<br />
K) EMPLOYEE BENEFITS<br />
Pension obligations and similar commitments<br />
In DB Group, there are defined benefit as well as defined contribution<br />
retirement pension systems.<br />
The provision for defined retirement benefit systems stated<br />
in the balance sheet corresponds to the present value of the<br />
pension commitment (Defined Benefit Obligation; DBO) less<br />
the fair value of the plan assets on the balance sheet reporting<br />
date, adjusted by cumulative actuarial profits and losses which<br />
are not reflected in the income statement and subsequently<br />
applicable service costs which have not yet been recognized.<br />
The pension obligation is calculated annually by independent<br />
actuarial appraisals using the projected unit credit method.<br />
Actuarial profits and losses are not recognized in the income<br />
statement if they do not exceed 10 % of the higher of the obligation<br />
or the present value of plan assets (10 % corridor rule). The<br />
amount which exceeds the corridor is recognized over the<br />
expected average remaining service lives of the employees<br />
covered by the plan.<br />
Past service cost is immediately recognized in the income statement,<br />
unless the changes in the pension plan (retirement pension<br />
system) depend on the employee remaining in the company<br />
for a defined period (the period up to the point at which the<br />
rights become vested). In this case, the past service cost is<br />
recognized in profit or loss on a straight-line basis over the period<br />
until vesting.<br />
The expense arising from applying interest to the pension<br />
obligations and the expected income from the plan assets is<br />
recognized in financial result.<br />
In the case of defined contribution retirement pension<br />
systems, DB Group pays contributions to public sector or private<br />
retirement pension schemes, either voluntarily or as a result of<br />
a contractual or statutory obligation. DB Group does not have<br />
any additional payment obligations beyond having to pay the<br />
contributions. The contributions are recognized in personnel<br />
expenses when due. Advance payments of contributions are<br />
recognized as assets to the extent that there is a right for a<br />
repayment or reduction of future payment.<br />
The discount rate for measuring pension obligations was<br />
determined on the basis of the yields obtained on the market<br />
on the balance sheet date for prime fixed-income industrial<br />
bonds. Prime corporate bonds with an AA rating are used as the<br />
basis in this respect.<br />
Payments on the occasion of termination of employment<br />
contracts (severance packages)<br />
Severance packages become payable if an employee is released<br />
from his duties before normal pensionable age or if an employee<br />
voluntarily terminates his employment contract in return for a<br />
severance package. Severance payments are recognized if there<br />
is a demonstrable obligation either to terminate the employment<br />
agreements of current employees in accordance with a detailed<br />
formal plan which cannot be reversed or to pay severance payments<br />
if the employment contract is voluntarily terminated by<br />
employees within the framework of employment contract termination<br />
agreements.<br />
Severance package obligations for agreements agreed as of<br />
the balance sheet date are recognized as other liabilities and – if<br />
they are not yet included in individual agreements and if they<br />
are part of a restructuring obligation in accordance with IAS 37<br />
(Provisions, Contingent Liabilities and Contingent Assets) – are<br />
stated as other provisions.
| CONSOLIDATED FINANCIAL STATEMENTS<br />
| Notes<br />
171<br />
Semi-retirement agreements are based on the so-called block<br />
model. The top-up amounts paid in addition to salary by DB Group<br />
during the semi-retirement period as well as additional contributions<br />
to the statutory pension insurance scheme constitute<br />
benefits arising upon termination of the employment contract.<br />
They are shown with their present value at the point at which<br />
the obligation originated. The compensation backlog (plus the<br />
employer’s contributions to social insurance) for the additional<br />
work performed during the employment phase is also shown<br />
with the present value. The expenses attributable to cumulative<br />
interest on the obligations are shown under personnel expenses.<br />
Other benefits due in the long term<br />
Employees who are covered by the regulations of the collective<br />
bargaining agreement with regard to maintaining long-term<br />
accounts for the employees of various companies of DB Group<br />
(referred to in the following as “Lzk-TV”), are able to convert<br />
their overtime which they have worked into a long-term account<br />
or payment for this account on one occasion or on a regular<br />
basis. DB Group has agreed to pay the compensation for the<br />
additional overtime or the converted compensation on the basis<br />
of a separate contribution agreement plus the related employer’s<br />
contributions to social insurance into the “Fonds zur Sicherung<br />
von Wertguthaben e.V.” (credit fund) every month at the point<br />
at which the salary payment becomes due. The credit fund has<br />
been established in the legal form of a registered association<br />
as a joint institution of the wage-bargaining parties in accordance<br />
with the Wage Bargaining Act (Tarifvertragsgesetz). The wage<br />
bargaining parties, in their capacities as members of the association,<br />
are responsible for managing and administering the credits.<br />
The compensation paid to the employees starting with the<br />
beginning of a phase during which the employees are exempted<br />
from their duties is financed out of the credit fund. The length<br />
of the phase during which the employees are exempted from<br />
their duties is determined by the size of the credit which has<br />
accumulated or by an application of the employee.<br />
With regard to the credits, no further financial risks are<br />
retained in DB Group when the funds are paid out.<br />
The plan is treated as a defined contribution plan.<br />
L) OTHER PROVISIONS<br />
Other provisions are set aside if there is a legal or constructive<br />
obligation resulting from a past event which is more than 50 %<br />
likely to result in an outflow of resources and if the extent of<br />
the obligation can be reliably estimated. If it is likely that a<br />
provision will be refunded, for instance as a result of an insurance<br />
policy, the refund is recognized as a separate asset only if<br />
it is as good as certain. The income from refunds is not netted<br />
with the expenses.<br />
Non-current provisions are discounted using market<br />
interest rates. Environmental protection provisions for the<br />
rehabilitation of existing ecological legacy issues are discounted<br />
on the basis of real interest rates, which are adjusted to reflect<br />
the risk and the period until fulfillment. The difference between<br />
the nominal value of the expected outflows and the present<br />
value recognized for the environmental protection provisions<br />
of DB <strong>AG</strong> for transferred liabilities for the elimination of legacy<br />
issues from the time previous to the foundation of DB <strong>AG</strong> is<br />
stated under deferred income, and represents the interest<br />
benefit resulting from the longer-term release of the provision.<br />
The cumulative interest expense attributable to other provisions<br />
is recognized in financial result.<br />
M) DEFERRED INCOME<br />
Deferred public-sector grants<br />
DB Group receives various public-sector grants, which are provided<br />
in relation to specific assets or on the basis of a specific<br />
performance. The grants are recognized in the balance sheet as<br />
soon as it is certain that they will be provided and as soon as<br />
the conditions necessary for receiving the grants have been<br />
satisfied. The grants related to assets, and in particular investment<br />
grants, are deducted directly from the assets for which<br />
grants have been received. The interest benefit (difference<br />
between nominal value and present value) of interest-free loans<br />
are deferred on the basis of the contractual grant conditions.<br />
Deferred profits from sale-and-lease-back agreements<br />
If capital gains have been realized in conjunction with sale-andlease-back<br />
agreements and if the subsequent lease has to be<br />
classified as a finance lease, these gains are deferred and released<br />
with an impact on the income statement over the life of the<br />
relevant agreements.
172<br />
| DEUTSCHE BAHN GROUP<br />
N) DERIVATIVE FINANCIAL INSTRUMENTS<br />
Recognition of derivative financial instruments<br />
At the point at which the contract is concluded, derivative financial<br />
instruments are recognized as a financial asset or a financial<br />
liability in the balance sheet. Derivative financial instruments<br />
are initially and subsequently measured at fair value. The treatment<br />
of changes in the fair value depends on the type of the<br />
hedged underlying. At the point at which the contract is taken<br />
out, derivative financial instruments are generally classified as<br />
a hedging instrument (a) for hedging the fair value of certain<br />
assets or liabilities recognized in the balance sheet (fair value<br />
hedge) or (b) for hedging the cash flows arising from a contractual<br />
obligation or an expected transaction (cash flow hedge).<br />
Fair-value hedges<br />
The purpose of fair value hedges is to provide protection against<br />
changes in the value of balance sheet items. In these cases, the<br />
hedge as well as the hedged risk content of the underlying are<br />
recognized with their present value. Changes in value are recognized<br />
in the income statement.<br />
DB Group currently does not have any fair value hedges.<br />
Cash flow hedges<br />
Cash flow hedges are used to provide protection against fluctuations<br />
in the cash flows of financial assets or liabilities. When<br />
future cash flows are hedged, the hedging instruments are also<br />
recognized with their fair value. Changes in value are initially<br />
recognized in shareholders’ equity with no impact on the income<br />
statement, and are only recognized in the income statement at<br />
the point at which the corresponding losses or profits from the<br />
underlying have an impact on the income statement or the<br />
transactions expire.<br />
on comparable financial instruments which are traded in an<br />
active market; these forecasts are then adjusted by premiums<br />
or discounts on the basis of historical data. The mean value of<br />
bid and offer rates are used. Trades for which no premium has<br />
been paid have a fair value of zero upon conclusion. In the case<br />
of long-dated derivatives, a credit risk adjustment is made in<br />
relation to the fair value if the counterparty is no longer classified<br />
as “investment grade” by the rating agencies and if the<br />
overall position constitutes a receivable from the point of view<br />
of DB Group. However, this is not the case in these financial<br />
statements due to considerations of materiality.<br />
All derivatives used in DB Group are measured using<br />
common methods such as option price or present value models,<br />
because their fair values are not traded on an active market.<br />
No parameters from non-observable markets are used for measurement<br />
purposes.<br />
CAPITAL MAN<strong>AG</strong>EMENT IN DB GROUP<br />
(IN ACCORDANCE WITH IAS 1)<br />
The purpose of financial management of DB Group is to achieve<br />
sustainable growth in the enterprise value and also to comply<br />
with a capital structure which is adequate for maintaining a very<br />
good rating.<br />
The capital structure is managed on the basis of the gearing<br />
figure. Gearing is defined as the ratio between net financial debt<br />
(financial debt less receivables from financing and cash and cash<br />
equivalents) and shareholders’ equity. The main instruments<br />
for managing the capital structure are: scheduled repayment of<br />
financial debt as well as strengthening of the capital base by<br />
way of retained earnings.<br />
Derivative financial instruments which do not satisfy the requirements<br />
for recognizing hedges in accordance with IAS 39<br />
If hedges which in economic terms are used for interest, currency<br />
or price hedging do not satisfy the restrictive requirements of<br />
IAS 39 for being recognized as a hedge, the changes in value are<br />
immediately recognized in the income statement.<br />
Calculation of the fair value<br />
The fair value of financial instruments which are traded in an<br />
active market is derived from the market price applicable on the<br />
balance sheet date. In order to calculate the fair value of financial<br />
instruments which are not traded on an active market,<br />
common measurement methods such as option price or present<br />
value models are applied. If valuation-relevant parameters are<br />
not directly observable on the market, forecasts are used based
| CONSOLIDATED FINANCIAL STATEMENTS<br />
| Notes<br />
173<br />
The medium-term aim is to achieve gearing of 100 % and thus<br />
parity between debt and equity in the financing structure. This<br />
objective is unchanged compared with last year. Gearing has<br />
developed as follows:<br />
[ € million ] <strong>2010</strong> 2009<br />
Financial debt 18,553 16,510<br />
– Receivables from financing – 139 –29<br />
– Cash and cash equivalents – 1,475 –1,470<br />
NET FINANCIAL DEBT 16,939 15,011<br />
÷ Equity 14,316 13,066<br />
GEARING 118% 115 %<br />
There was a minimum deterioration in gearing compared with<br />
the previous year, as the positive net income with the corresponding<br />
strengthening of shareholders’ equity was not able to<br />
compensate for the rise in net financial debt. If DB Arriva is<br />
adjusted, net financial debt would have declined by € 2,973 million<br />
to € 13,966 million, and gearing would have improved to 98 %.<br />
There are no major external capital market restrictions.<br />
Based on adjusted EBIT, return on capital employed (ROCE)<br />
is calculated as a key component of the value management<br />
concept. The capital employed represents the use of capital<br />
provided by shareholders and providers of debt which is tied up<br />
in DB Group and which is associated with return expectations.<br />
The parameter is derived on the basis of the closing balance<br />
sheet for the year under review. The following table shows the<br />
process of calculating capital employed, using the asset and<br />
liability items shown in the balance sheet.<br />
[ € million ] <strong>2010</strong> 2009<br />
Property, plant and equipment /<br />
intangible assets 42,027 39,509<br />
+ Inventories 916 814<br />
+ Trade receivables 3,877 3,030<br />
+ Receivables and other assets 1,002 689<br />
– Receivables from financing –139 –29<br />
+ Income tax receivables 99 150<br />
+ Assets held for sale 169 0<br />
– Trade liabilities –4,286 –3,267<br />
– Other liabilities – 3,436 –3,183<br />
– Income tax liabilities – 146 –60<br />
– Other provisions – 6,256 – 6,419<br />
– Deferred income –2,515 –2,638<br />
CAPITAL EMPLOYED 31,312 28,596<br />
For further calculation, the adjusted EBIT and EBITDA in the following<br />
table is derived from the operating result (EBIT) shown<br />
in the income statement. The corresponding details at the segment<br />
level have been calculated using the same method.<br />
[ € million ] 2009<br />
Operating profit (EBIT) 1,817 2,208<br />
Release of personnel-related<br />
provisions –140 61<br />
Provisions for technology-related<br />
risks raised 141 331<br />
Revaluation of property-related risks 40 35<br />
Property sales Stuttgart 21 0 –639<br />
Other 8 –311<br />
EBIT ADJUSTED 1,866 1,685<br />
Depreciation 2,912 2,825<br />
Impairments (previous year:<br />
installations /properties) –127 –108<br />
EBITDA ADJUSTED 4,651 4,402<br />
Adjustments to EBIT totaling € 49 million were recognized in the<br />
year under review. These adjustments are mainly attributable<br />
to the creation of provisions for obligations arising from technology<br />
risks for vehicles and superstructure (€ 141 million) as<br />
well as the reversal of personnel provisions (€ 140 million) and<br />
also the reassessment of real estate risks (€ 40 million).
174<br />
| DEUTSCHE BAHN GROUP<br />
The capital employed and the adjusted EBIT have resulted in<br />
the following figures for return on capital employed (ROCE).<br />
[ € million ] <strong>2010</strong> 2009<br />
EBIT adjusted 1,866 1,685<br />
÷ Capital employed 31,312 28,596<br />
RETURN ON CAPITAL<br />
EMPLOYED (ROCE) 6.0 % 5.9 %<br />
On a comparable basis (excluding DB Arriva) ROCE would have<br />
improved to 6.4 %.<br />
EBITDA margin<br />
If the actual EBITDA margin is 10 % lower than the current assumptions,<br />
there would not be any impairment requirement at any of<br />
the defined CGUs for the property, plant and equipment and the<br />
intangible assets in accordance with IAS 36.<br />
Average real growth rate of cash flows<br />
If the long-term growth rate of cash flows were to be 10 % lower<br />
than the current assumption (assuming average growth of 1.0 %<br />
p.a.), there would also not be any impairment requirement<br />
(similar to the situation in the previous year).<br />
CRITICAL ASSESSMENTS AND APPRAISALS<br />
The consolidated financial statements are based on assessments<br />
and assumptions relating to the future. Assessments and<br />
appraisals established on this basis are continuously reviewed,<br />
and are based on historical experience and other factors, including<br />
expectations of future events which appear to be reasonable in<br />
the given circumstances. Of course, the assessments will not<br />
always correspond to subsequent actual circumstances.<br />
The assessments and assumptions which may involve a<br />
significant risk in the form of a major adjustment of the carrying<br />
amounts of assets and liabilities during the next financial year<br />
are discussed in the following.<br />
A) IMPAIRMENT OF CASH-GENERATING UNITS<br />
Depending on specific events or circumstances, DB Group regularly<br />
assesses whether there is any need for impairment of a<br />
CGU. Fundamental principles and assumptions of the impairment<br />
procedure used in DB Group in accordance with IAS 36 (Impairment<br />
of Assets) are detailed in the section “Accounting and<br />
valuation methods” under “Impairments of assets.” We have<br />
provided the following explanations concerning individual<br />
assumptions which have an impact on the value of a CGU:<br />
Weighted average cost of capital<br />
If the weighted average cost of capital (WACC), which has been<br />
used as the standard method of determining the present value<br />
of the value in use, were to be 10 % higher than the current model<br />
assumptions of 8.0 % for CGUs of the infrastructure and 10.2 %<br />
for CGUs of DB ML Group, there would only be a shortfall in the<br />
carrying amount for the CGU DB Vehicle Fleet. This impairment<br />
requirement would not be applicable if the increase in WACC<br />
were less than 7 % compared with the assumed standard rate.<br />
For all other CGUs, there would not be any impairment requirement<br />
even if WACC were to increase by 10 %.<br />
Useful life and residual value<br />
If the terminal value of the cash-generating units were to be 8 %<br />
lower, there would be an impairment requirement for the CGU<br />
DB Vehicle Fleet. For all other cash generating units, there would<br />
also not be an impairment requirement if the terminal value<br />
were to be 10 % lower.<br />
B) DEFERRED TAXES<br />
The calculation of deferred tax assets is generally based on the<br />
medium-term planning. If the sum of net profits planned for the<br />
medium-term planning period were to decline by 10 % in conjunction<br />
with otherwise unchanged tax parameters, deferred tax<br />
assets would have to be adjusted by € 141 million (previous year:<br />
€ 107 million).
| CONSOLIDATED FINANCIAL STATEMENTS<br />
| Notes<br />
175<br />
C) ENVIRONMENTAL PROTECTION PROVISIONS<br />
The environmental protection provisions relate primarily to the<br />
obligation of DB <strong>AG</strong> to remedy the ecological legacy issues which<br />
arose before January 1, 1994 on the land of the <strong>Deutsche</strong> Bundesbahn<br />
and the former <strong>Deutsche</strong> Reichsbahn. The ecological<br />
legacy issues comprise mainly contamination of soil and groundwater<br />
as a result of using the properties. The obligation to<br />
rehabilitate the property is derived from the Federal Soil Protection<br />
Act (Bundesbodenschutzgesetz; BodSchG), the Water<br />
Management Act (Wasserhaushaltsgesetz; WHG), the Landfill<br />
Site Ordinance (Deponieverordnung; DepV) as well as other<br />
additional acts and ordinances.<br />
The provision has been calculated on the basis of a discounting<br />
method using the present value, where rehabilitation<br />
measures are probable, the rehabilitation costs can be reliably<br />
estimated and no future benefit is expected to be derived from<br />
these measures.<br />
The estimation of future rehabilitation costs is subject to<br />
various uncertainties. In addition to technical developments in<br />
the rehabilitation field and the intensity of innovation, changes<br />
in the legal background can also have a substantial impact on<br />
rehabilitation costs. For establishing the amount of the provision<br />
stated in the balance sheet, the rehabilitation obligations which<br />
are currently physically known or identifiable have been used<br />
as the basis for estimating the expected costs in relation to the<br />
current price level.<br />
The figure shown for environmental protection provisions<br />
is calculated on the basis of expected cash-effective outflows<br />
and on the basis of the application of a risk-adjusted real interest<br />
rate of 0.71 % (previous year: 0.69 %).<br />
If major legal conditions or official covenants result in implementation<br />
times of rehabilitation measures which differ considerably<br />
from the estimated time corridor, this might result in a<br />
changed time horizon for the expected cash outflows, and also<br />
to a changed provision. In addition, price increases may also<br />
result in a higher provision.<br />
E) PENSIONS AND SIMILAR OBLIGATIONS<br />
Actuarial methods have been used for measuring defined benefit<br />
pension commitments as well as benefit commitments which<br />
are similar to pensions and the resultant costs and income. The<br />
valuations are based on actuarial assumptions. These include in<br />
particular discount factors, salary and pension trends as well as<br />
biometrical calculation bases. The discount factors which are<br />
used reflect the interest rates (giving due consideration to the<br />
duration of the underlying obligation) which are achieved on<br />
the balance sheet date for high-quality fixed-income bonds with<br />
a corresponding term. In the case of externally financed pension<br />
plans, the values of the corresponding plan assets or the refund<br />
claims are based on the market values as of the balance sheet<br />
date. This value is used as the basis for determining the expected<br />
yield of the fund assets or the refund claims. The expected yield<br />
of fund assets or the refund claims is determined on a uniform<br />
basis, taking account of historical long-term yields, the portfolio<br />
structure and expectations of future long-term yields. Other key<br />
assumptions for expenses and income attributable to pension<br />
commitments and benefit commitments similar to pensions are<br />
to some extent based on current market conditions. Expenses<br />
and income attributable to pension commitments and benefit<br />
commitments similar to pensions may change as a result of<br />
changes to these underlying key assumptions.<br />
F) PROVISIONS<br />
Estimates are associated with the process of determining all<br />
types of provisions.<br />
Special items in internal reporting<br />
The special items consist of issues which are of an exceptional<br />
nature. These are adjusted in internal reporting if the factor is<br />
of an exceptional and non-operational nature and if the impact<br />
on results is material.<br />
D) TRADE RECEIVABLES AND OTHER RECEIVABLES<br />
comprises assessments and appraisals of individual receivables<br />
which are based on the creditworthiness of the particular customer,<br />
current economic developments as well as an analysis of<br />
historical bad debts at the portfolio level. If the impairment is<br />
derived on the basis of historical default rates at the portfolio<br />
level, any decline in the overall volume of receivables results in<br />
a corresponding reduction of such provisions (and vice versa).
176<br />
| DEUTSCHE BAHN GROUP<br />
NOTES TO THE INCOME STATEMENT<br />
With regard to the special effects shown in the following tables,<br />
please refer to the section “Special items in internal reporting.”<br />
(1) Revenues<br />
[ € million ] <strong>2010</strong> 2009<br />
Revenues from services and sale of goods 34,410 29,335<br />
thereof concession fees for rail transport 4,370 4,489<br />
TOTAL 34,410 29,335<br />
– Special items – –<br />
– Effects scope of consolidation –1,286 –<br />
– Effects exchange rates –668 –<br />
TOTAL COMPARABLE 32,456 29,335<br />
Revenues are € 5,075 million higher than the corresponding<br />
previous year figure (+17.3 %). This increase is mainly attributable<br />
to the positive economic development in the year under review<br />
and also the initial consolidation of DB Arriva. The main growth<br />
in revenues has been reported by the segments DB Schenker Rail<br />
and DB Schenker Logistics. Even when adjusted by the major<br />
effects from changes in the scope of consolidation, and in particular<br />
the contributions to revenues made by the acquired DB<br />
Arriva and the full-year integration of DB Schenker Rail Polska,<br />
the increase is still 13.2 % compared with the previous year.<br />
Concession fees for rail transport have declined slightly compared<br />
with the previous year; these revenues consist almost exclusively<br />
of payments from performance-based transport contracts with<br />
the Federal states. The revenues include positive currency effects<br />
of € 668 million, mainly relating to the segment DB Schenker<br />
Logistics.<br />
Movements in revenues broken down according to business<br />
segments and regions are set out in segment reporting.<br />
(2) Inventory changes and internally produced and capitalized assets<br />
[ € million ] <strong>2010</strong> 2009<br />
Inventory changes 26 16<br />
Internally produced and capitalized assets 2,181 1,920<br />
TOTAL 2,207 1,936<br />
Own investments relate mainly to construction and project<br />
business in rail infrastructure and also the modernization of<br />
rolling stock as well as the processing of appropriate spare parts.
| CONSOLIDATED FINANCIAL STATEMENTS<br />
| Notes<br />
177<br />
(3) Other operating income<br />
[ € million ] <strong>2010</strong> 2009<br />
SERVICES FOR THIRD PARTIES AND SALES OF MATERIALS<br />
Income from maintenance and repairs 5 1<br />
Sale of materials and energy 163 101<br />
Other third-party services 732 716<br />
900 818<br />
Leasing and rental income 184 181<br />
Income from claims for damages and compensation 80 99<br />
INCOME FROM FEDERAL GRANTS<br />
Federal compensation payments 77 79<br />
Other investment grants 36 41<br />
Other Federal grants 213 142<br />
326 262<br />
Income from the disposal of property, plant and equipment and intangible assets 168 594<br />
Income from the disposal of non-current financial instruments 15 0<br />
Income from the release of provisions 812 1,038<br />
Income from the reversal of negative differences 0 0<br />
OTHER INCOME<br />
Income from third parties fees 30 25<br />
Income from remediation of ecological burdens 44 66<br />
Miscellaneous other income 561 781<br />
635 872<br />
TOTAL 3,120 3,864<br />
– Special items –484 –1,537<br />
– Effects scope of consolidation – 66 –<br />
– Effects exchange rates –12 –<br />
TOTAL COMPARABLE 2,558 2,327<br />
Other third party services also include maintenance work performed<br />
on rolling stock owned by third parties (€ 119 million;<br />
previous year: € 110 million).<br />
The decline in income from the disposal of property, plant<br />
and equipment and intangible assets compared with the previous<br />
year and also the lower miscellaneous other income are mainly<br />
attributable to the fact that the one-off effect of the realization<br />
of the property sale in connection with Stuttgart 21 in the previous<br />
year was not repeated.<br />
In the previous year, part of the provision for ecological<br />
legacy issues was reversed (€ 600 million). Because this one-off<br />
effect has not been repeated, there has been a decline in income<br />
from the reversal of provisions, although this was opposed in<br />
the year under review by partial reversals of personnel provisions.<br />
The increase in income from government grants was due to the<br />
economic stimulus programs I and II. In addition, this income<br />
mainly comprises settlement payments made by central, regional<br />
and local authorities in connection with the Railroad Crossing<br />
Act (Eisenbahnkreuzungsgesetz; EkrG), the Municipal Traffic<br />
Financing Act (Gemeindeverkehrsfinanzierungsgesetz; GVFG)<br />
as well as compensation payments for level crossings in accordance<br />
with an EU ordinance.
178<br />
| DEUTSCHE BAHN GROUP<br />
(4) Cost of materials<br />
(5) Personnel expenses and employees<br />
[ € million ] <strong>2010</strong> 2009<br />
COSTS OF RAW MATERIALS,<br />
CONSUMABLES AND SUPPLIES<br />
Energy costs<br />
Electricity 1,494 1,307<br />
Electricity tax 174 166<br />
Diesel, other fuel 958 789<br />
Other energies 147 115<br />
2,773 2,377<br />
Other supplies and purchased goods 364 333<br />
Price and value adjustment<br />
to materials –46 –35<br />
COSTS OF PURCHASED SERVICES<br />
3,091 2,675<br />
Purchased transport services 10,942 8,308<br />
Cleaning, security, disposal,<br />
snow and ice control 267 230<br />
Provisions 144 130<br />
Infrastructure usage expenses<br />
Train-path usage 191 128<br />
Station usage 9 1<br />
200 129<br />
Other purchased services 724 569<br />
12,277 9,366<br />
Maintenance expenses 3,946 3,586<br />
TOTAL 19,314 15,627<br />
– Special items –180 –332<br />
– Effects scope of consolidation –509 –<br />
– Effects exchange rates –468 –<br />
TOTAL COMPARABLE 18,157 15,295<br />
The increase in purchased transport services compared with the<br />
previous year is mainly attributable to the higher levels of activity<br />
in the segment DB Schenker Logistics. There has also been an<br />
increase resulting from changes in the scope of consolidation<br />
as well as positive exchange rate effects.<br />
[ € million ] <strong>2010</strong> 2009<br />
W<strong>AG</strong>ES AND SALARIES<br />
Employees 8,051 7,335<br />
Civil servants assigned 1,371 1,403<br />
9,422 8,738<br />
SOCIAL SECURITY EXPENSES<br />
Employees 1,511 1,382<br />
Civil servants assigned 282 281<br />
Costs of adjusting staffing levels 226 555<br />
Retirement benefit expenses 161 159<br />
2,180 2,377<br />
TOTAL 11,602 11,115<br />
– Special items –19 –467<br />
– Effects scope of consolidation –509 –<br />
– Effects exchange rates –107 –<br />
TOTAL COMPARABLE 10,967 10,648<br />
The figure stated for personnel expenses includes expense of<br />
€ 744 million for defined contribution plans (previous year:<br />
€ 684 million).<br />
The amount shown for adjusting staffing levels mainly<br />
comprises costs of severance payment agreements and semiretirement<br />
agreements and restructuring costs. The decline is<br />
mainly attributable to the much more positive macroeconomic<br />
environment and (an associated factor) the higher volume of<br />
output and lower impairment requirement.<br />
The retirement benefit expenses relate to active persons<br />
as well as persons who are no longer employed in DB Group or<br />
their surviving dependants. They are attributable primarily to<br />
service costs, employers’ contributions to the company top-up<br />
benefit scheme as well as the contributions to Pensions-Sicherungs-Verein<br />
aG (pension insurance association). The interest<br />
expense resulting from compounding the pension obligations<br />
and the expected income from plan assets is shown in financial<br />
result. For detailed explanations regarding the development of<br />
pension obligations, please refer to the Notes under (32).<br />
The activities of the civil servants in DB Group are based on<br />
statutory allocation within the framework of the German Rail<br />
Restructuring Act (Eisenbahnneuordnungsgesetz; ENeuOG), Art.<br />
2 §12. For the work of the allocated civil servants, DB <strong>AG</strong> reimburses<br />
to the Federal Railroad Fund (Bundeseisenbahnvermögen; BEV)<br />
those costs which would be incurred if an employee covered by<br />
collective bargaining arrangements were to be employed instead<br />
of the allocated civil servant (pro forma calculation).
| CONSOLIDATED FINANCIAL STATEMENTS<br />
| Notes<br />
179<br />
The development in wages and salaries mainly reflects the acquisitions<br />
in the year under review (in particular Arriva). In addition,<br />
the domestic companies have felt the impact of the agreements<br />
arising from the wage settlement in the previous year (in relation<br />
to the reporting year) and the one-off payment in connection<br />
with the wage-bargaining negotiations in <strong>2010</strong>. The companies<br />
outside Germany have mainly felt the impact of exchange rate<br />
fluctuations.<br />
The development in the number of employees in DB Group,<br />
converted to full-time employees in each case, is shown in the<br />
following:<br />
[ FTE ] At year end Average for the year<br />
<strong>2010</strong> 2009 <strong>2010</strong> 2009<br />
Employees 241,525 203,062 216,245 202,972<br />
Civil servants 34,785 36,320 35,565 36,916<br />
SUBTOTAL 276,310 239,382 251,810 239,888<br />
Trainees 9,667 9,259 8,515 8,109<br />
TOTAL 285,977 248,641 260,325 247,997<br />
In the event of changes in the scope of consolidation, the<br />
employees are included on a pro rata basis up to the time of<br />
deconsolidation or after the date of initial consolidation.<br />
Adjusted by the number of employees of Arriva which was<br />
acquired in the year under review, there are 239,856 full-time<br />
employees (239,635 on an annual average basis).<br />
The development in the number of employees, based on<br />
the number of natural persons, is shown in the following:<br />
[ Natural persons ] At year end<br />
2009<br />
Employees 253,479 213,394<br />
Civil servants 36,616 38,199<br />
SUBTOTAL 290,095 251,593<br />
Trainees 9,667 9,259<br />
TOTAL 299,762 260,852<br />
(6) Depreciation<br />
Depreciation relates mainly to the property, plant and equipment<br />
used as rail infrastructure as well as the rolling stock. It is shown<br />
in the income statement less any recovery in amounts written<br />
down in the year under review.<br />
For further explanations, please refer to the details concerning<br />
the development in property, plant and equipment or<br />
intangible assets under Notes (13) and (14).<br />
The depreciation includes special effects attributable to adjustment<br />
(€ –127 million; previous year: € –108 million), effects<br />
attributable to changes in scope of consolidation (€ +95 million)<br />
and exchange rate changes (€ +11 million).
180<br />
| DEUTSCHE BAHN GROUP<br />
(7) Other operating expenses<br />
[ € million ] <strong>2010</strong> 2009<br />
RENTAL AND LEASING EXPENSES<br />
Operating lease expenses 1,241 1,100<br />
Conditional leasing expenses 5 6<br />
1,246 1,106<br />
Legal, consultancy and audit fees 182 139<br />
Contributions and fees 231 229<br />
Insurance expenses 173 169<br />
Sales promotion and advertising expenses 88 77<br />
Cost of printing and office supplies 79 75<br />
Travel and representation expenses 225 210<br />
Research and not capitalized development costs 8 7<br />
OTHER PURCHASED SERVICES<br />
IT services 165 147<br />
Other communication services 67 64<br />
Other services 388 254<br />
620 465<br />
Damages payable 90 67<br />
Impairments in receivables and other assets 1) 75 –7<br />
Loss from disposal of property, plant and equipment and intangible assets 184 129<br />
Expenses from disposal of non-current financial instruments 8 0<br />
Other operational taxes 79 0<br />
OTHER EXPENSES<br />
Grants for third-party facilities 77 82<br />
Other personnel-related expenses 108 78<br />
Miscellaneous other expenses 620 538<br />
Net of expenses and income consolidation –1 –4<br />
804 694<br />
TOTAL 4,092 3,360<br />
– Special items –207 –107<br />
– Effects scope of consolidation –201 –<br />
– Effects exchange rates –78 –<br />
TOTAL COMPARABLE 3,606 3,253<br />
1)<br />
Including payments for receivables written down in the previous year.<br />
Other operating expenses have increased compared with the<br />
previous year; this is mainly due to the increased level of operations<br />
in the segment DB Schenker Logistics as well as the<br />
first-time consolidation of DB Arriva.<br />
The legal, consultancy and audit fees comprise fees of<br />
€ 20.8 million for the auditor of the consolidated financial<br />
statements (previous year: € 21.9 million); this figure comprises<br />
auditing services of € 11.0 million (previous year: € 10.9 million),<br />
other certification services of € 3.7 million (previous year:<br />
€ 4.1 million), tax advice services of € 0.3 million (previous<br />
year: € 0.3 million) as well as other services of € 5.8 million<br />
(previous year: € 6.6 million).<br />
The increase in the allowances recognized in relation to<br />
receivables and other assets is attributable to allowances which<br />
were reversed in the previous year. In the year under review, the<br />
increase in expenses for other operating taxes is essentially<br />
attributable to the reversal of provisions in the previous year.
| CONSOLIDATED FINANCIAL STATEMENTS<br />
| Notes<br />
181<br />
(8) Result from investments accounted<br />
for using the equity method<br />
The following contributions to earnings are recognized in the<br />
income statement as a result of shares in companies over which<br />
significant influence can be exercised or which are managed as<br />
joint ventures:<br />
[ € million ] <strong>2010</strong> 2009<br />
JOINT VENTURES<br />
Other 0 –2<br />
0 –2<br />
ASSOCIATED COMPANIES<br />
METRANS a.s. 8 6<br />
EUROFIMA 8 8<br />
Other 1 –3<br />
17 11<br />
TOTAL 17 9<br />
(9) Net interest income<br />
[ € million ] <strong>2010</strong> 2009<br />
INTEREST INCOME<br />
Other interest and similar income 132 94<br />
Income from securities 0 0<br />
Interest accrued and other interest income 182 251<br />
314 345<br />
INTEREST EXPENSES<br />
Other interest and similar expenses –708 –642<br />
Interest accrued on non-current provisions and liabilities –294 – 339<br />
Interest accrued on retirement benefit obligations –152 –121<br />
Interest expense of finance lease –71 –69<br />
–1,225 –1,171<br />
TOTAL –911 –826<br />
The increase in other interest and similar expenses is mainly<br />
attributable to the financing costs for the acquisition of Arriva<br />
as well as the absorbed bank borrowings of Arriva.<br />
The decline in interest income from the reversal of deferred<br />
income and other interest income is attributable to one-off income<br />
which was included in the previous year as a result of the adjustment<br />
of the terms of the environmental protection provisions.<br />
The interest income and expenses from the financial assets and<br />
liabilities not measured at fair value through profit or loss amount<br />
to € 54 million (previous year: € 38 million) and € –884 million<br />
respectively (previous year: € –821 million).
182<br />
| DEUTSCHE BAHN GROUP<br />
(10) Other financial result<br />
[ € million ] <strong>2010</strong> 2009<br />
Result from equity investments 1 2<br />
Result from currency exchange gains –221 121<br />
Result from foreign exchange-based derivative contracts 200 –96<br />
Result of other derivatives –3 2<br />
Result from disposal of financial instruments 1 0<br />
Impairments on financial instruments 0 –33<br />
Miscellaneous financial result –1 0<br />
TOTAL –23 –4<br />
The result from exchange rate effects is attributable to the<br />
conversion of foreign currency liabilities or receivables with an<br />
impact on the income statement using the spot rate applicable<br />
on the reference date (IAS 21). The result from exchange rate<br />
effects theoretically has to be netted with the result from currency-related<br />
derivatives. Both parameters have changed appreciably<br />
compared with the previous year figure due to significant<br />
exchange rate fluctuations of the euro particularly with regard<br />
to the Japanese yen and the Swiss franc and also the raising of<br />
new secured foreign currency bonds. The result from currencybased<br />
derivatives comprises the reclassification of currencyrelated<br />
changes in the market value of cash flow hedges<br />
recognized under shareholders’ equity with no impact on the<br />
income statement. The result from other derivatives relates to<br />
the development in the market value of derivatives which are<br />
not classified as effective hedges in accordance with IAS 39.<br />
(11) Taxes on income<br />
[ € million ] <strong>2010</strong> 2009<br />
Actual tax expense –127 –73<br />
Income due to lapsing of tax obligations 3 27<br />
ACTUAL TAXES ON INCOME EXPENSES –124 –46<br />
Deferred tax income 282 –511<br />
TOTAL 158 –557<br />
The actual tax expense has been incurred mainly at foreign<br />
subsidiaries. The increase compared with the previous year is<br />
mainly attributable to the lower income from actual taxes on<br />
income attributable to other periods and also the extension of<br />
the consolidation group.<br />
In the year under review, there was deferred tax income<br />
(previous year: deferred tax expense) resulting mainly from the<br />
updated medium-term planning, which indicates that tax results<br />
in the medium term will be higher than was indicated in the<br />
medium-term planning of the previous year.<br />
Starting with the net profit of DB Group before taxes on income<br />
and the theoretical taxes on income calculated using a Group<br />
tax rate of 30.5 %, the following reconciles the calculated taxes<br />
with the actual taxes on income:
| CONSOLIDATED FINANCIAL STATEMENTS<br />
| Notes<br />
183<br />
[ € million ] <strong>2010</strong> 2009<br />
Profit before taxes on income 900 1,387<br />
Group tax rate 30.5 % 30.5 %<br />
EXPECTED TAX EXPENSE –275 –423<br />
Additional (previous year: reduced ) recognition as well as usage of<br />
existing temporary differences and losses carried forward 423 –206<br />
Income not subject to tax 16 18<br />
Tax effects related to IAS 12.33 102 108<br />
Expenses not deductible for tax purposes –32 –28<br />
Differences in tax rates of foreign companies 14 15<br />
Other effects – 90 –41<br />
TAXES ON INCOME AS REPORTED 158 –557<br />
Effective tax rate –17.6% 40.2 %<br />
The reconciliation amount as detailed in IAS 12.33 relates exclusively<br />
to additional tax write-downs resulting from the fact that<br />
tax-free grants in the IFRS financial statements have been<br />
deducted directly from the costs of purchasing the assets. It is<br />
not permissible for deferred taxes to be created in relation to<br />
these temporary differences.<br />
In the year under review, the other effects include in particular<br />
effects attributable to the difference in the assessment bases<br />
of different income tax bases, income taxes attributable to<br />
other periods and losses without the creation of deferred taxes.<br />
The actual income taxes attributable to other periods amount<br />
to € 1 million.<br />
(12) Earnings per share<br />
Under IAS 33 (Earnings per Share), undiluted earnings per share<br />
are calculated by dividing the net income of DB Group attributable<br />
to the shareholders of DB <strong>AG</strong> by the weighted average<br />
number of shares in issue during the year under review. Undiluted<br />
earnings per share correspond to diluted earnings per share.<br />
[ € million ] <strong>2010</strong> 2009<br />
Net profit for the year 1,058 830<br />
thereof attributable to minority interests 19 9<br />
thereof attributable to shareholders of DB <strong>AG</strong> 1,039 821<br />
Number of issued shares 430,000,000 430,000,000<br />
Earnings per share (€ /share), undiluted 2.42 1.91<br />
Earnings per share (€ /share), diluted 2.42 1.91
184<br />
| DEUTSCHE BAHN GROUP<br />
NOTES TO THE BALANCE SHEET<br />
(13) Property, plant and equipment<br />
Property, plant and<br />
equipment as of<br />
December 31, <strong>2010</strong><br />
[ € million ]<br />
Land<br />
Commercial,<br />
operating<br />
and other<br />
buildings<br />
Permanent<br />
way<br />
structures<br />
Track infrastructure,<br />
signaling<br />
and control<br />
equipment<br />
Rolling<br />
stock for<br />
passenger<br />
and freight<br />
transport<br />
Technical<br />
equipment<br />
and<br />
machinery<br />
Other<br />
equipment,<br />
operating<br />
and office<br />
equipment<br />
Advance<br />
payments<br />
and assets<br />
under construction<br />
COST OF PURCHASE<br />
AND COST OF<br />
PRODUCTION<br />
As of Jan 1, <strong>2010</strong> 4,404 5,512 12,574 15,182 21,579 1,554 3,489 3,531 67,825<br />
Changes in the scope<br />
of consolidation 69 302 0 0 1,894 37 184 19 2,505<br />
thereof additions 69 302 0 0 1,894 37 190 19 2,511<br />
thereof disposals 0 0 0 0 0 0 –6 0 –6<br />
Additions 1) 64 165 484 1,349 669 64 299 3,724 6,818<br />
Investment grants –2 – 45 – 401 –1,097 –20 – 8 –33 –3,212 –4,818<br />
Transfers 14 200 204 192 373 27 29 –1,040 –1<br />
Transfers related to<br />
assets held for sale 0 0 0 0 3 0 0 –3 0<br />
Disposals –71 –78 –12 –132 –366 –64 –296 53 –966<br />
Currency translation<br />
differences 10 61 2 0 9 8 34 3 127<br />
AS OF DEC 31, <strong>2010</strong> 4,488 6,117 12,851 15,494 24,141 1,618 3,706 3,075 71,490<br />
ACCUMULATED<br />
DEPRECIATION<br />
As of Jan 1, <strong>2010</strong> – 454 –2,045 – 3,633 – 8,800 –11,901 –1,024 –2,241 –288 –30,386<br />
Changes in the scope<br />
of consolidation –1 –86 0 0 –941 –22 –135 0 –1,185<br />
thereof additions –1 –86 0 0 –941 –22 –136 0 –1,186<br />
thereof disposals 0 0 0 0 0 0 1 0 1<br />
Depreciation –10 –189 –188 – 655 –1,201 – 92 –326 0 –2,661<br />
Impairments –126 –4 –5 –6 –14 –1 –3 0 –159<br />
Reversal of impairment<br />
losses 1 0 0 26 0 0 1 0 28<br />
Transfers 4 –4 –7 5 –3 –4 9 0 0<br />
Transfers related to<br />
assets held for sale 0 0 0 0 0 0 0 0 0<br />
Disposals 35 48 9 117 307 42 249 4 811<br />
Currency translation<br />
differences –2 –27 –1 0 –7 –4 –24 0 –65<br />
AS OF DEC 31, <strong>2010</strong> –553 –2,307 –3,825 –9,313 –13,760 –1,105 –2,470 –284 –33,617<br />
CARRYING AMOUNT<br />
DEC 31, <strong>2010</strong> 3,935 3,810 9,026 6,181 10,381 513 1,236 2,791 37,873<br />
Carrying amount<br />
Dec 31, 2009 3,950 3,467 8,941 6,382 9,678 530 1,248 3,243 37,439<br />
1)<br />
Including € 144 million for credit items from previous years.<br />
Total
| CONSOLIDATED FINANCIAL STATEMENTS<br />
| Notes<br />
185<br />
Property, plant and<br />
equipment as of<br />
December 31, 2009<br />
[ € million ]<br />
Land<br />
Commercial,<br />
operating<br />
and other<br />
buildings<br />
Permanent<br />
way<br />
structures<br />
Track infrastructure,<br />
signaling<br />
and control<br />
equipment<br />
Rolling<br />
stock for<br />
passenger<br />
and freight<br />
transport<br />
Technical<br />
equipment<br />
and<br />
machinery<br />
Other<br />
equipment,<br />
operating<br />
and office<br />
equipment<br />
Advance<br />
payments<br />
and assets<br />
under construction<br />
COST OF PURCHASE<br />
AND COST OF<br />
PRODUCTION<br />
As of Jan 1, 2009 4,330 5,419 12,435 14,739 20,588 1,448 3,471 3,725 66,155<br />
Changes in the scope<br />
of consolidation 16 32 3 11 198 28 18 5 311<br />
thereof additions 16 32 3 11 198 28 18 5 311<br />
thereof disposals 0 0 0 0 0 0 0 0 0<br />
Additions 1) 123 118 415 1,235 656 71 229 3,555 6,402<br />
Investment grants –12 – 54 – 397 –1,003 –14 –15 –29 – 3,124 –4,648<br />
Transfers 26 – 4 127 333 368 32 40 – 920 2<br />
Transfers related to<br />
assets held for sale 0 0 0 0 4 0 0 – 4 0<br />
Disposals –86 –35 –13 –133 –260 –22 –252 268 –533<br />
Currency translation<br />
differences 7 36 4 0 39 12 12 26 136<br />
AS OF DEC 31, 2009 4,404 5,512 12,574 15,182 21,579 1,554 3,489 3,531 67,825<br />
ACCUMULATED<br />
DEPRECIATION<br />
As of Jan 1, 2009 – 384 –1,871 – 3,451 – 8,210 –10,848 – 925 –2,123 –277 –28,089<br />
Changes in the scope<br />
of consolidation –2 –10 –2 –10 –77 –15 –7 0 –123<br />
thereof additions –2 –10 –2 –10 –77 –15 –7 0 –123<br />
thereof disposals 0 0 0 0 0 0 0 0 0<br />
Depreciation –8 –184 –182 –678 –1,158 –93 –316 0 –2,619<br />
Impairments – 58 0 –1 – 51 –25 –3 –1 –12 –151<br />
Reversal of impairment<br />
losses 0 0 0 44 0 0 0 0 44<br />
Transfers –10 12 – 3 0 0 –1 2 –1 –1<br />
Transfers related to<br />
assets held for sale 0 0 0 0 0 0 0 0 0<br />
Disposals 8 24 8 105 231 20 212 2 610<br />
Currency translation<br />
differences 0 –16 –2 0 –24 –7 – 8 0 –57<br />
AS OF DEC 31, 2009 – 454 –2,045 –3,633 – 8,800 –11,901 –1,024 –2,241 –288 –30,386<br />
CARRYING AMOUNT<br />
DEC 31, 2009 3,950 3,467 8,941 6,382 9,678 530 1,248 3,243 37,439<br />
Carrying amount<br />
Dec 31, 2008 3,946 3,548 8,984 6,529 9,740 523 1,348 3,448 38,066<br />
1)<br />
Including € 129 million for credit items from previous years.<br />
Total
186<br />
| DEUTSCHE BAHN GROUP<br />
Impairments of € 159 million (previous year: € 151 million) mainly<br />
relate to real estate, track and bridges of DB Netz <strong>AG</strong> as well as<br />
rolling stock of DB Regio <strong>AG</strong>, DB Schenker Rail Deutschland <strong>AG</strong><br />
and DB Regio NRW GmbH.<br />
Reversals of impairments relating mainly to track of DB Netz<br />
<strong>AG</strong> amounted to € 28 million (previous year: € 44 million).<br />
The positive book value disposals of € 57 million (previous<br />
year: € 270 million) relating to work in progress are attributable<br />
to the repayment of investment grants received and shown as<br />
assets in previous years.<br />
Financial debt was backed by tangible assets with carrying<br />
amounts of € 196 million (previous year: € 131 million). This<br />
relates primarily to rolling stock which is used for securing loans,<br />
mainly of EUROFIMA (European Company for the Financing of<br />
Railroad Rolling Stock), Basel /Switzerland, and which is used<br />
at DB <strong>Bahn</strong> Long-Distance, DB <strong>Bahn</strong> Regional and DB Schenker<br />
Rail. Restrictions to rights of disposal in relation to property,<br />
plant and equipment existed to the extent of € 58 million (previous<br />
year: € 24 million) mainly at SüdbadenBus GmbH, Regional<br />
Bus Stuttgart GmbH and S.A.B. Autoservizi S.R.L., Bergamo/<br />
Italy.<br />
Property, plant and equipment includes leased assets which<br />
are shown separately in the following overview. The leased<br />
property, plant and equipment comprises assets which are<br />
substantially but not legally owned by DB Group, so that the<br />
under lying lease agreements have to be classified as finance<br />
leases.<br />
Leased assets [ € million ] Land Commercial,<br />
Permanent<br />
Track infra-<br />
Rolling<br />
Technical<br />
Other<br />
Total<br />
operating<br />
way<br />
structure,<br />
stock for<br />
equipment<br />
equipment,<br />
and other<br />
structures<br />
signaling<br />
passenger<br />
and<br />
operating<br />
buildings<br />
and control<br />
and freight<br />
machinery<br />
and office<br />
equipment<br />
transport<br />
equipment<br />
ASSETS LEASED FROM<br />
THIRD PARTIES UNDER<br />
FINANCE LEASE<br />
Cost of purchase and cost<br />
of production 18 769 19 0 1,177 7 0 1,990<br />
Accumulated depreciation –1 –192 –2 0 –618 –3 0 –816<br />
CARRYING AMOUNT<br />
DEC 31, <strong>2010</strong> 17 577 17 0 559 4 0 1,174<br />
Cost of purchase and cost<br />
of production 6 750 19 0 979 8 0 1,762<br />
Accumulated depreciation 0 –173 –2 0 – 667 –2 0 –844<br />
CARRYING AMOUNT<br />
DEC 31, 2009 6 577 17 0 312 6 0 918
| CONSOLIDATED FINANCIAL STATEMENTS<br />
| Notes<br />
187<br />
The figure shown for the commercial, operating and other structures<br />
under leased fixed assets mainly relates to concourse<br />
buildings of DB Station & Service <strong>AG</strong>. The figure shown under<br />
rolling stock for passenger and freight transport relates mainly<br />
to rolling stock used by the transport companies of DB Group<br />
(locomotives, freight wagons, buses). The increase is mainly<br />
attributable to DB Arriva.<br />
The assets which are leased (as lessor) by way of an operating<br />
lease and which have been calculated on the basis of<br />
retrospective calculations and also on the basis of our own<br />
surveys report a residual carrying amount of € 1,073 million as<br />
of December 31, <strong>2010</strong> for land and buildings (previous year:<br />
€ 1,045 million) and a residual carrying amount of € 2,175 million<br />
(previous year: € 2,220 million) for mobile assets (mainly rolling<br />
stock). The increase in the residual carrying amount of real<br />
estate is mainly attributable to the modernization of rented<br />
properties. In the case of movable assets, the decline is mainly<br />
attributable to depreciation relating to passenger transport<br />
vehicles. Rental and leasing income resulting from the rental<br />
and leasing of these assets are expected to be received in future<br />
years as detailed in the following:<br />
Expected rental and leasing<br />
Residual maturity<br />
Total<br />
income [ € million ]<br />
Less than<br />
1–2<br />
2–3<br />
3 – 4<br />
4 – 5<br />
More than<br />
Total more<br />
1 year<br />
years<br />
years<br />
years<br />
years<br />
5 years<br />
than 1 year<br />
DEC 31, <strong>2010</strong><br />
Minimum lease payments 404 253 219 192 166 882 1,712 2,116<br />
DEC 31, 2009<br />
Minimum lease payments 387 256 212 189 167 969 1,793 2,180
188<br />
| DEUTSCHE BAHN GROUP<br />
(14) Intangible assets<br />
Intangible assets as of December 31, <strong>2010</strong><br />
Capitalized<br />
Capitalized<br />
Purchased<br />
Goodwill<br />
Payments made<br />
Total<br />
[ € million ]<br />
development<br />
development<br />
intangible<br />
on account<br />
costs – products<br />
costs – products<br />
assets<br />
currently in use<br />
under<br />
development<br />
COST OF PURCHASE AND<br />
COST OF PRODUCTION<br />
As of Jan 1, <strong>2010</strong> 44 18 1,163 1,488 43 2,756<br />
Changes in the scope of consolidation 0 0 741 1,388 0 2,129<br />
thereof additions 0 0 741 1,389 0 2,130<br />
thereof disposals 0 0 0 –1 0 –1<br />
Additions 0 27 45 0 1 73<br />
Investment grants 0 0 –1 0 0 –1<br />
Transfers 0 39 5 0 –43 1<br />
Transfers related to assets held for sale 0 0 0 0 0 0<br />
Disposals –14 0 –51 0 0 –65<br />
Currency translation differences 0 2 4 55 0 61<br />
AS OF DEC 31, <strong>2010</strong> 30 86 1,906 2,931 1 4,954<br />
ACCUMULATED DEPRECIATION<br />
As of Jan 1, <strong>2010</strong> –40 0 –625 –21 0 –686<br />
Changes in the scope of consolidation 0 0 –40 2 0 –38<br />
thereof additions 0 0 –40 0 0 –40<br />
thereof disposals 0 0 0 2 0 2<br />
Depreciation –2 0 –118 0 0 –120<br />
Impairments 0 0 0 0 0 0<br />
Reversal of impairment losses 0 0 0 0 0 0<br />
Transfers 0 0 0 0 0 0<br />
Transfers related to assets held for sale 0 0 0 0 0 0<br />
Disposals 14 0 41 0 0 55<br />
Currency translation differences 0 0 –10 –1 0 –11<br />
AS OF DEC 31, <strong>2010</strong> –28 0 –752 –20 0 –800<br />
CARRYING AMOUNT DEC 31, <strong>2010</strong> 2 86 1,154 2,911 1 4,154<br />
Carrying amount Dec 31, 2009 4 18 538 1,467 43 2,070
| CONSOLIDATED FINANCIAL STATEMENTS<br />
| Notes<br />
189<br />
Intangible assets as of December 31, 2009<br />
Capitalized<br />
Capitalized<br />
Purchased<br />
Goodwill<br />
Payments made<br />
Total<br />
[ € million ]<br />
development<br />
development<br />
intangible<br />
on account<br />
costs – products<br />
costs – products<br />
assets<br />
currently in use<br />
under<br />
development<br />
COST OF PURCHASE AND<br />
COST OF PRODUCTION<br />
As of Jan 1, 2009 47 11 1,097 1,338 30 2,523<br />
Changes in the scope of consolidation 0 0 54 128 0 182<br />
thereof additions 0 0 54 128 0 182<br />
thereof disposals 0 0 0 0 0 0<br />
Additions 1 8 38 9 13 69<br />
Investment grants 0 0 –1 0 0 –1<br />
Transfers – 4 –1 4 0 0 –1<br />
Transfers related to assets held for sale 0 0 0 0 0 0<br />
Disposals 0 0 – 33 –1 0 –34<br />
Currency translation differences 0 0 4 14 0 18<br />
AS OF DEC 31, 2009 44 18 1,163 1,488 43 2,756<br />
ACCUMULATED DEPRECIATION<br />
As of Jan 1, 2009 – 43 0 – 550 –20 0 –613<br />
Changes in the scope of consolidation 0 0 –2 0 0 –2<br />
thereof additions 0 0 –2 0 0 –2<br />
thereof disposals 0 0 0 0 0 0<br />
Depreciation – 4 0 – 95 0 0 –99<br />
Impairments 0 0 0 0 0 0<br />
Reversal of impairment losses 0 0 0 0 0 0<br />
Transfers 7 0 –7 0 0 0<br />
Transfers related to assets held for sale 0 0 0 0 0 0<br />
Disposals 0 0 29 0 0 29<br />
Currency translation differences 0 0 0 –1 0 –1<br />
AS OF DEC 31, 2009 –40 0 –625 –21 0 –686<br />
CARRYING AMOUNT DEC 31, 2009 4 18 538 1,467 43 2,070<br />
Carrying amount Dec 31, 2008 4 11 547 1,318 30 1,910<br />
Segment reporting shows the allocation of reported goodwill<br />
to the various segments.
190<br />
| DEUTSCHE BAHN GROUP<br />
(15) Investments accounted for using the equity method<br />
[ € million ] <strong>2010</strong> 2009<br />
As of Jan 1 369 355<br />
Additions 103 5<br />
Disposals from divestitures 0 0<br />
Group share of profit 17 9<br />
Capital increase 0 2<br />
Other movements in capital 0 10<br />
Dividends received –5 –8<br />
Impairments 0 0<br />
Transfers –2 –7<br />
Currency translation differences 45 3<br />
Other valuations 1 0<br />
AS OF DEC 31 528 369<br />
The figure shown in the balance sheet as of December 31,<br />
<strong>2010</strong> refers to goodwill of € 43 million (previous year: € 15 million)<br />
and is mainly attributable to the shares held in the associated<br />
companies EUROFIMA, METRANS a.s., Prague/Czech Republic,<br />
BLS Cargo <strong>AG</strong>, Bern/Switzerland and Barraqueiro SGPS SA,<br />
Lisbon/Portugal. The negotiability of the shares in EUROFIMA<br />
is limited.<br />
(16) Deferred tax assets<br />
[ € million ] <strong>2010</strong> 2009<br />
Deferred tax assets in respect of temporary differences 529 433<br />
Deferred tax assets in respect of tax losses carried forward 942 740<br />
TOTAL 1,471 1,173<br />
No deferred tax assets have been created in relation to the<br />
following losses carried forward and temporary differences:<br />
[ € million ] <strong>2010</strong> 2009<br />
Tax loss carry-forwards for which no deferred tax asset has been created 13,482 14,323<br />
Temporary differences for which no deferred tax asset has been created 5,295 5,918<br />
Temporary differences for which IAS 12.24b in conjunction with 12.33 prohibits recognition of a deferred tax asset 4,389 4,764<br />
TOTAL 23,166 25,005<br />
The losses carried forward are mainly attributable to the tax<br />
law treatment of Federal Government grants paid in previous<br />
years to DB <strong>AG</strong> in accordance with section 21 (5) and section<br />
22 (1) <strong>Deutsche</strong> <strong>Bahn</strong> Foundation Act (<strong>Deutsche</strong> <strong>Bahn</strong> Gründungsgesetz;<br />
DBGrG) as a contribution.<br />
On the basis of current laws, the domestic losses carried<br />
forward are fully allowable in accordance with current legislation<br />
(in terms of the actual amount and also the reason for being<br />
allowable).<br />
The temporary differences which are not permitted to be recognized<br />
in accordance with IAS 12.24b in conjunction with<br />
12.33 relate exclusively to additional tax depreciation from<br />
previously received tax-free investment grants.
| CONSOLIDATED FINANCIAL STATEMENTS<br />
| Notes<br />
191<br />
The following deferred tax assets and deferred tax liabilities<br />
shown in the balance sheet are not applicable in relation to<br />
statement and valuation differences for the individual balance<br />
sheet items and tax losses carried forward:<br />
[ € million ] Deferred tax assets Deferred tax liabilities<br />
<strong>2010</strong> 2009 <strong>2010</strong> 2009<br />
NON-CURRENT ASSETS<br />
Property, plant and equipment 67 16 217 120<br />
Intangible assets 3 1 207 37<br />
Investments accounted for using the equity method 1 0 28 9<br />
Real estate held as financial asset 12 1 1 8<br />
Other financial assets 0 1 2 2<br />
CURRENT ASSETS<br />
Trade receivables 21 14 1 1<br />
Other financial assets 4 5 1 0<br />
Assets held for sale 0 1 3 0<br />
NON-CURRENT LIABILITIES<br />
Financial debt 96 97 3 1<br />
Other liabilities 16 0 0 1<br />
Derivative financial instruments 0 10 24 0<br />
Retirement benefit obligations 57 12 4 3<br />
Other provisions 188 124 2 3<br />
CURRENT LIABILITIES<br />
Financial debt 30 33 0 2<br />
Trade liabilities 0 9 0 1<br />
Other liabilities 26 26 8 3<br />
Derivative financial instruments 0 14 0 0<br />
Other provisions 138 86 6 2<br />
Losses carried forward 942 740 0 0<br />
SUBTOTAL 1,601 1,190 507 193<br />
Offsetting 1) –130 –17 –130 –17<br />
AMOUNT STATED IN THE BALANCE SHEET 1,471 1,173 377 176<br />
1)<br />
To the extent permitted by IAS 12 (Income Taxes).<br />
Tax assets and liabilities are netted if they exist in relation to<br />
the same tax authority, if they are of identical maturity and if<br />
they relate to the same tax subject. The increase in deferred tax<br />
assets is attributable to the expected increased utilization of<br />
the tax loss carry-forwards in the medium-term planning period<br />
as well as additions to the scope of consolidation. The increase<br />
in the deferred tax liabilities is essentially attributable to additions<br />
to the scope of consolidation.<br />
Deferred tax assets of € 0 million (previous year: € 24 million)<br />
shown directly in equity and deferred tax liabilities of € 11 million<br />
(previous year: € 1 million) are included in the deferred taxes<br />
shown in the balance sheet.
192<br />
| DEUTSCHE BAHN GROUP<br />
(17) Available-for-sale financial assets<br />
[ € million ] Investments in subsidiaries Other investments Securities Total<br />
<strong>2010</strong> 2009 <strong>2010</strong> 2009 <strong>2010</strong> 2009 <strong>2010</strong> 2009<br />
As of Jan 1 1 2 32 55 5 8 38 65<br />
Currency translation differences 0 0 0 1 0 0 0 1<br />
Changes in the scope of<br />
consolidation 0 –1 30 3 0 0 30 2<br />
Additions 0 0 0 0 0 0 0 0<br />
Disposals through sale 0 0 –11 0 0 0 –11 0<br />
Other disposals 0 0 0 0 0 0 0 0<br />
Fair value changes 1) 0 0 10 4 0 0 10 4<br />
Reclassifications 0 0 –2 2 0 0 –2 2<br />
Impairment losses 0 0 0 –33 0 0 0 –33<br />
Other 1) –1 0 0 0 0 –3 –1 –3<br />
AS OF DEC 31 0 1 59 32 5 5 64 38<br />
Non-current amount 0 1 59 32 4 4 63 37<br />
Current amount 0 0 0 0 1 1 1 1<br />
1)<br />
Other investments figure from previous year adjusted.<br />
(18) Inventories<br />
[ € million ] <strong>2010</strong> 2009<br />
Raw materials, consumables and supplies 974 897<br />
Unfinished products, work in progress 193 165<br />
Finished products and goods 44 36<br />
Advance payments 18 13<br />
Impairments –313 –297<br />
TOTAL 916 814
| CONSOLIDATED FINANCIAL STATEMENTS<br />
| Notes<br />
193<br />
(19) Receivables and other assets<br />
[ € million ] Trade<br />
Receivables<br />
Advance<br />
Other<br />
Total<br />
receivables<br />
from financing<br />
payments<br />
assets<br />
DEC 31, <strong>2010</strong><br />
Gross value 4,166 142 199 663 5,170<br />
Impairments –250 –3 0 –38 –291<br />
NET VALUE 3,916 139 199 625 4,879<br />
thereof due from related parties 41 4 0 88 133<br />
DEC 31, 2009<br />
Gross value 3,291 38 99 544 3,972<br />
Impairments –209 – 9 0 –36 –254<br />
NET VALUE 3,082 29 99 508 3,718<br />
thereof due from related parties 47 2 0 93 142<br />
The financing receivables include receivables of € 57 million due<br />
from Arriva Deutschland.<br />
The impairments for the financial instruments classified in accordance<br />
with IFRS 7 have developed as follows (IFRS 7.16):<br />
[ € million ] Trade Receivables<br />
Other<br />
Total<br />
receivables from financing<br />
assets<br />
As of Jan 1, <strong>2010</strong> –209 – 9 – 36 –254<br />
Additions –60 0 – 3 – 63<br />
Release 29 0 2 31<br />
Amounts used 1 8 1 10<br />
Transfers to current assets 0 0 0 0<br />
Changes in the scope of consolidation –7 –2 0 – 9<br />
Currency translation differences –4 0 –2 – 6<br />
AS OF DEC 31, <strong>2010</strong> – 250 – 3 –38 –291<br />
As of Jan 1, 2009 –248 –9 –41 –298<br />
Additions –71 0 –3 –74<br />
Release 105 0 7 112<br />
Amounts used 12 0 2 14<br />
Transfers to current assets 0 0 0 0<br />
Changes in the scope of consolidation –7 0 –1 –8<br />
Currency translation differences 0 0 0 0<br />
AS OF DEC 31, 2009 –209 –9 –36 –254
194<br />
| DEUTSCHE BAHN GROUP<br />
Individual allowances are created in relation to receivables if<br />
there are objective indications of an impairment. In the case of<br />
identical receivables (portfolios of receivables) which cannot<br />
be identified as impaired individually, global allowances (based<br />
on experience) are recognized on the basis of the age structure<br />
of such receivables. Any impairments which are recognized are<br />
deducted from financial assets on the assets side of the balance<br />
sheet. Previous impairments are reversed if the reasons for the<br />
original impairments are no longer applicable.<br />
The total amount of allocations to impairments of € 63 million<br />
(previous year: € 74 million) consists of individual allowances<br />
of € 43 million (previous year: € 60 million) and global individual<br />
allowances of € 20 million (previous year: € 14 million).<br />
The reversals have recognized reductions of individual allowances<br />
of € 25 million (previous year: € 60 million) and reductions<br />
of global individual allowances of € 6 million (previous year:<br />
€ 52 million).<br />
Costs of € 49 million were incurred for the complete derecognition<br />
of receivables and other assets (previous year: € 32 million).<br />
Income of € 7 million was reported for amounts received in<br />
relation to previously derecognized receivables and other assets<br />
(previous year: € 10 million).<br />
The following overview shows the maturity structure of the<br />
receivables for the financial instruments classified in accordance<br />
with IFRS 7 and the advanced payments which have been made:<br />
[ € million ] Residual maturity Total<br />
Less than<br />
1 year<br />
1–2<br />
years<br />
2–3<br />
years<br />
3 – 4<br />
years<br />
4 – 5<br />
years<br />
More than<br />
5 years<br />
Total more<br />
than 1 year<br />
AS OF DEC 31, <strong>2010</strong><br />
Trade receivables 3,877 23 8 8 0 0 39 3,916<br />
Receivables from financing 107 4 4 6 16 2 32 139<br />
Advance payments 171 28 0 0 0 0 28 199<br />
Other assets 562 8 0 1 2 52 63 625<br />
TOTAL 4,717 63 12 15 18 54 162 4,879<br />
AS OF DEC 31, 2009<br />
Trade receivables 3,030 19 18 8 7 0 52 3,082<br />
Receivables from financing 0 1 2 6 2 18 29 29<br />
Advance payments 74 25 0 0 0 0 25 99<br />
Other assets 430 6 1 0 0 71 78 508<br />
TOTAL 3,534 51 21 14 9 89 184 3,718<br />
The increase in trade receivables is mainly attributable to the<br />
DB Schenker Logistics segment.<br />
As a result of the large number of customers in the various<br />
operating segments, there is no evidence of any concentration<br />
of credit risks with trade receivables.<br />
The fair values of the receivables and other assets are to a large<br />
extent equivalent to the carrying amounts.<br />
The maximum default risk is essentially equivalent to the<br />
carrying amount in each case. No collateral is normally held.
| CONSOLIDATED FINANCIAL STATEMENTS<br />
| Notes<br />
195<br />
The gross amounts of the individually adjusted receivables as<br />
well as the age structure in accordance with IFRS 7.37a are shown<br />
in the following:<br />
[ € million ] Gross value<br />
adjusted<br />
AS OF DEC 31, <strong>2010</strong><br />
Neither<br />
written<br />
down nor<br />
overdue<br />
Not value adjusted and overdue within the following period of time (days)<br />
Less than 29 30–59 60–89 90–179 180–359 More than<br />
359<br />
Trade receivables 247 2,807 711 166 72 68 33 62<br />
Receivables from financing 4 137 1 0 0 0 0 0<br />
Other assets 38 265 48 8 2 9 5 21<br />
TOTAL 289 3,209 760 174 74 77 38 83<br />
AS OF DEC 31, 2009<br />
Trade receivables 213 2,178 621 134 51 43 23 28<br />
Receivables from financing 13 25 0 0 0 0 0 0<br />
Other assets 33 236 29 3 3 5 8 12<br />
TOTAL 259 2,439 650 137 54 48 31 40<br />
As of the balance sheet date, there are no indications that debtors<br />
of the receivables which are neither impaired nor overdue will<br />
not meet their payment obligations.<br />
(20) Income tax receivables<br />
The income tax receivables mainly relate to advance payments<br />
which have been made as well as allowable withholding taxes.<br />
(21) Derivative financial instruments<br />
The volume of hedges which have been taken out is shown in<br />
the following overview of nominal values:<br />
[ € million ] <strong>2010</strong> 2009<br />
INTEREST-BASED CONTRACTS<br />
Interest swaps 168 7<br />
168 7<br />
CURRENCY-BASED CONTRACTS<br />
Currency swaps 1,252 838<br />
Currency-forward /future contracts 552 437<br />
Interest-currency swaps 3,448 2,060<br />
5,252 3,335<br />
[Volume] <strong>2010</strong> 2009<br />
OTHER CONTRACTS<br />
Diesel (1,000 tons) 1,269 525<br />
HSL (1,000 tons) 173 162<br />
Hard coal (1,000 tons of a coal equivalent (“MTCE”)) 949 1,603<br />
USD forward contracts for procurement of diesel fuel (USD million) 0 32
196<br />
| DEUTSCHE BAHN GROUP<br />
The volume of interest rate swaps has increased to € 168 million<br />
as a result of transferred operations of Arriva. The nominal value<br />
of the interest-currency swaps has increased considerably by<br />
€ 1,388 million to € 3,448 million. This was due to the hedging<br />
of foreign currency bond issues and the issuing of internal foreign<br />
currency loans.<br />
The portfolio of foreign currency swaps has increased by<br />
€ 414 million to € 1,252 million. In addition to increasing levels<br />
of international business following the purchase of Arriva, this<br />
is due to a restructuring of our activities in Sweden which resulted<br />
in an increase in the SEK credit balances which have been translated<br />
into euros. The volume of currency forwards increased to<br />
€ 552 million as a result of the hedging of foreign exchange<br />
holdings which had previously been changed into euros.<br />
The volume of diesel price hedging increased considerably by<br />
0.7 million tons to 1.3 million tons due to transferred legacy business<br />
of Arriva. The pure currency hedging for diesel procurement<br />
has expired. The volume of coal price hedging declined to approximately<br />
0.9 million tons, because some legacy transactions expired.<br />
Hedging for heavy fuel oil was roughly unchanged compared with<br />
the previous year.<br />
All derivative financial instruments are marked-to-market<br />
on the reporting date. The following overview shows the structure<br />
of the item stated in the balance sheet depending on the<br />
type of underlying hedge:<br />
[ € million ] Assets Liabilities<br />
<strong>2010</strong> 2009 <strong>2010</strong> 2009<br />
INTEREST-BASED CONTRACTS<br />
Interest swaps 0 0 12 0<br />
Interest forward /future contracts 0 0 0 0<br />
Other interest derivatives 0 0 0 0<br />
0 0 12 0<br />
CURRENCY-BASED CONTRACTS<br />
Currency swaps 8 13 10 7<br />
Currency forward /future contracts 2 5 5 4<br />
Other currency derivatives 0 0 0 0<br />
Interest-currency swaps 210 29 132 140<br />
220 47 147 151<br />
OTHER CONTRACTS<br />
Energy price derivatives 155 15 21 97<br />
155 15 21 97<br />
TOTAL 375 62 180 248<br />
Interest-based contracts 0 0 12 0<br />
Currency-based contracts 167 28 74 142<br />
Other contracts 112 8 2 38<br />
NON-CURRENT PORTION 279 36 88 180<br />
Current portion 96 26 92 68
| CONSOLIDATED FINANCIAL STATEMENTS<br />
| Notes<br />
197<br />
CASH FLOW HEDGES<br />
In order to minimize the interest rate and exchange rate risk,<br />
foreign currency issues as well as internal foreign currency loans<br />
are translated into euros, and floating-rate financial liabilities<br />
are generally converted into fixed-income financial liabilities.<br />
Energy price hedging is intended to reduce price fluctuations<br />
attributable to energy sourcing.<br />
The negative valuation of the interest rate swaps is due to<br />
a decline in the level of interest rates since the transactions were<br />
concluded. The weakening of the euro particularly against the<br />
Japanese yen and the Swiss franc has resulted in a considerable<br />
increase in assets in the form of interest-currency swaps.<br />
The development in the value of the currency swaps is attributable<br />
to the weakening of the euro mainly against the Swedish<br />
krona and also a brief strengthening of the euro against sterling<br />
in December.<br />
The increase in assets in the form of energy derivatives is<br />
attributable to the high level of oil prices at the end of the year.<br />
The market values of the cash flow hedges are shown as<br />
follows under assets and liabilities:<br />
[ € million ] Assets Liabilities<br />
<strong>2010</strong> 2009 <strong>2010</strong> 2009<br />
INTEREST-BASED CONTRACTS<br />
Interest swaps 0 0 12 0<br />
0 0 12 0<br />
CURRENCY-BASED CONTRACTS<br />
Currency swaps 8 13 10 7<br />
Currency forward /future contracts 0 0 0 0<br />
Interest-currency swaps 210 29 132 140<br />
218 42 142 147<br />
OTHER CONTRACTS<br />
Energy price derivatives 155 15 21 97<br />
155 15 21 97<br />
TOTAL 373 57 175 244<br />
Interest-based contracts 0 0 12 0<br />
Currency-based contracts 167 28 74 140<br />
Other contracts 112 8 2 38<br />
NON-CURRENT PORTION 279 36 88 178<br />
Current portion 94 21 87 66
198<br />
| DEUTSCHE BAHN GROUP<br />
The following tables show the periods within which the hedged<br />
cash flows of the underlyings (interest and redemption payments<br />
as well as energy payments) will occur:<br />
Redemption – nominal value [ € million ] Due in<br />
2011 2012 2013 2014 2015 2016 ff.<br />
USD 1,466 20 – – – –<br />
GBP 258 1 1 1 1 3<br />
CHF 322 75 – – 6 750<br />
JPY 5,000 5,000 – 55,000 – 54,600<br />
HKD 109 250 – 250 – –<br />
NOK – – 180 – – –<br />
SEK 6,579 – 1,000 – 750 250<br />
DKK 1,122 50 50 43 43 60<br />
SGD 50 – 93 210 61 153<br />
NZD 3 23 – – – –<br />
CAD 45 – – – – –<br />
MXN 142 – – – – –<br />
PLN 217 200 218 216 – –<br />
SAR 6 – 13 – – –<br />
CZK 425 – – – – –<br />
Interest payments – nominal value [ € million ] Due in<br />
2011 2012 2013 2014 2015 2016 ff.<br />
USD 75 1 – – – –<br />
GBP 1 0 0 0 0 0<br />
CHF 15 16 13 13 13 66<br />
JPY 1,692 1,622 1,562 1,562 658 3,165<br />
HKD 27 24 13 6 – –<br />
NOK 7 7 7 – – –<br />
SEK 181 95 94 40 40 57<br />
DKK 25 8 6 5 3 3<br />
SGD 16 16 16 10 7 14<br />
NZD 1 1 – – – –<br />
CAD 0 – – – – –<br />
MXN 1 – – – – –<br />
PLN 38 30 21 11 – –<br />
SAR 0 0 0 – – –<br />
CZK 1 – – – – –<br />
Energy – nominal value [ € million ] Due in<br />
2011 2012 2013 2014 2015 2016 ff.<br />
Diesel 296 152 77 41 28 27<br />
HSL 25 20 17 1 – –<br />
Hard coal 71 36 3 – – –
| CONSOLIDATED FINANCIAL STATEMENTS<br />
| Notes<br />
199<br />
The interest payments are generally reflected in the income<br />
statement in the periods specified. In the case of interest rates,<br />
the period during which interest is recognized in the income<br />
statement may differ from the maturities of the interest payments.<br />
The energy payments are recognized in the income statement<br />
in the periods in which they fall due.<br />
In the case of interest and interest-currency hedges, the<br />
effectiveness of the hedge is assessed prospectively using the<br />
Critical Terms Match method. This method is used because the<br />
major valuation parameters of the underlying and hedges are<br />
identical. The retrospective effectiveness measurement is carried<br />
out as of every balance sheet date by means of the Hypothetical<br />
Derivative method. In this method, the development in value of<br />
the hedge which is actually taken out is compared with the<br />
development in value of a theoretical hedge in which all valuation-relevant<br />
parameters are identical to those of the underlying.<br />
In the case of energy price derivatives, the effectiveness of the<br />
hedge is assessed prospectively using the linear regression. The<br />
retrospective measurement of effectiveness is carried out as of<br />
every balance sheet date by means of the Dollar Offset method.<br />
In this method, the changes in the market value of the underlying<br />
are compared with the changes in the market value of the hedging<br />
instrument. The resultant quotient determines the inefficiency.<br />
The inefficiencies of cash flow hedges of the energy price<br />
derivatives recognized in the income statement amounted to<br />
€ 2 million in the year under review (previous year: € 1 million).<br />
NON-HEDGE DERIVATIVES<br />
Currency forwards taken out to hedge operations are normally<br />
classified as non-hedge derivatives. The development of the<br />
euro against the US dollar has had a negative impact on the<br />
development in the value of the non-hedge derivatives. This<br />
development was positively affected mainly by the weakening<br />
of the euro against the Swedish krona.<br />
The market values of the non-hedge derivatives are shown<br />
under assets and liabilities as follows:<br />
[ € million ] Assets Liabilities<br />
<strong>2010</strong> 2009 <strong>2010</strong> 2009<br />
INTEREST-BASED CONTRACTS<br />
Interest swaps 0 0 0 0<br />
Other interest derivatives 0 0 0 0<br />
0 0 0 0<br />
CURRENCY-BASED CONTRACTS<br />
Currency forward /future contracts 2 5 5 4<br />
Other currency derivatives 0 0 0 0<br />
Interest-currency swaps 0 0 0 0<br />
2 5 5 4<br />
OTHER CONTRACTS<br />
Energy price derivatives 0 0 0 0<br />
0 0 0 0<br />
TOTAL 2 5 5 4<br />
Interest-based contracts 0 0 0 0<br />
Currency-based contracts 0 0 0 2<br />
Other contracts 0 0 0 0<br />
NON-CURRENT PORTION 0 0 0 2<br />
Current portion 2 5 5 2
200<br />
| DEUTSCHE BAHN GROUP<br />
(22) Cash and cash equivalents<br />
[ € million ] <strong>2010</strong> 2009<br />
Cash at bank and in hand 1,474 1,469<br />
Cash equivalents 1 1<br />
TOTAL 1,475 1,470<br />
Effective interest rate on short-term bank deposits (%) 0.51 0.76<br />
Average term of short-term bank deposits 0.2 0.2<br />
The interest rates for current bank deposits were in a range of<br />
between 0.2 % and 1.2 % (previous year: 0.2 % to 2.5 %).<br />
(23) Held-for-sale assets and liabilities<br />
The additions of € 169 million consist almost exclusively of the<br />
acquired business of Arriva in Germany, for which DB Group, in<br />
line with the commitments provided to the EU Commission, had<br />
to sign a legally binding purchase agreement with a suitable<br />
purchaser by December 11, <strong>2010</strong>. On December 8, <strong>2010</strong>, the<br />
Supervisory Board of DB <strong>AG</strong> agreed to the conclusion of a purchase<br />
agreement for the Arriva Deutschland Group with a syndicate.<br />
The syndicate consists of the Italian rail company Ferrovie<br />
dello Stato (the syndicate leader) and the financial investor<br />
Cube Infrastructure. The completion of the sale is still subject<br />
to the approval of the European Commission with regard to the<br />
selected purchaser and also the approval of the acquisition under<br />
cartel law. We expect to receive corresponding approval in the<br />
first quarter of 2011.<br />
(24) Subscribed capital<br />
The share capital of DB <strong>AG</strong> is € 2,150 million. It consists of<br />
430,000,000 no-par value bearer shares. All shares are held by<br />
the Federal Republic of Germany.<br />
(25) Reserves<br />
A) CAPITAL RESERVES<br />
Capital reserves comprise reserves which have not been part of<br />
earnings.<br />
B) RESERVE RESULTING FROM VALUATION WITH NO<br />
IMPACT ON PROFIT OR LOSS<br />
RESERVE FOR CURRENCY TRANSLATION DIFFERENCES<br />
The currency translation differences resulting from the method<br />
of functional currency (IAS 21) are shown separately as part of<br />
consolidated shareholders’ equity.<br />
RESERVE FOR MARKET VALUATION OF SECURITIES<br />
The reserve includes the market changes of financial instruments<br />
which have been classified as “available-for-sale financial assets”<br />
and which have to be recognized with no impact on profit or<br />
loss. The reserve has to be reversed to the income statement<br />
or eliminated when a financial instrument is sold or in the event<br />
of a permanent reduction in the market value.<br />
The measurement of financial instruments directly in equity<br />
has resulted in the creation of deferred tax liabilities of € 2 million<br />
in the year under review (previous year: € 1 million).<br />
RESERVE ATTRIBUTABLE TO THE MARKET VALUATION OF<br />
CASH FLOW HEDGES<br />
This item shows the interest-, currency- and fair-value-related<br />
changes in the market value of cash flow hedges applicable for<br />
effective hedges.<br />
The development in the reserve is shown in the following:<br />
[ € million ] <strong>2010</strong> 2009<br />
As of Jan 1 –55 –104<br />
Changes in fair value 328 –25<br />
Reclassifications<br />
Financial result –193 96<br />
Net interest income –2 1<br />
Cost of materials –2 –1<br />
Changes in deferred taxes –38 –22<br />
AS OF DEC 31 38 –55<br />
Reclassification effects relate exclusively to this reserve.
| CONSOLIDATED FINANCIAL STATEMENTS<br />
| Notes<br />
201<br />
(26) Retained earnings<br />
Generated shareholders’ equity contains all net profits generated<br />
since January 1, 1994 less goodwill netted under HGB up to<br />
December 31, 2002.<br />
This item also shows the impact on shareholders’ equity<br />
attributable to the first-time adoption of IFRS if they are not<br />
included in the reserves attributable to valuation with no impact<br />
on the income statement.<br />
(27) Minority interests<br />
Minorities comprise the share of third parties in the net assets<br />
of consolidated subsidiaries.<br />
(28) Financial debt<br />
This item shows all interest-bearing liabilities including the<br />
interest-free Federal loans stated with their present values. The<br />
maturity structure of financial debt is as follows:<br />
[ € million ] Residual maturity Total<br />
Less than<br />
1 year<br />
1–2<br />
years<br />
2–3<br />
years<br />
3 – 4<br />
years<br />
4 –5<br />
years<br />
More than<br />
5 years<br />
Total more<br />
than 1 year<br />
AS OF DEC 31, <strong>2010</strong><br />
Federal loans 433 413 238 227 219 1,406 2,503 2,936<br />
Bonds 1,371 644 747 530 693 7,850 10,464 11,835<br />
Commercial paper 42 0 0 0 0 0 0 42<br />
Bank borrowings 157 84 35 19 9 842 989 1,146<br />
EUROFIMA loans 0 434 0 519 0 200 1,153 1,153<br />
Finance lease liabilities 145 196 463 80 160 380 1,279 1,424<br />
Other financial liabilities 11 0 3 0 0 3 6 17<br />
TOTAL 2,159 1,771 1,486 1,375 1,081 10,681 16,394 18,553<br />
thereof due to related<br />
companies 436 847 238 746 219 1,609 3,659 4,095<br />
AS OF DEC 31, 2009<br />
Federal loans 491 422 402 226 215 1,520 2,785 3,276<br />
Bonds 999 1,244 623 746 434 6,017 9,064 10,063<br />
Commercial paper 0 0 0 0 0 0 0 0<br />
Bank borrowings 87 8 6 4 4 807 829 916<br />
EUROFIMA loans 0 0 434 0 519 0 953 953<br />
Finance lease liabilities 185 83 144 401 38 430 1,096 1,281<br />
Other financial liabilities 18 1 0 2 0 0 3 21<br />
TOTAL 1,780 1,758 1,609 1,379 1,210 8,774 14,730 16,510<br />
thereof due to related<br />
companies 495 423 836 226 734 1,520 3,739 4,234
202<br />
| DEUTSCHE BAHN GROUP<br />
The following fair values are summarized compared with the<br />
carrying amounts:<br />
[ € million ] Carrying<br />
amount <strong>2010</strong><br />
Fair value<br />
<strong>2010</strong><br />
Carrying<br />
amount 2009<br />
Fair value<br />
2009<br />
Federal loans 2,936 3,082 3,276 3,522<br />
Bonds 11,835 12,475 10,063 10,596<br />
Commercial paper 42 42 0 0<br />
Bank borrowings 1,146 1,150 916 916<br />
EUROFIMA loans 1,153 1,224 953 1,014<br />
Finance lease liabilities 1,424 1,557 1,281 1,368<br />
Other finance liabilities 17 17 21 21<br />
TOTAL 18,553 19,547 16,510 17,437<br />
The differences between the carrying amounts and the fair values<br />
of the financial debt are due to the usually changed market<br />
interest rates for financial debt with a comparable risk profile.<br />
In view of the short maturities involved and also in view of the<br />
fact that interest charged is closely linked to market rates, there<br />
are no significant differences between the carrying amounts<br />
and the fair values of other financial liabilities.<br />
Federal loans are attributable almost exclusively to financing<br />
provided by the Federal Republic of Germany for capital expenditures<br />
in expanding and replacing track. This is based on the<br />
responsibility for the transport needs of the public which is<br />
anchored in section 87e (4) of the Basic Law (Grundgesetz) and<br />
specified in the Federal Track Expansion Act (Bundesschienenwegeausbaugesetz;<br />
BSchw<strong>AG</strong>). The loans are generally extended<br />
as interest-free loans.<br />
The arrangements for repaying the loans are detailed in<br />
individual and collective financing agreements. In general, the<br />
loans are repaid in equal annual installments, which are based<br />
on the corresponding annual depreciation applicable for the<br />
financed assets.<br />
The Federal loans granted by the Federal Government have<br />
developed as follows:<br />
[ € million ] <strong>2010</strong> 2009<br />
As of Jan 1 3,276 3,511<br />
Addition 0 9<br />
Repayment –481 –435<br />
Reclassification 18 57<br />
Cumulative interest 123 134<br />
AS OF DEC 31 2,936 3,276<br />
A loan of € 660 million has to be repaid in four equal installments<br />
at the beginning of the years 2009 to 2012. For this period,<br />
interest is charged on the installments – contrary to the common<br />
situation.
| CONSOLIDATED FINANCIAL STATEMENTS<br />
| Notes<br />
203<br />
The issued bonds consist of the following transactions:<br />
[ € million ] Volume of<br />
Issue<br />
Residual<br />
Effective<br />
Carrying<br />
Fair value<br />
Carrying<br />
Fair value<br />
issue<br />
currency<br />
maturity in<br />
interest rate<br />
amount<br />
<strong>2010</strong><br />
amount<br />
2009<br />
years<br />
%<br />
<strong>2010</strong><br />
2009<br />
UNLISTED BONDS<br />
Total DB <strong>AG</strong> 67 JPY, USD 0.7–1.5 61 62 52 53<br />
Total DB Finance 243 HKD, JPY, CHF 1.5–8.9 279 227 228<br />
TOTAL 330 341 279 281<br />
LISTED BONDS OF<br />
DB FINANCE<br />
Bond 2000–<strong>2010</strong> 1,000 EUR – 6.150 – – 999 1,021<br />
Bond 2001–2013 750 EUR 2.9 5.250 748 820 746 817<br />
Bond 2002–2012 500 EUR 1.6 5.500 499 530 499 538<br />
Bond 2003–2018 1,000 EUR 7.2 5.000 990 1,107 989 1,069<br />
Bond 2003–2015 700 EUR 4.5 4.600 693 746 692 740<br />
Bond 2004–2011 209 USD 0.5 5.090 187 190 173 182<br />
Bond 2004–2018 300 EUR 7.2 4.850 298 332 298 321<br />
Bond 2004–2016 500 EUR 5.9 4.300 499 543 499 526<br />
Bond 2004–2014 366 JPY 3.9 1.700 459 477 374 382<br />
Bond 2004–2011 197 CHF 1.0 2.300 234 244 202 207<br />
Bond 2006–2011 678 USD 0.0 5.200 599 599 555 576<br />
Bond 2006–2011 316 USD 0.0 5.820 300 299 276 288<br />
Bond 2006–2018 300 EUR 7.2 4.510 304 332 305 321<br />
Bond 2006–2017 500 EUR 6.0 4.116 497 527 496 514<br />
Bond 2007–2019 600 EUR 8.6 5.110 597 666 595 642<br />
Bond 2009–2019 1,000 EUR 8.2 4.923 995 1,094 994 1,065<br />
Bond 2009–2021 600 EUR 10.8 4.445 597 658 596 607<br />
Bond 2009–2017 500 EUR 6.8 3.774 497 515 496 499<br />
Bond <strong>2010</strong>–2020 500 EUR 9.5 3.572 497 493 – –<br />
Bond <strong>2010</strong>–2025 500 EUR 14.5 3.870 494 479 – –<br />
Bond <strong>2010</strong>–2020 410 JPY 9.8 1.150 433 423 – –<br />
Bond <strong>2010</strong>–2022 500 EUR 11.8 3.464 496 476 – –<br />
Bond <strong>2010</strong>–2020 567 CHF 9.4 1.924 592 584 – –<br />
TOTAL 11,505 12,134 9,784 10,315<br />
TOTAL BONDS 11,835 12,475 10,063 10,596<br />
In <strong>2010</strong>, a matured bond of <strong>Deutsche</strong> <strong>Bahn</strong> Finance B.V. (DB Finance),<br />
Amsterdam/the Netherlands was repaid (€ 1,000 million), and<br />
five new listed bonds of DB Finance were issued. These comprise<br />
three bonds each for an amount of € 500 million, one bond in an<br />
amount of JPY 47 billion (€ 410 million) and one bond in an amount<br />
of CHF 750 million, which was issued in two tranches of CHF<br />
400 million (€ 299 million) and CHF 350 million (€ 268 million).
204<br />
| DEUTSCHE BAHN GROUP<br />
Bank borrowings are detailed in the following table:<br />
Bank borrowings [ € million ] Currency Residual<br />
maturity<br />
Nominal<br />
interest<br />
Carrying<br />
amount<br />
Fair value<br />
<strong>2010</strong><br />
Carrying<br />
amount<br />
Fair value<br />
2009<br />
in years<br />
rate %<br />
<strong>2010</strong><br />
2009<br />
Loan 2002–2016 EUR 5.7 FRN 200 200 200 200<br />
Loan 2002–2022 EUR 11.7 FRN 200 200 200 200<br />
Loan 2003–2016 EUR 5.7 FRN 200 200 200 200<br />
Loan 2003–2022 EUR 11.7 FRN 200 200 200 200<br />
Other 346 350 116 116<br />
TOTAL 1,146 1,150 916 916<br />
The increase in other bank borrowings is mainly attributable to<br />
transferred liabilities of Arriva. These are intended in particular<br />
to finance rolling stock and buses.<br />
Bank borrowings were secured in an amount of € 197 million<br />
(previous year: € 1 million). Liabilities are not secured in DB Group.<br />
Secured bank borrowings are due to acquisitions. The significant<br />
increase is attributable to the purchase of Arriva.<br />
As of December 31, <strong>2010</strong>, guaranteed credit facilities with<br />
a total volume of € 3,901 million (previous year: € 3,055 million)<br />
were available to DB Group. Of this figure, € 2,500 million (previous<br />
year: € 1,800 million) was attributable to back-up lines for<br />
the € 2.0 billion commercial paper program of DB <strong>AG</strong> and<br />
DB Finance. None of these back-up lines had been drawn<br />
down as of December 31, <strong>2010</strong>. Global credit facilities totaling<br />
€ 1,401 million (previous year: € 1,255 million) are used for<br />
working capital and surety for payment financing of subsidiaries<br />
with worldwide operations, primarily in the DB Schenker Logistics<br />
segment.<br />
The liabilities due to EUROFIMA are detailed in the following:<br />
Liabilities due to EUROFIMA [ € million ] Currency Residual<br />
maturity<br />
Nominal<br />
interest<br />
Carrying<br />
amount<br />
Fair value<br />
<strong>2010</strong><br />
Carrying<br />
amount<br />
Fair value<br />
2009<br />
in years<br />
rate %<br />
<strong>2010</strong><br />
2009<br />
Loan 2000–2014 EUR 3.8 5.970 219 249 219 248<br />
Loan 2001–2014 EUR 3.7 5.410 300 334 300 332<br />
Loan 2002–2012 EUR 1.6 FRN 34 34 34 34<br />
Loan 2002–2012 EUR 1.6 FRN 400 400 400 400<br />
Loan <strong>2010</strong>–2021 EUR 10.8 4.050 200 207 – –<br />
TOTAL 1,153 1,224 953 1,014<br />
One new EUROFIMA loan amounting to € 200 million was taken<br />
out in the year under review. The liabilities due to EUROFIMA<br />
are secured by way of transfer of ownership of rail material<br />
(rolling stock) in view of the statutes of EUROFIMA.<br />
Of the figure stated for liabilities attributable to finance<br />
leases, € 415 million (previous year: € 434 million) related to<br />
real estate leasing agreements for various concourse buildings<br />
of DB Station & Service <strong>AG</strong> and a logistics center of Schenker<br />
Deutschland <strong>AG</strong> in Echingen, and € 557 million (previous year:<br />
€ 600 million) related to leasing agreements for various rolling<br />
stock (multiple units, engines, freight cars, buses). These<br />
agreements have been concluded mainly as sale-and-leaseback<br />
transactions for achieving advantageous financing conditions<br />
with German lessors.
| CONSOLIDATED FINANCIAL STATEMENTS<br />
| Notes<br />
205<br />
The following table provides information concerning the main<br />
finance leases:<br />
[ € million ] Nominal<br />
Currency<br />
Residual<br />
Nominal<br />
Carrying<br />
Fair value<br />
Carrying<br />
Fair value<br />
amount<br />
maturity<br />
interest<br />
amount<br />
<strong>2010</strong><br />
amount<br />
2009<br />
in years<br />
rate %<br />
<strong>2010</strong><br />
2009<br />
FINANCE LEASES – ASSETS<br />
OTHER THAN REAL ESTATE<br />
Double-deck coaches (1994) 174 DEM 2.0 5.87 95 101 102 110<br />
ICE 2 multiple units (1997 ) 184 DEM 0.0 4.50 0 0 101 104<br />
Locomotives /freight cars (1999) 182 NLG 1.0–2.3 5.69–5.83 31 33 50 53<br />
Freight locomotives (2000) 101 DEM 4.5 5.35 69 77 73 81<br />
Freight locomotives (2000) 154 EUR 6.0 5.40 121 134 127 138<br />
Locomotives (2001) 178 EUR 4.5–6.0 4.87 141 152 147 156<br />
Diesel rail cars for regional<br />
transport (2009) 55 EUR 8.0 8.34 53 70 – –<br />
Buses (2009) 56 GBP 3.2 4.91 47 51 – –<br />
557 618 600 642<br />
F I N A N C E L E A S E S –<br />
REAL ESTATE<br />
Logistics center (1986) 24 DEM 5.0 8.50 10 14 14 15<br />
Concourse buldings (1998) 497 DEM 2.3–11.0 4.00–5.95 405 431 420 447<br />
415 445 434 462<br />
Other 452 494 247 264<br />
TOTAL 1,424 1,557 1,281 1,368<br />
The above finance leases for locomotives and multiple units<br />
cannot be terminated during a fixed basic lease term, and have<br />
a maximum remaining term of eight years. Most of the contracts<br />
contain a clause enabling the lessee to purchase the assets for<br />
the residual value or the higher market value after the end of<br />
the lease, whereby the difference between the residual value<br />
and the market value at the end of the lease is shared between<br />
the lessor (25 %) and the lessee (75 %).<br />
The financing leasing portfolio for movable assets has<br />
expanded as a result of the purchase of Arriva mainly to include<br />
buses in Great Britain and local transport diesel multiple units<br />
in Denmark.<br />
The finance leases for the concourse buildings of DB Station&<br />
Service <strong>AG</strong> have a maximum remaining term of eleven years,<br />
and cannot be terminated during the fixed lease. At the end of<br />
the lease, the lessee is able to buy the assets for a fixed price.<br />
If this option is not exercised, the lease is extended for a second<br />
period, at the end of which the lessor has a put option for the<br />
real estate with regard to DB Station& Service <strong>AG</strong>.<br />
In addition, liabilities attributable to finance leases (see<br />
Note (13)) are secured by rights of the lessors in relation to the<br />
leased assets. The leased assets have a carrying amount of<br />
€ 1,174 million (previous year: € 918 million).
206<br />
| DEUTSCHE BAHN GROUP<br />
The position “Other” has increased as a result of numerous<br />
leasing agreements from Arriva for buses and trains which have<br />
been concluded in various European countries. It also includes<br />
the carrying amount of a power procurement agreement of<br />
DB Energie GmbH worth € 122 million (previous year: € 129 million)<br />
as well as the carrying amount of an inverter agreement<br />
of DB Energie GmbH in the amount of € 54 million (previous<br />
year: € 57 million). Both agreements are classified as embedded<br />
financial leases as a result of the fact that the power is procured<br />
primarily by DB Energie GmbH and also in view of the underlying<br />
agreement duration in accordance with IFRIC 4 (Determining<br />
whether an Arrangement Contains a Lease) in conjunction with<br />
IAS 17.<br />
In the subsequent years, the following payments have to<br />
be made in connection with finance leases:<br />
[ € million ] Residual maturity Total<br />
Less than<br />
1 year<br />
1–2<br />
years<br />
2–3<br />
years<br />
3 – 4<br />
years<br />
4 – 5<br />
years<br />
More than<br />
5 years<br />
Total more<br />
than 1 year<br />
AS OF DEC 31, <strong>2010</strong><br />
Minimum lease payments<br />
(nominal value) 220 263 507 114 191 553 1,628 1,848<br />
– Future interest charges 75 67 44 34 31 173 349 424<br />
FINANCE LEASE LIABILITIES 145 196 463 80 160 380 1,279 1,424<br />
AS OF DEC 31, 2009<br />
Minimum lease payments<br />
(nominal value) 251 140 196 433 64 514 1,347 1,598<br />
– Future interest charges 66 57 52 32 26 84 251 317<br />
FINANCE LEASE LIABILITIES 185 83 144 401 38 430 1,096 1,281<br />
(29) Other liabilities<br />
[ € million ] Residual maturity Total<br />
Less than<br />
1 year<br />
1–2<br />
years<br />
2–3<br />
years<br />
3 – 4<br />
years<br />
4 – 5<br />
years<br />
More than<br />
5 years<br />
Total more<br />
than 1 year<br />
AS OF DEC 31, <strong>2010</strong><br />
Trade liabilities 4,286 33 27 37 24 156 277 4,563<br />
Miscellaneous other liabilities 3,109 21 4 2 6 17 50 3,159<br />
TOTAL 7,395 54 31 39 30 173 327 7,722<br />
thereof due to related parties 401 0 0 0 0 0 0 401<br />
AS OF DEC 31, 2009<br />
Trade liabilities 3,267 29 28 24 26 178 285 3,552<br />
Miscellaneous other liabilities 2,732 18 10 3 2 133 166 2,898<br />
TOTAL 5,999 47 38 27 28 311 451 6,450<br />
thereof due to related parties 424 0 0 0 0 0 0 424
| CONSOLIDATED FINANCIAL STATEMENTS<br />
| Notes<br />
207<br />
The miscellaneous other liabilities comprise the following:<br />
[ € million ] <strong>2010</strong> 2009<br />
PERSONNEL-RELATED LIABILITIES<br />
Unused holiday entitlements 283 220<br />
Outstanding overtime 216 207<br />
Social security 86 65<br />
Severance payments 21 27<br />
Christmas bonuses 8 5<br />
Holiday pay 15 9<br />
Other obligations 603 465<br />
OTHER TAXES<br />
Value-added tax 59 98<br />
Payroll and church taxes, solidarity surcharge 102 88<br />
Miscellaneous other taxes 130 95<br />
Interest payable 270 270<br />
Sales discounts 150 121<br />
Deferred construction grants 132 131<br />
Liabilities due to Railway Crossings Act 4 3<br />
Reconveyance obligations 2 2<br />
Miscellaneous liabilities 1,078 1,092<br />
TOTAL 3,159 2,898<br />
The increase in the other personnel obligations is mainly attributable<br />
to the acquisition of Arriva and also higher bonus obligations.<br />
The other liabilities were secured in an amount of € 1 million<br />
in the year under review (previous year: € 1 million).<br />
(30) Income tax liabilities<br />
The income tax liabilities as of December 31, <strong>2010</strong> related mainly<br />
to obligations to the fiscal authorities in Great Britain, Germany<br />
and India.<br />
(31) Additional disclosures relating<br />
to the financial instruments<br />
Carrying amounts and fair values based on valuation categories.
208<br />
| DEUTSCHE BAHN GROUP<br />
CATEGORIES OF FINANCIAL ASSETS AND FINANCIAL LIABILITIES AS OF DECEMBER 31, <strong>2010</strong><br />
Valuation categories (according to IAS 39) [ € million ] Held for trading 1) Held to maturity<br />
Fair value At amortised cost<br />
At cost<br />
(recognized in the<br />
income statement)<br />
CATEGORIES OF FINANCIAL ASSETS AND FINANCIAL LIABILITIES<br />
ASSETS<br />
NON-CURRENT FINANCIAL ASSETS<br />
Shares in affiliated companies (at cost) 0 0 0<br />
Subsidiaries (at cost) 0 0 41<br />
Subsidiaries (at fair value) 0 0 0<br />
Securities (at cost) 0 0 0<br />
Securities (at fair value) 0 0 0<br />
AVAILABLE-FOR-SALE FINANCIAL ASSETS 0 0 41<br />
Trade receivables 0 0 0<br />
Receivables from financing 0 0 0<br />
Receivables from finance lease 0 0 0<br />
Advance payments and accrued income 0 0 0<br />
Plan assets according to IAS 19 0 0 0<br />
Miscellaneous other assets 0 0 0<br />
RECEIVABLES AND OTHER ASSETS 0 0 0<br />
Interest-based derivatives – hedging 0 0 0<br />
Currency-based derivatives – hedging 0 0 0<br />
Commodity-based derivatives – hedging 0 0 0<br />
Interest-based derivatives – non-hedging 0 0 0<br />
Currency-based derivatives – non-hedging 0 0 0<br />
DERIVATIVE FINANCIAL INSTRUMENTS 0 0 0<br />
TOTAL NON-CURRENT FINANCIAL ASSETS 0 0 41<br />
CURRENT FINANCIAL ASSETS<br />
Subsidiaries (at cost) 0 0 0<br />
Securities (at cost) 0 0 0<br />
Securities (at fair value) 0 0 0<br />
AVAILABLE-FOR-SALE FINANCIAL ASSETS 0 0 0<br />
Trade receivables 0 0 0<br />
Receivables from financing 0 0 0<br />
Receivables from finance lease 0 0 0<br />
Advance payments and accrued income 0 0 0<br />
Held to maturity securities 0 0 0<br />
Receivables from other taxes 0 0 0<br />
Plan assets according to IAS 19 0 0 0<br />
Miscellaneous other assets 0 0 0<br />
OTHER RECEIVABLES AND ASSETS 0 0 0<br />
Interest-based derivatives – hedging 0 0 0<br />
Currency-based derivatives – hedging 0 0 0<br />
Commodity-based derivatives – hedging 0 0 0<br />
Interest-based derivatives – non-hedging 0 0 0<br />
Currency-based derivatives – non-hedging 2 0 0<br />
Commodity-based derivatives – non-hedging 0 0 0<br />
DERIVATIVE FINANCIAL INSTRUMENTS 2 0 0<br />
Cash and cash equivalents 0 0 0<br />
Available-for-sale assets 0 0 167<br />
TOTAL CURRENT FINANCIAL ASSETS 2 0 167
| CONSOLIDATED FINANCIAL STATEMENTS<br />
| Notes<br />
209<br />
Total Fair value<br />
Available for sale Loans and receivables Not attributable<br />
recognized in the<br />
according to IAS 39 2)<br />
Fair value (not<br />
At cost At amortised cost<br />
to a category<br />
income statement)<br />
0 0 0 0 0 n /a<br />
0 0 0 0 41 n/a<br />
18 0 0 0 18 18<br />
0 0 0 0 0 n /a<br />
4 0 0 0 4 4<br />
0 0 0 63 22<br />
0 0 39 0 39 39<br />
0 0 11 0 11 11<br />
0 0 0 21 21 21<br />
0 0 0 28 28 n /a<br />
0 0 0 4 4 n /a<br />
0 0 18 41 59 59<br />
0 68 94 162 130<br />
0 0 0 0 0 0<br />
0 0 0 166 166 166<br />
0 0 0 113 113 113<br />
0 0 0 0 0 0<br />
0 0 0 0 0 0<br />
0 0 279 279 279<br />
22 0 68 373 504 431<br />
0 0 0 0 0 n /a<br />
0 0 0 0 0 n /a<br />
1 0 0 0 1 1<br />
0 0 0 1 1<br />
0 0 3,877 0 3,877 3,877<br />
0 0 106 0 106 106<br />
0 0 0 1 1 1<br />
0 0 0 171 171 171<br />
0 0 0 0 0 0<br />
0 0 0 142 142 142<br />
0 0 0 0 0 0<br />
0 0 339 81 420 420<br />
0 0 445 395 840 840<br />
0 0 0 0 0 0<br />
0 0 0 51 51 51<br />
0 0 0 43 43 43<br />
0 0 0 0 0 0<br />
0 0 0 0 2 2<br />
0 0 0 0 0 0<br />
0 0 94 96 96<br />
0 0 1,475 0 1,475 1,475<br />
0 0 0 2 169 169<br />
1 0 5,797 491 6,458 6,458<br />
1)<br />
Including non-hedge<br />
derivatives. DB Group<br />
did not apply the fair<br />
value option accord ing<br />
to IAS 39. Thus the subcategory<br />
“held for trading”<br />
was used in stead<br />
of the main category<br />
“fair value through<br />
profit and loss.”<br />
2)<br />
For the transition from<br />
the categories of<br />
financial assets and<br />
financial liabilities<br />
to the figures stated<br />
in the balance sheet.
210<br />
| DEUTSCHE BAHN GROUP<br />
CATEGORIES OF FINANCIAL ASSETS AND FINANCIAL LIABILITIES AS OF DECEMBER 31, 2009<br />
Valuation categories (according to IAS 39) [ € million ] Held for trading 1) Held to maturity<br />
Fair value At amortised cost<br />
At cost<br />
(recognized in the<br />
income statement)<br />
CATEGORIES OF FINANCIAL ASSETS AND FINANCIAL LIABILITIES<br />
ASSETS<br />
NON-CURRENT FINANCIAL ASSETS<br />
Shares in affiliated companies (at cost) 0 0 1<br />
Subsidiaries (at cost) 0 0 25<br />
Subsidiaries (at fair value) 0 0 0<br />
Securities (at cost) 0 0 0<br />
Securities (at fair value) 0 0 0<br />
AVAILABLE-FOR-SALE FINANCIAL ASSETS 0 0 26<br />
Trade receivables 0 0 0<br />
Receivables from financing 0 0 0<br />
Receivables from finance lease 0 0 0<br />
Advance payments and accrued income 0 0 0<br />
Plan assets according to IAS 19 0 0 0<br />
Miscellaneous other assets 0 0 0<br />
RECEIVABLES AND OTHER ASSETS 0 0 0<br />
Interest-based derivatives – hedging 0 0 0<br />
Currency-based derivatives – hedging 0 0 0<br />
Commodity-based derivatives – hedging 0 0 0<br />
Interest-based derivatives – non-hedging 0 0 0<br />
Currency-based derivatives – non-hedging 0 0 0<br />
DERIVATIVE FINANCIAL INSTRUMENTS 0 0 0<br />
TOTAL NON-CURRENT FINANCIAL ASSETS 0 0 26<br />
CURRENT FINANCIAL ASSETS<br />
Subsidiaries (at cost) 0 0 0<br />
Securities (at cost) 0 0 0<br />
Securities (at fair value) 0 0 0<br />
AVAILABLE-FOR-SALE FINANCIAL ASSETS 0 0 0<br />
Trade receivables 0 0 0<br />
Receivables from financing 0 0 0<br />
Receivables from finance lease 0 0 0<br />
Advance payments and accrued income 0 0 0<br />
Held to maturity securities 0 0 0<br />
Receivables from other taxes 0 0 0<br />
Plan assets according to IAS 19 0 0 0<br />
Miscellaneous other assets 0 0 0<br />
OTHER RECEIVABLES AND ASSETS 0 0 0<br />
Interest-based derivatives – hedging 0 0 0<br />
Currency-based derivatives – hedging 0 0 0<br />
Commodity-based derivatives – hedging 0 0 0<br />
Interest-based derivatives – non-hedging 0 0 0<br />
Currency-based derivatives – non-hedging 5 0 0<br />
Commodity-based derivatives – non-hedging 0 0 0<br />
DERIVATIVE FINANCIAL INSTRUMENTS 5 0 0<br />
Cash and cash equivalents 0 0 0<br />
Available-for-sale assets 0 0 0<br />
TOTAL CURRENT FINANCIAL ASSETS 5 0 0
| CONSOLIDATED FINANCIAL STATEMENTS<br />
| Notes<br />
211<br />
Available for sale<br />
Fair value (not<br />
recognized in the<br />
At amortised cost<br />
Loans and receivables<br />
At amortised cost<br />
Not attributable<br />
to a category<br />
according to IAS 39 2)<br />
income statement)<br />
Total<br />
Fair value<br />
0 0 0 0 1 n/a<br />
0 0 0 0 25 n/a<br />
8 0 0 0 8 8<br />
0 0 0 0 0 n/a<br />
3 0 0 0 3 3<br />
11 0 0 0 37 11<br />
0 0 52 0 52 52<br />
0 0 8 0 8 8<br />
0 0 0 21 21 21<br />
0 0 0 25 25 n/a<br />
0 0 0 25 25 n/a<br />
0 0 14 39 53 53<br />
0 0 74 110 184 134<br />
0 0 0 0 0 0<br />
0 0 0 28 28 28<br />
0 0 0 8 8 8<br />
0 0 0 0 0 0<br />
0 0 0 0 0 0<br />
0 0 0 36 36 36<br />
11 0 74 146 257 181<br />
0 0 0 0 0 n/a<br />
0 0 0 0 0 n/a<br />
1 0 0 0 1 1<br />
1 0 0 0 1 1<br />
0 0 3,030 0 3,030 3,030<br />
0 0 0 0 0 0<br />
0 0 0 0 0 0<br />
0 0 0 74 74 74<br />
0 0 0 0 0 0<br />
0 0 0 97 97 97<br />
0 0 0 2 2 2<br />
0 0 280 51 331 331<br />
0 0 280 224 504 504<br />
0 0 0 0 0 0<br />
0 0 0 14 14 14<br />
0 0 0 7 7 7<br />
0 0 0 0 0 0<br />
0 0 0 0 5 5<br />
0 0 0 0 0 0<br />
0 0 0 21 26 26<br />
0 0 1,470 0 1,470 1,470<br />
0 0 0 0 0 0<br />
1 0 4,780 245 5,031 5,031<br />
1)<br />
Including non-hedge<br />
derivatives. DB Group<br />
did not apply the fair<br />
value option accord ing<br />
to IAS 39. Thus the subcategory<br />
“held for trading”<br />
was used in stead<br />
of the main category<br />
“fair value through<br />
profit and loss.”<br />
2)<br />
For the transition from<br />
the categories of<br />
financial assets and<br />
financial liabilities<br />
to the figures stated<br />
in the balance sheet.
212<br />
| DEUTSCHE BAHN GROUP<br />
CATEGORIES OF FINANCIAL ASSETS AND FINANCIAL LIABILITIES AS OF DECEMBER 31, <strong>2010</strong><br />
Valuation categories (according to IAS 39) [ € million ] Held for trading 1) Other liabilities<br />
Fair value<br />
At cost At amortised cost<br />
(recognized in the<br />
income statement)<br />
CATEGORIES OF FINANCIAL ASSETS AND FINANCIAL LIABILITIES<br />
EQUITY AND LIABILITIES<br />
NON-CURRENT FINANCIAL LIABILITIES<br />
Federal loans 0 0 2,503<br />
Bonds 0 0 10,465<br />
Commercial paper 0 0 0<br />
Bank liabilities 0 0 989<br />
EUROFIMA loans 0 0 1,153<br />
Finance lease liabilities 0 0 0<br />
Other financial liabilities 0 0 6<br />
FINANCIAL DEBT 0 0 15,116<br />
Trade liabilities 0 0 18<br />
Miscellaneous other liabilities 0 0 50<br />
OTHER LIABILITIES 0 0 68<br />
Interest-based derivatives – hedging 0 0 0<br />
Currency-based derivatives – hedging 0 0 0<br />
Commodity-based derivatives – hedging 0 0 0<br />
Currency-based derivatives – non-hedging 0 0 0<br />
DERIVATIVE FINANCIAL INSTRUMENTS 0 0 0<br />
TOTAL NON-CURRENT FINANCIAL LIABILITIES 0 0 15,184<br />
CURRENT FINANCIAL LIABILITIES<br />
Federal loans 0 0 433<br />
Bonds 0 0 1,370<br />
Commercial paper 0 0 42<br />
Bank liabilities 0 0 157<br />
Finance lease liabilities 0 0 0<br />
Other financial liabilities 0 0 11<br />
FINANCIAL DEBT 0 0 2,013<br />
Trade liabilities 0 0 4,133<br />
TRADE LIABILITIES 0 0 4,133<br />
Liabilities from other taxes 0 0 0<br />
Miscellaneous other liabilities 0 0 1,586<br />
OTHER LIABILITIES 0 0 1,586<br />
Interest-based derivatives – hedging 0 0 0<br />
Currency-based derivatives – hedging 0 0 0<br />
Commodity-based derivatives – hedging 0 0 0<br />
Currency-based derivatives – non-hedging 5 0 0<br />
DERIVATIVE FINANCIAL INSTRUMENTS 5 0 0<br />
TOTAL CURRENT FINANCIAL LIABILITIES 5 0 7,732<br />
1)<br />
Including non-hedge derivatives. DB Group did not apply the fair value option according to IAS 39. Thus the subcategory “held for trading”<br />
was used instead of the main category “fair value through profit and loss.”<br />
2)<br />
For the transition from the categories of financial assets and financial liabilities to the figures stated in the balance sheet.
| CONSOLIDATED FINANCIAL STATEMENTS<br />
| Notes<br />
213<br />
Not attributable<br />
Total Fair value<br />
according to IAS 39 2)<br />
to a category<br />
0 2,503 2,649<br />
0 10,465 11,104<br />
0 0 0<br />
0 989 989<br />
0 1,153 1,224<br />
1,278 1,278 1,412<br />
0 6 6<br />
1,278 16,394 17,384<br />
259 277 18<br />
0 50 50<br />
259 327 68<br />
12 12 12<br />
74 74 74<br />
2 2 2<br />
0 0 0<br />
88 88<br />
1,625 16,809 17,540<br />
0 433 433<br />
0 1,370 1,370<br />
0 42 42<br />
0 157 157<br />
146 146 146<br />
0 11 11<br />
146 2,159 2,159<br />
153 4,286 4,286<br />
153 4,286 4,286<br />
291 291 291<br />
1,232 2,818 2,818<br />
1,523 3,109 3,109<br />
0 0 0<br />
68 68 68<br />
19 19 19<br />
0 5 5<br />
92 92<br />
1,909 9,646 9,646
214<br />
| DEUTSCHE BAHN GROUP<br />
CATEGORIES OF FINANCIAL ASSETS AND FINANCIAL LIABILITIES AS OF DECEMBER 31, 2009<br />
Valuation categories (according to IAS 39) [ € million ] Held for trading 1) Other liabilities<br />
Fair value<br />
At cost At amortised cost<br />
(recognized in the<br />
income statement)<br />
CATEGORIES OF FINANCIAL ASSETS AND FINANCIAL LIABILITIES<br />
EQUITY AND LIABILITIES<br />
NON-CURRENT FINANCIAL LIABILITIES<br />
Federal loans 0 0 2,785<br />
Bonds 0 0 9,064<br />
Commercial paper 0 0 0<br />
Bank liabilities 0 0 829<br />
EUROFIMA loans 0 0 953<br />
Finance lease liabilities 0 0 0<br />
Other financial liabilities 0 0 3<br />
FINANCIAL DEBT 0 0 13,634<br />
Trade liabilities 0 0 4<br />
Miscellaneous other liabilities 0 0 166<br />
OTHER LIABILITIES 0 0 170<br />
Interest-based derivatives – hedging 0 0 0<br />
Currency-based derivatives – hedging 0 0 0<br />
Commodity-based derivatives – hedging 0 0 0<br />
Currency-based derivatives – non-hedging 2 0 0<br />
DERIVATIVE FINANCIAL INSTRUMENTS 2 0 0<br />
TOTAL NON-CURRENT FINANCIAL LIABILITIES 2 0 13,804<br />
CURRENT FINANCIAL LIABILITIES<br />
Federal loans 0 0 491<br />
Bonds 0 0 999<br />
Commercial paper 0 0 0<br />
Bank liabilities 0 0 87<br />
Finance lease liabilities 0 0 0<br />
Other financial liabilities 0 0 18<br />
FINANCIAL DEBT 0 0 1,595<br />
Trade liabilities 0 0 3,125<br />
TRADE LIABILITIES 0 0 3,125<br />
Liabilities from other taxes 0 0 0<br />
Miscellaneous other liabilities 0 0 1,453<br />
OTHER LIABILITIES 0 0 1,453<br />
Interest-based derivatives – hedging 0 0 0<br />
Currency-based derivatives – hedging 0 0 0<br />
Commodity-based derivatives – hedging 0 0 0<br />
Currency-based derivatives – non-hedging 2 0 0<br />
DERIVATIVE FINANCIAL INSTRUMENTS 2 0 0<br />
TOTAL CURRENT FINANCIAL LIABILITIES 2 0 6,173<br />
1)<br />
Including non-hedge derivatives. DB Group did not apply the fair value option according to IAS 39. Thus the subcategory “held for trading”<br />
was used instead of the main category “fair value through profit and loss.”<br />
2)<br />
For the transition from the categories of financial assets and financial liabilities to the figures stated in the balance sheet.
| CONSOLIDATED FINANCIAL STATEMENTS<br />
| Notes<br />
215<br />
Not attributable<br />
Total Fair value<br />
according to IAS 39 2)<br />
to a category<br />
0 2,785 3,031<br />
0 9,064 9,597<br />
0 0 0<br />
0 829 829<br />
0 953 1,014<br />
1,096 1,096 1,183<br />
0 3 3<br />
1,096 14,730 15,657<br />
281 285 4<br />
0 166 166<br />
281 451 170<br />
0 0 0<br />
140 140 140<br />
38 38 38<br />
0 2 2<br />
178 180 180<br />
1,555 15,361 16,007<br />
0 491 491<br />
0 999 999<br />
0 0 0<br />
0 87 87<br />
185 185 185<br />
0 18 18<br />
185 1,780 1,780<br />
142 3,267 3,267<br />
142 3,267 3,267<br />
281 281 281<br />
998 2,451 2,451<br />
1,279 2,732 2,732<br />
0 0 0<br />
7 7 7<br />
59 59 59<br />
0 2 2<br />
66 68 68<br />
1,672 7,847 7,847
216<br />
| DEUTSCHE BAHN GROUP<br />
The financial instruments shown at fair value belong to the<br />
valuation level 2 in accordance with IFRS 7.27.<br />
Cash and cash equivalents, trade receivables as well as<br />
other receivables mostly have short remaining terms. Accordingly,<br />
their carrying amounts as of the closing date closely<br />
approximate the fair value.<br />
The fair values of other non-current receivables with<br />
remaining terms of more than one year are equivalent to the<br />
present values of the cash flows associated with the assets.<br />
Trade liabilities and other liabilities generally have short<br />
remaining terms. The recognized figures are approximately<br />
equivalent to the fair values.<br />
The fair values of other non-current receivables with<br />
remaining terms of more than one year are equivalent to the<br />
present values of the cash flows associated with the assets.<br />
No held-to-maturity securities are shown as of the balance<br />
sheet date.<br />
The net results according t o valuation categories are<br />
detailed in the following:<br />
[ € million ] Interest<br />
Interest<br />
Other<br />
Other<br />
Valuation after recognition<br />
Total net<br />
income<br />
expense<br />
income<br />
expenses<br />
at fair value<br />
from<br />
from<br />
result<br />
ex change<br />
impairments<br />
rate transformation<br />
<strong>2010</strong><br />
Held for trading assets and<br />
liabilities including non-hedge<br />
derivatives 0 0 0 0 –3 0 0 –3<br />
Available for sale 0 0 14 –8 0 0 0 6<br />
Loans and receivables 50 0 5 0 0 –20 –75 –40<br />
Other liabilities 0 –806 0 –3 0 0 0 –809<br />
TOTAL 50 – 806 19 –11 – 3 –20 –75 – 846<br />
2009<br />
thereof recognized in the<br />
statement of income 50 – 806 19 –11 –3 –20 –75 –846<br />
thereof covered directly<br />
in equity 0 0 0 0 0 0 0 0<br />
Held for trading assets and<br />
liabilities including non-hedge<br />
derivatives 9 –10 0 0 2 0 0 1<br />
Available for sale 0 0 2 0 0 0 – 33 –31<br />
Loans and receivables 36 0 2 0 0 25 8 71<br />
Other liabilities 0 –751 0 – 3 0 0 0 –754<br />
TOTAL 45 –761 4 –3 2 25 –25 –713<br />
thereof recognized in the<br />
statement of income 45 –761 4 – 3 2 25 –25 –713<br />
thereof covered directly<br />
in equity 0 0 0 0 0 0 0 0<br />
The net results mainly include net interest income of € –756 million<br />
(previous year: € –716 million).<br />
The interest attributable to financial instruments is shown<br />
in net interest income (see point (9) in the Notes); the other<br />
components of net result are shown under other financial result.<br />
The net result of financial liabilities in the category “Other<br />
liabilities” includes interest expenses attributable to the cumulative<br />
interest relating to interest-free loans.<br />
Foreign currency gains and losses attributable to the translation<br />
of foreign currency liabilities are opposed by almost<br />
identical losses/gains attributable to derivatives (see point (10)<br />
in the Notes).
| CONSOLIDATED FINANCIAL STATEMENTS<br />
| Notes<br />
217<br />
(32) Pension obligations<br />
In DB Group, a distinction is made between pensions for employees<br />
and pensions for civil servants.<br />
PENSIONS FOR CIVIL SERVANTS<br />
After they retire, civil servants assigned to the companies of<br />
DB Group receive pensions from the Federal Railroad Fund<br />
under the Civil Servants Benefits Act (Beamtenversorgungsgesetz)<br />
as a result of their status as civil servants.<br />
Only while the assigned civil servants are actively working<br />
for DB Group are payments made to the Federal Railroad Fund<br />
as part of a pro forma settlement in the same way as for newly<br />
recruited employees (section 21 (1) DBGrG). This also includes<br />
theoretical amounts for contributions to statutory pension<br />
insurance schemes as well as theoretical costs in accordance<br />
with the collective bargaining agreement regarding the additional<br />
company pension scheme for employees of DB <strong>AG</strong><br />
(ZVersTV). The payments made to the Federal Railroad Fund<br />
for retirement pensions and supplementary benefits of civil<br />
servants are defined contribution retirement schemes.<br />
PENSIONS FOR EMPLOYEES<br />
The retirement benefit obligations with regard to employees<br />
mainly relate to the following:<br />
a) Employees who were employed by <strong>Deutsche</strong> Bundesbahn<br />
before DB <strong>AG</strong> was established (January 1, 1994) enjoy<br />
supplementary benefits in view of their former membership<br />
of the public sector. The employees are entitled to benefits<br />
from this additional pension insurance from <strong>Deutsche</strong> Rentenversicherung<br />
Knappschaft-<strong>Bahn</strong>-See (KBS). As an official<br />
authority, KBS has not only assumed responsibility for managing<br />
and paying the statutory pension for DB Group employees; it<br />
also continues the additional pension insurance for the transferred<br />
employees who are beneficiaries.<br />
The Federal Railroad Fund bears the costs of these additional<br />
benefits, less the contribution made by the employees<br />
themselves (section 14 (2) DBGrG). Accordingly, DB <strong>AG</strong> does<br />
not set aside any provisions for these public sector benefits.<br />
b) Employees of the former <strong>Deutsche</strong> Reichsbahn and the<br />
employees who have been recruited after January 1, 1994 receive<br />
an additional company pension from DB <strong>AG</strong> within the framework<br />
of the ZVersTV. This supplementary company pension is<br />
a defined benefit scheme, which is linked to salary and length<br />
of service.<br />
c) Domestic employees of DB Schenker Logistics mainly<br />
have a commitment for benefits from a defined contribution<br />
employer financed benefit plan which is not salary-linked.<br />
Depending on the extent of benefits and in the event of early<br />
payment of benefits, capital payments have to be made or, if<br />
appropriate, pension benefits to be capitalized have to be provided.<br />
For senior executives, there is a defined contribution<br />
employer financed benefit scheme which is salary-linked. The<br />
benefits have to be provided in the form of an annuity with a<br />
capital option.<br />
There are no plan assets for both benefit schemes. In addition,<br />
most employees are able to participate in an employee<br />
financed benefit scheme in which a defined contribution direct<br />
commitment without plan assets is provided in return for a<br />
salary waiver. The employee contributions are topped up by<br />
the employer.<br />
Senior executives have a purely employee financed benefit<br />
scheme. This scheme has plan assets which are capable of<br />
being netted.<br />
Employees of DB Schenker Logistics abroad mainly have<br />
final-salary benefit schemes with and without a length-ofservice<br />
link. These include some government schemes.<br />
Approximately half of the benefit obligations abroad is<br />
funded exclusively by provisions. The other half is included in<br />
schemes featuring proportionate fund and insurance cover.<br />
Employee and employer contributions are normally paid into<br />
these schemes.<br />
In Germany, there are defined contribution plans in the form<br />
of direct insurance at DB Schenker Logistics. Abroad, some<br />
benefit schemes have to be treated as defined contribution plans.<br />
d) The direct commitments provided to senior executives<br />
as a result of employment agreements and the commitments<br />
arising from other pension obligations comprise defined benefit<br />
as well as defined contribution retirement benefit schemes.<br />
These are employee as well as employer financed and are<br />
partially or completely covered with plan assets eligible for<br />
netting purposes.
218<br />
| DEUTSCHE BAHN GROUP<br />
e) In addition, there are also employee financed direct<br />
insurance policies, mainly with DEVK <strong>Deutsche</strong> Eisenbahn Versicherung,<br />
Lebensversicherungsverein a.G., as well as a purely<br />
employee financed pension fund at DEVK Pensionsfonds-<strong>AG</strong><br />
which is the subject of a collective bargaining agreement. These<br />
external facilities for a company pension scheme are not relevant<br />
for the purpose of creating provisions.<br />
f) Abroad, there are mainly compensation-linked defined<br />
benefit schemes with and without a link to the period of service<br />
with the company. The obligations are financed by provisions<br />
and are also proportionately fund-backed or insurance-backed<br />
by means of employee as well as employer contributions.<br />
g) The company pension scheme of DB Schenker Rail (UK)<br />
is essentially a defined benefit pension scheme (linked to salary<br />
and length of service) within the British “Railway Pension<br />
Scheme.” The costs of the pension scheme are shared between<br />
the employer and the employee in the ratio 60 : 40 and respectively<br />
recognized in the balance sheet. The plan assets are<br />
managed by an independent trustee. The most recent actuarial<br />
valuation of assets and obligations in the plan for the purpose<br />
of meeting the legal requirements with regard to the plan<br />
members was carried out as of December 31, 2007.<br />
h) Within DB Arriva, there are mainly defined benefit retirement<br />
benefit commitments. By far the most important defined<br />
benefit plans (related to salary and length of service) relates<br />
to employees of DB Arriva within the “Railway Pension Scheme”<br />
in Great Britain. The costs of the pension scheme are shared<br />
between the employer and the employee in the ratio 60 : 40 and<br />
respectively recognized in the balance sheet. The corresponding<br />
pension obligations are to a large extent covered by fund assets.<br />
Under a franchise agreement, Arriva Trains Wales Limited<br />
and XC Trains Limited pay contributions to the British “Railway<br />
Pension Scheme” for employees loaned for the period of the<br />
agreement (franchise period). Under IAS 19, the plan assets are<br />
therefore shown with the present value of the expected contributions<br />
in accordance with the contribution payment plan for<br />
the duration of the franchise. The present value of the defined<br />
benefit obligations is determined by the extent of the present<br />
value of the expected future service cost during the franchise.<br />
The “Arriva Passenger Services Pension Plan” is another major<br />
defined benefit pension plan. A cap was imposed in the <strong>2010</strong> financial<br />
year with regard to future salary increases. This change has<br />
been classified as a plan reduction in accordance with IAS 19,<br />
and has accordingly been recognized directly in the income<br />
statement. This has meant that, in the <strong>2010</strong> financial year, a<br />
profit of € 39.8 million from the plan reduction was recognized<br />
in connection with the decline in defined benefit obligations.<br />
In addition, individual companies of DB Arriva also issued<br />
defined contribution retirement benefit commitments to their<br />
employees. Under such arrangements, the employer does not<br />
enter into any obligations apart from paying contributions to<br />
an external benefit scheme. The extent of the future pension<br />
benefits depends exclusively on the amount of contributions<br />
paid to the external benefit scheme, including the income generated<br />
by investing these contributions.<br />
In addition, some contributions have also been paid to social<br />
pension funds within the context of statutory regulations (government<br />
schemes). DB Arriva is also involved in some joint plans of<br />
several employers.<br />
The figures stated for pension provisions in the balance<br />
sheet are detailed in the following:<br />
[ € million ] <strong>2010</strong> 2009<br />
Funded obligations 2,907 1,417<br />
Unfunded obligations 1,937 1,687<br />
TOTAL OBLIGATIONS<br />
AS OF DEC 31 4,844 3,104<br />
Fair value of plan assets<br />
as of Dec 31 1) –2,442 –1,010<br />
Unrecognized actuarial losses –464 –358<br />
Unrecognized past service cost 0 0<br />
Amount not recognized as an asset<br />
due to the limitation of IAS 19.58 0 0<br />
NET LIABILITY RECOGNIZED<br />
IN THE BALANCE SHEET 1,938 1,736<br />
1)<br />
Plus € 4 million (previous year: € 24 million) realized as pension asset.
| CONSOLIDATED FINANCIAL STATEMENTS<br />
| Notes<br />
219<br />
Significant pension obligations were taken on as part of the acquisition<br />
of Arriva. The increase in the overall obligations and the fair<br />
value of the plan assets are essentially attributable to this acquisition.<br />
The initial integration of Arriva has resulted in an increase<br />
of € 1,556 million in the DBO and an increase of € 1,163 million in<br />
plan assets.<br />
The total pension commitment has developed as follows:<br />
[ € million ] <strong>2010</strong> 2009<br />
Obligations as of Jan 1 3,104 2,581<br />
Current service cost, excluding<br />
employee contributions 97 74<br />
Employee contributions 11 3<br />
Interest expense 152 121<br />
Pensions paid –115 –92<br />
Past service costs 2 4<br />
Plan settlements of retirement<br />
benefit obligations –2 0<br />
Plan cuts – 44 –1<br />
Transfers 36 14<br />
Changes in the scope of<br />
consolidation 1,560 4<br />
thereof additions 1,560 4<br />
thereof disposals 0 0<br />
Actuarial gains (–)/losses 42 320<br />
Currency effects 1 76<br />
OBLIGATIONS AS OF DEC 31 4,844 3,104<br />
The development of the plan assets is detailed in the following:<br />
[ € million ] <strong>2010</strong> 2009<br />
Fair value of plan assets as of Jan 1 1,010 813<br />
Employer contributions 56 31<br />
Employee contributions 10 1<br />
Expected return on plan assets 71 41<br />
Pensions paid –59 –40<br />
Plan settlements of retirement<br />
benefit obligations – 1 0<br />
Plan cuts –2 0<br />
Transfers 57 18<br />
Changes in the scope of<br />
consolidation 1,163 0<br />
thereof additions 1,163 0<br />
Actuarial gains (–)/losses 148 88<br />
Currency effects – 11 58<br />
FAIR VALUE OF PLAN ASSETS<br />
AS OF DEC 31 1) 2,442 1,010<br />
1)<br />
Plus € 4 million (previous year: € 24 million) realized as pension asset.<br />
The reported plan assets are broken down as follows:<br />
[ € million ] <strong>2010</strong> 2009<br />
Stocks and other securities 1,729 750<br />
Interest-bearing securities 312 142<br />
Real estate or other<br />
self-used assets 4 3<br />
Reinsurance 88 52<br />
Other assets 313 87<br />
2,446 1,034<br />
thereof realized as<br />
pension asset –4 –24<br />
2,442 1,010<br />
The actual income from plan assets amounted to € 219 million<br />
(previous year: income of € 129 million).
220<br />
| DEUTSCHE BAHN GROUP<br />
Changes in the net pension provisions are detailed in the following:<br />
[ € million ] <strong>2010</strong> 2009<br />
Provision of Jan 1 1,736 1,649<br />
Pension expenses 158 166<br />
Employer contribution –56 –32<br />
Pensions paid –56 –52<br />
Transfers –23 –4<br />
Changes in the scope of consolidation 174 4<br />
thereof additions 174 4<br />
thereof disposals 0 0<br />
Currency effects 5 5<br />
PROVISION AS OF DEC 31 1,938 1,736<br />
The expenses to be stated in the income statement are detailed<br />
in the following:<br />
[ € million ] <strong>2010</strong> 2009<br />
Amortization of unrealized profits (–)/losses 20 7<br />
Service cost, excluding employee contributions 97 74<br />
Employee contributions 1 2<br />
Interest expense 152 121<br />
Past service cost 2 4<br />
Expected return on plan assets –71 –41<br />
Plan cuts –42 –1<br />
Result on transfer of retirement benefit obligations –1 0<br />
Asset ceiling 0 0<br />
PENSION EXPENSE 158 166<br />
The interest expense and expected income from the plan assets<br />
are recorded under financial result.<br />
The expected income from plan assets has been derived<br />
on the basis of the income actually generated in the past.<br />
All other items are recognized under personnel expenses.
| CONSOLIDATED FINANCIAL STATEMENTS<br />
| Notes<br />
221<br />
The actuarial parameters used for assessing the value of most<br />
of the pension provision are set out in the following:<br />
[%] <strong>2010</strong> 2009<br />
Discount rate 4.25 1 ) /5.25 2) 4.75 1) /5.50 2)<br />
Expected rate of salary increases 2.50 /4.50 2.50<br />
Expected medical cost trend rate 0.00 0.00<br />
Expected rate of pension increases (dependent on staff group) 2.00 /2.80 2.00 /3.70<br />
Expected average staff turnover 2.67 2.67<br />
Expected return on plan assets 1.25 –11.00 1.25–7.30<br />
1)<br />
Domestic and foreign (excluding Great Britain)<br />
2)<br />
Great Britain<br />
The 2005 G mortality tables of Professor Dr. Klaus Heubeck<br />
have been used for valuing the pension obligations for the<br />
German Group companies. Country-specific mortality tables<br />
have been used for valuing the pension obligations of the other<br />
Group companies.<br />
In the 2011 financial year, direct pension payments are expected<br />
to be € 63 million, and payments into plan assets are expected<br />
to be € 53 million.<br />
[ € million ] <strong>2010</strong> 2009 2008 2007 2006<br />
Present value of pension obligation as of Dec 31 4,844 3,104 2,581 2,746 1,764<br />
Fair value of plan assets as of Dec 31 –2,442 –1,010 –813 –1,359 –168<br />
DEFICIT 2,402 2,094 1,768 1,387 1,596<br />
Experience-based adjustment of<br />
retirement benefit obligations –85 91 3 –11 64<br />
Experience-based adjustment of plan assets –148 –88 368 5 4<br />
(33) Other provisions<br />
As of December 31 [ € million ]<br />
Environmental Construction and<br />
Staff-related Decommissioning Other provisions<br />
Total<br />
protection<br />
provisions<br />
project risks<br />
provisions<br />
provisions<br />
provisions<br />
<strong>2010</strong> 2009 <strong>2010</strong> 2009 <strong>2010</strong> 2009 <strong>2010</strong> 2009 <strong>2010</strong> 2009 <strong>2010</strong> 2009<br />
As of Jan 1 1,534 2,120 63 79 1,540 1,146 383 359 2,899 2,837 6,419 6,541<br />
Currency translation differences 0 0 0 0 3 2 0 0 5 3 8 5<br />
Changes in the scope of<br />
consolidation 1 3 0 0 1 12 0 0 157 10 159 25<br />
thereof additions 1 3 0 0 1 12 0 0 158 10 160 25<br />
thereof disposals 0 0 0 0 0 0 0 0 – 1 0 –1 0<br />
Amounts used – 49 –53 – 3 –6 –298 –343 – 4 –3 – 543 –459 – 897 –864<br />
Unused amounts reversed –1 –600 –6 –14 – 391 –16 – 32 –3 –489 – 562 –919 –1,195<br />
Reclassifications – 1 –1 0 0 26 –3 0 0 –42 –5 – 17 –9<br />
Additional amounts provided 2 4 2 1 349 679 9 12 980 1,023 1,342 1,719<br />
Compounding /discounting 4 61 2 3 97 63 18 18 40 52 161 197<br />
AS OF DEC 31 1,490 1,534 58 63 1,327 1,540 374 383 3,007 2,899 6,256 6,419
222<br />
| DEUTSCHE BAHN GROUP<br />
The following table breaks down the other provisions into<br />
current and non-current amounts, and also details their estimated<br />
residual maturity:<br />
[ € million ] Residual maturity Total<br />
Less than<br />
1–2<br />
2–3<br />
3 – 4<br />
4 – 5<br />
More than<br />
Total more<br />
1 year<br />
years<br />
years<br />
years<br />
years<br />
5 years<br />
than 1 year<br />
AS OF DEC 31, <strong>2010</strong><br />
Environmental protection<br />
provisions 103 95 106 101 101 984 1,387 1,490<br />
Construction and project risks<br />
provisions 25 11 7 7 6 2 33 58<br />
Staff-related provisions 329 195 134 94 115 460 998 1,327<br />
Decommissioning provisions 9 0 0 0 0 365 365 374<br />
Other provisions 2,047 499 172 86 67 136 960 3,007<br />
TOTAL 2,513 800 419 288 289 1,947 3,743 6,256<br />
AS OF DEC 31, 2009<br />
Environmental protection<br />
provisions 102 95 97 102 101 1,037 1,432 1,534<br />
Construction and project risks<br />
provisions 28 13 10 3 4 5 35 63<br />
Staff-related provisions 384 244 170 106 139 497 1,156 1,540<br />
Decommissioning provisions 18 0 0 0 0 365 365 383<br />
Other provisions 1,897 552 145 134 44 127 1,002 2,899<br />
TOTAL 2,429 904 422 345 288 2,031 3,990 6,419<br />
PROVISIONS FOR ENVIRONMENTAL PROTECTION<br />
Of the figure stated for environmental protection provisions,<br />
€ 1,474 million (previous year: € 1,518 million) relate to remedial<br />
action obligations of DB <strong>AG</strong>. In order to take account of the<br />
remedial action obligations recognized in the environmental<br />
protection provisions, DB <strong>AG</strong> has set up the following programs<br />
a 4-stage soil decontamination program<br />
a 3-stage sewerage network program<br />
a 2-stage landfill shut-down program<br />
These measures will ensure that the work on investigating and<br />
carrying out remedial action will be systematic, cost-efficient<br />
and consistent with the legal situation. In the 4-stage soil<br />
decontamination program, the contamination in the soil and/<br />
or groundwater is localized using the following stages: historical<br />
investigation, rough examination and detailed analysis.<br />
The program involves a feasibility study, implementation and<br />
approval planning as well as remedial action, and due consideration<br />
is given to technical and legal requirements for the<br />
remedial action which aims to ensure appropriate utilization.<br />
The 3-stage sewerage network program aims to remedy any<br />
contamination of soil and/or groundwater resulting from leaks.<br />
The program also involves a plan to optimize the existing sewerage<br />
network to ensure that it is capable of meeting future<br />
requirements and to ensure that the need to take remedial action<br />
can be limited to this future network. The network which is not<br />
utilized will be decommissioned.<br />
The 2-stage landfill program will guarantee that landfill<br />
sites on rail property are identified and measured in a standard<br />
manner, and that these landfill sites will be decommissioned in<br />
accordance with the Landfill Regulation (Deponieverordnung;<br />
DepV)/Technical Instructions for Residential Area Waste (Technische<br />
Anleitung Siedlungsabfall; TASi) and the German Federal<br />
Soil Protection Act (Bundesbodenschutzgesetz; BBodSchG).<br />
The term of the provision for existing ecological legacy<br />
contamination is unchanged (until 2028) as a result of the longterm<br />
periods applicable for remedial action.
| CONSOLIDATED FINANCIAL STATEMENTS<br />
| Notes<br />
223<br />
STAFF-RELATED PROVISIONS<br />
(34) Deferred income<br />
[ € million ] <strong>2010</strong> 2009<br />
Obligations under employment<br />
contracts 804 1,043<br />
Costs of early retirement /<br />
part-time working in the run-up<br />
to retirement 252 257<br />
Service anniversary provisions 110 122<br />
Other 161 118<br />
TOTAL 1,327 1,540<br />
The staff-related provisions include obligations which result from<br />
the demand of many employees under labor law and the willingness<br />
of DB <strong>AG</strong> not to terminate employment contracts for operational<br />
reasons before the end of 2023. In such cases, DB Group<br />
will incur losses in the form of personnel expenses which will<br />
have to be borne until the employment contract is terminated<br />
or the employee is placed with another company; no reciprocal<br />
benefit will be provided in return for these costs. DB <strong>AG</strong> has set<br />
up a separate subsidiary, namely DB JobService GmbH, in order<br />
to absorb employees who have been made redundant.<br />
The provisions set aside to cover early retirement obligations<br />
and semi-retirement cover the obligations arising from<br />
collective bargaining agreements, and have been calculated on<br />
the basis of actuarial reports.<br />
DECOMMISSIONING PROVISIONS<br />
The decommissioning provisions refer to the company’s pro<br />
rata decommissioning obligation in relation to a joint power<br />
generation plant. The valuation of the provision is based on an<br />
unchanged discount rate of 5.0 %.<br />
OTHER PROVISIONS<br />
The other provisions comprise provisions for outstanding invoices<br />
for transport services, litigation risks, decommissioning and<br />
demolition obligations as well as third-party obligations for<br />
maintenance, potential losses as well as other real estate risks<br />
and numerous other aspects which individually are of minor<br />
significance.<br />
[ € million ] <strong>2010</strong> 2009<br />
Deferred Federal grants 1,744 2,064<br />
Deferred revenues 471 397<br />
Deferred profits on<br />
sale-and-leaseback transactions 55 67<br />
Other 245 110<br />
TOTAL 2,515 2,638<br />
Non-current share 1,895 2,096<br />
Current share 620 542<br />
The deferred Federal grants comprise mainly the interest benefit<br />
(difference between the nominal value and present value)<br />
attributable to the interest-free loans; this has developed as<br />
follows during the year under review:<br />
[ € million ] <strong>2010</strong> 2009<br />
As of Jan 1 1,789 2,061<br />
Additions 0 1<br />
Reclassifications – 38 –53<br />
Amounts released –214 –220<br />
AS OF DEC 31 1,537 1,789<br />
Of the figure shown for the reversal in the year under review,<br />
the main item of € 123 million (previous year: € 134 million) is<br />
attributable to compensation for the cumulative interest in<br />
relation to the present value of interest-free Federal loans. The<br />
remainder is attributable to the release of amortized deferrals<br />
relating to premature one-off repayments at the present value<br />
in 1999 and in 2004.<br />
Deferred revenues constitute that part of compensation<br />
which is attributable to the period after the balance sheet date.<br />
The deferred profits on sale-and-leaseback transactions<br />
relate to concourse buildings of various stations with the related<br />
retail premises as well as rolling stock.
224<br />
| DEUTSCHE BAHN GROUP<br />
NOTES TO THE CASH FLOW STATEMENT<br />
The cash flow statement shows the changes in cash and cash<br />
equivalents in the year under review, and was prepared in accordance<br />
with IAS 7 (Cash Flow Statements). The cash flows are<br />
broken down into operating activities, investing activities and<br />
financing activities. The indirect method has been used for<br />
showing cash flow from operating activities.<br />
Interest income and interest payments, dividend income<br />
as well as tax payments are stated under operating activities.<br />
Cash and cash equivalents include the cash and cash equivalents<br />
stated in the balance sheet with a residual maturity of<br />
less than three months (cash in hand, cash deposited with the<br />
Bundesbank, cash at banks and checks as well as securities).<br />
Cash flow from operating activities<br />
The cash flow from operating activities is calculated by adjusting<br />
the net profit for the period before taxes by items which are not<br />
cash-effective and by adding the change in non-current assets<br />
and liabilities (excluding financial debt). The cash flow from<br />
operating activities is then established after due consideration<br />
is given to interest and tax payments.<br />
While profit before taxes on income decreased, the increase<br />
in the cash inflow from operating activities is mainly attributable<br />
to a much lower result generated by the disposal of property,<br />
plant and equipment and intangible assets, a reduced result of<br />
non-cash expenses and income, the increase in trade accounts<br />
payable as well as the decline in taxes on income while trade<br />
accounts receivables increased significantly.<br />
The considerable increase in the outflow of cash from investing<br />
activities is mainly attributable to the outflows for the acquisition<br />
of Arriva and higher outflows for investments in property,<br />
plant and equipment in conjunction with a simultaneous increase<br />
in the inflows from investing grants.<br />
When changes take place in the scope of consolidation as<br />
a result of the acquisition or sale of companies, the acquisition<br />
price which is paid (excluding any liabilities which are transferred)<br />
less the acquired or sold financial resources are stated as cash<br />
flow from investing activities. The other effects of the acquisition<br />
or sale on the balance sheet are eliminated in the corresponding<br />
items of the three categories.<br />
Cash flow from financing activities<br />
The cash flow from financing activities is due to the net inflows<br />
and outflows attributable to issued bonds, bank loans and<br />
other loans which have been raised as well as inflows attributable<br />
to the raising of and/or outflows for the redemption of<br />
Federal loans.<br />
The increase in the inflow of cash from financing activities<br />
is mainly attributable to the net increase in inflows from the<br />
raising of funds. There has been a considerable increase in net<br />
inflows from issuing bonds compared with the previous year,<br />
and the net outflows from the redemption and repayment of<br />
the Federal loans has increased further compared with the<br />
previous year.<br />
NOTES TO THE SEGMENT REPORT<br />
Cash flow from investing activities<br />
The cash flow from investing activities is calculated as the inflow<br />
of funds attributable to the disposal of property, plant and<br />
equipment and intangible assets as well as investment grants,<br />
and the outflow of funds for capital spending in property, plant<br />
and equipment and intangible assets as well as non-current<br />
financial assets.<br />
Inflow of funds attributable to investment grants are shown<br />
under investing activities, because there is a close relationship<br />
between investment grants which are received and the outflows<br />
of funds for capital spending in property, plant and equipment.<br />
Segment reporting has been prepared in accordance with IFRS 8<br />
(Operating Segments). DB Group has identified its operating<br />
segments on the basis of internal management reporting; the<br />
segmentation of the divisions is based on the services rendered<br />
by the various divisions. In this connection, management<br />
reporting is addressed to the Group Management Board in its<br />
function as the primary decision maker. Management reporting<br />
in DB Group is based on the accounting principles in accordance<br />
with IFRS. With regard to reconciling the segment data with the<br />
corresponding corporate data, it is accordingly mainly necessary<br />
to take account of consolidation effects. For this reason, a consolidation<br />
column is used for reconciliation purposes. The operations<br />
of the Group divisions are covered in the reporting format<br />
in line with the corporate organization structure of DB Group.<br />
The main regions covered by DB Group are detailed in the segment<br />
information based on regions.
| CONSOLIDATED FINANCIAL STATEMENTS<br />
| Notes<br />
225<br />
DB Group uses the following primary segments:<br />
a DB <strong>Bahn</strong> Long-Distance<br />
This segment comprises all cross-regional rail transport<br />
operations and other services. Most of these transport<br />
services are provided in Germany.<br />
a DB <strong>Bahn</strong> Regional<br />
This segment comprises the S-<strong>Bahn</strong> services in Berlin and<br />
Hamburg and the activities for regional passenger transport<br />
and other services. Most of these services are provided in<br />
Germany.<br />
The foreign companies are to be allocated to the<br />
DB Arriva segment starting in the 2011 financial year. Only<br />
regional transportation activities in Germany will be attributed<br />
to this segment in future.<br />
a DB <strong>Bahn</strong> Urban<br />
DB <strong>Bahn</strong> Urban segment comprises urban bus services.<br />
Most of these services are provided in Germany.<br />
Starting in the 2011 financial year, the domestic companies<br />
will be attributed to the DB <strong>Bahn</strong> Regional segment,<br />
and the international companies will be attributed to the<br />
DB Arriva segment. The previous DB <strong>Bahn</strong> Urban segment<br />
will no longer be applicable and will not be replaced.<br />
a DB Arriva<br />
In the year under review, only the activities of the new acquisition<br />
Arriva have been combined in the DB Arriva segment.<br />
In the 2011 financial year, the international regional<br />
transport activities which previously had been allocated to<br />
the DB <strong>Bahn</strong> Urban segment and the DB <strong>Bahn</strong> Regional<br />
segment will be transferred to the DB Arriva segment.<br />
a DB Schenker Rail<br />
This segment pools the activities for rail freight transport<br />
services. It operates primarily in Germany, Denmark, the<br />
Netherlands, Italy, Great Britain, Poland and Spain.<br />
a DB Schenker Logistics<br />
The main player in DB Schenker Logistics segment is Schenker<br />
as a logistics service provider with global activities involving<br />
freight forwarding, transport and other services in commodity<br />
and product transport.<br />
a DB Netze Track<br />
This segment is responsible for installing, maintaining and<br />
operating the complete track-related rail infrastructure in<br />
Germany.<br />
a DB Netze Stations<br />
This segment comprises the operation, development and<br />
marketing of passenger stations and retail facilities in stations<br />
in Germany.<br />
a DB Services<br />
DB Services segment provides all types of services, mainly<br />
in the fields of transport, logistics, information technology<br />
and telecommunications. The companies in this segment<br />
mainly render their services within the Group.<br />
a Subsidiaries/Other<br />
DB <strong>AG</strong> and DB ML <strong>AG</strong> with their numerous management,<br />
financing and service functions in their capacity as the management<br />
holding of DB Group are shown in this segment.<br />
In addition, this segment also comprises DB Energie GmbH,<br />
DB ProjektBau GmbH and the other subsidiaries and<br />
remaining activities.<br />
a Consolidation<br />
The data concerning the segments are shown after intrasegment<br />
relations have been eliminated. The transactions<br />
between the segments (inter-segment relations) are eliminated<br />
in the column “Consolidation.” This column also<br />
includes reconciliation amounts relating to figures shown<br />
in the consolidated financial statements.<br />
The segment revenues comprise external and internal revenues,<br />
other external segment revenues as well as other internal segment<br />
revenues attributable to the operations of the segment.<br />
Inventory changes and internally produced and capitalized assets<br />
are not included in segment revenues; their effect is to reduce<br />
segment expenses.<br />
The external segment revenues consist exclusively of revenues<br />
generated by the segments with parties outside the Group.<br />
The internal segment revenues comprise revenues with other<br />
segments (intersegment revenues). Market prices are used for<br />
establishing the transfer prices for internal transactions. The<br />
segment expenses include cost of materials and personnel<br />
expenses, depreciation, impairments and reversals of impairments,<br />
as well as other operating expenses attributable to the<br />
operations of the segment.
226<br />
| DEUTSCHE BAHN GROUP<br />
Segment result (operating profit before interest) is defined as<br />
the difference between segment revenues and segment<br />
expenses, and is operating profit (EBIT) before financial result<br />
(consisting of earnings from investments accounted for using<br />
the equity method, net interest and other financial result) and<br />
taxes on income.<br />
The adjusted segment result (EBIT adjusted) is used for<br />
internal management of DB Group and its segments. Aspects<br />
which are of an exceptional nature are adjusted from segment<br />
result and operating result (EBIT). A general adjustment is<br />
recognized to reflect the income and expenses attributable to<br />
the disposal of financial instruments. An adjustment is also<br />
recognized if an individual adjustment is of an exceptional and<br />
non-operational nature and if the extent of the impact on earnings<br />
is significant.<br />
Adjusted EBITDA (earnings before interest, taxes, depreciation<br />
and amortization) is also significant for internal management<br />
purposes. This parameter is derived from adjusted EBIT,<br />
by adding the depreciation and amortization – where appropriate<br />
adjusted by the exceptional factors included in this item.<br />
Segment assets comprise property, plant and equipment,<br />
intangible assets, receivables and other assets (excluding profit<br />
and loss transfer agreements, receivables from financing and<br />
taxes on income), inventories, derivative financial instruments<br />
related to operations as well as cash and cash equivalents. The<br />
amortized goodwill resulting from the acquisition of the relevant<br />
companies is shown separately. The figures are reconciled with<br />
the figures stated in the consolidated financial statements by<br />
including the receivables from financing and receivables related<br />
to taxes on income in the column “Consolidation.”<br />
Segment liabilities comprise the provisions and operating<br />
liabilities (excluding profit and loss transfer agreements, liabilities<br />
from financing and taxes on income) as well as the derivative<br />
financial instruments (liabilities) relating to operations and<br />
available-for-sale liabilities. The figures are reconciled with the<br />
figures stated in the consolidated financial statements by<br />
including the liabilities from financing and liabilities related to<br />
taxes on income in the column “Consolidation.”<br />
Segment capital expenditures comprise capital expenditures<br />
related to intangible assets (including acquired goodwill) as<br />
well as to property, plant and equipment and, with the additions<br />
to assets attributable to company acquisitions and gross capital<br />
expenditures, cover all additions to the scope of consolidation<br />
as of the balance sheet date before the investment grants which<br />
have been received are taken into consideration.<br />
Additions to assets from changes in the scope of consolidation<br />
are shown as part of segment capital expenditures, and comprise<br />
exclusively the capital expenditures in property, plant and equipment<br />
and intangible assets, including the goodwill acquired as<br />
part of company acquisitions or included in the consolidated<br />
financial statements for the first time.<br />
The additions to assets attributable to gross capital expenditures<br />
comprise the property, plant and equipment and intangible<br />
assets acquired in the year under review by the companies in the<br />
scope of consolidation, before the additions to assets attributable<br />
to company acquisitions are taken into consideration.<br />
The net capital expenditures are based on the allocation<br />
of the assets to the legal entities, and comprise the additions<br />
to assets resulting from gross capital expenditures in property,<br />
plant and equipment as well as the intangible assets less the<br />
deducted investment grants.<br />
Depreciation refers to the property, plant and equipment<br />
attributable to the various divisions as well as the intangible<br />
assets.<br />
Impairments which are recognized constitute the amount<br />
of the impairment relating to the property, plant and equipment<br />
and the intangible assets including any goodwill included in the<br />
segment assets.<br />
Reversals of previous impairments which are recognized<br />
comprise the amount of the reversal in relation to the property,<br />
plant and equipment or the intangible assets included in segment<br />
assets.<br />
The segments are subject to the same accounting principles<br />
which are described in the section “Principles of the combined<br />
financial statements” and which are applicable for the remainder<br />
of the combined financial statements. Internal segment transactions<br />
within the Group are generally conducted on an arm’s<br />
length basis.<br />
Explanations concerning the information<br />
according to regions<br />
External revenues are stated on the basis of the registered offices<br />
of the Group company providing the service.<br />
Segment assets and non-current assets are allocated on<br />
the basis of the location of the company. The contents are<br />
determined in accordance with segment reporting. The noncurrent<br />
assets comprise intangible assets, property, plant and<br />
equipment as well as non-current receivables and other assets<br />
(excluding financial instruments, deferred tax assets, rights<br />
from insurance policies as well as assets in conjunction with<br />
benefits after termination of the employment agreement).
| CONSOLIDATED FINANCIAL STATEMENTS<br />
| Notes<br />
227<br />
Information concerning major clients<br />
In the year under review and the previous year, no single customer<br />
accounted for more than 10 % of overall revenues at DB Group.<br />
RISK MAN<strong>AG</strong>EMENT AND DERIVATIVE<br />
FINANCIAL INSTRUMENTS<br />
Derivative financial instruments are used exclusively for hedging<br />
interest, currency and energy price risks. All individual transactions<br />
correspond to on-balance-sheet or anticipated underlyings<br />
(for instance bonds, purchases of diesel fuel and electricity).<br />
The aim is to achieve qualification as an effective hedge in accordance<br />
with IAS 39. Speculation is not permitted. Ongoing market<br />
and risk assessment takes place as part of risk management.<br />
As a logistics group with international operations, DB Group is<br />
exposed to financial risks in the form of changes in interest rates<br />
and exchange rates. In addition, there are also energy price risks<br />
on the procurement side as a result of fluctuations in the prices<br />
of diesel fuel and electricity. One of the aspects of corporate<br />
policy is to actively manage and thus limit these risks by means<br />
of the use of derivative financial instruments.<br />
DB <strong>AG</strong> with its central Group Treasury is responsible for all<br />
financing and hedging transactions of DB Group. It cooperates<br />
with the subsidiaries to identify, evaluate and control financial<br />
and energy price risks. At regular intervals, the Management<br />
Board is informed of major financial risks and receives a schedule<br />
of all financial instruments as well as the impact on results and<br />
the balance sheet.<br />
The Management Board of DB <strong>AG</strong> has defined principles for<br />
risk management. The guidelines for Group financing and for<br />
the internal control system contain binding rules for the use of<br />
derivative financial instruments for managing interest rate and<br />
foreign exchange risks and the risks of energy price changes,<br />
as well as the procedure for dealing with related counterparty<br />
default risks. In the structure and procedure organization, there<br />
is a clear functional and organizational segregation between<br />
scheduling and trading on the one hand (front office) as well as<br />
settlement and monitoring on the other (back office). Group<br />
Treasury operates on the global financial markets using the<br />
minimum requirements applicable for risk management (Mindestanforderungen<br />
an das Risikomanagement; MaRisk) of the<br />
banks prepared by the Federal Financial Supervisory Authority<br />
(Bundesanstalt für Finanzdienstleistungsaufsicht; BaFin), and<br />
is subject to regular internal and external control.<br />
Interest rate risks<br />
In line with the length of time that assets are tied up, the financial<br />
requirement is covered mainly by issuing long-term and<br />
fixed-interest bonds. Interest rate management comprises a<br />
comparatively low amount of variable interest for optimizing<br />
interest costs. Interest rate derivatives such as interest rate<br />
swaps, caps, floors and collars are used for managing the fixedfloating<br />
ratio.<br />
In accordance with IFRS 7, existing interest rates are detailed<br />
by means of a sensitivity analysis which investigates the effects<br />
of theoretical changes in market interest rates on results and<br />
shareholders’ equity.<br />
The sensitivity analysis which has been carried out has<br />
taken account of the following financial instruments:<br />
a Derivatives designated in cash flow hedges (interest hedges<br />
and interest-currency hedges) have an impact on the hedge<br />
reserve in shareholders’ equity and are therefore taken into<br />
consideration in the sensitivity calculations relating to<br />
shareholders’ equity;<br />
a Financial instruments with a variable return have an impact<br />
on net interest income. This is applicable to variable-income<br />
interest-currency swaps as well as variable-rate loans/<br />
finance leases;<br />
a Cash at banks and current borrowings/deposits with banks<br />
have an impact on net interest income.<br />
If the level of market interest rates for the exposure had been<br />
100 basis points higher (lower) as of the balance sheet date,<br />
the result would have been affected as follows:<br />
[ € million ] Changes in market level of interest rates<br />
2009<br />
+100 BP 1 ) – 100 BP 1 ) + 100 BP 1) – 100 BP 1)<br />
Impact on total result –13 + 15 –4 +4<br />
thereof recognized in the statement of income –1 + 1 –1 +1<br />
thereof covered directly in equity –12 +14 –3 +3<br />
1)<br />
Basis points
228<br />
| DEUTSCHE BAHN GROUP<br />
Foreign currency risks<br />
The foreign currency risks are attributable to financing measures<br />
and operating activities.<br />
In order to avoid interest rate and foreign currency risks,<br />
the foreign currency bonds issued within the framework of Group<br />
financing are converted into Euro liabilities by means of crosscurrency<br />
swaps. However, it is not necessary for such bonds to<br />
be converted in individual cases if there is a guarantee that the<br />
bond can be serviced out of inflows of foreign currency payments.<br />
Group Treasury extends loans to foreign subsidiaries in their<br />
functional currency. These positions are normally hedged with<br />
the aid of interest-currency swaps.<br />
We have international operations with our activities in the<br />
Transport and Logistics division, and are thus exposed to operational<br />
exchange rate risks. In order to minimize these risks, the<br />
subsidiaries take out internal foreign exchange transactions with<br />
Group Treasury and hedge all major foreign currency positions<br />
in their functional currency. Group Treasury in turn hedges its<br />
open foreign currency positions by way of opposite transactions<br />
on the financial markets. In exceptional cases and to a limited<br />
extent, subsidiaries are permitted to hedge foreign currency<br />
positions with banks themselves.<br />
In order to present foreign currency risks, IFRS 7 requires a sensitivity<br />
analysis which investigates the effects of theoretical changes<br />
in foreign currency relations on result and shareholders’ equity.<br />
The currency sensitivity analysis is based on the following<br />
assumptions:<br />
a The cross-currency swaps which are concluded and the<br />
current currency transactions are always allocated to original<br />
underlyings.<br />
a All major foreign currency positions arising from operating<br />
activities are always 100 % hedged. If exchange rate changes<br />
are 100 % hedged, they do not have any impact on results<br />
or capital.<br />
a Foreign currency risks can only occur if a 100 % hedge does<br />
not exist in justified exceptional cases; for instance if a conservative<br />
estimate is made for hedge volumes for anticipated<br />
foreign currency cash flows in order to avoid overhedging.<br />
a On-balance-sheet foreign currency risks may result from<br />
energy price hedging which is not denominated in the<br />
respective functional currency.<br />
If the following foreign currencies for currency hedges had<br />
weakened (or strengthened) by 10 % as of the balance sheet<br />
date, the result would have been affected as follows:<br />
[ € million ] Appreciation of foreign currency by<br />
<strong>2010</strong> 2009<br />
+10% –10% + 10 % –10 %<br />
GBP –4 +5 +3 –3<br />
CAD +1 –1<br />
PLN +22 –22<br />
USD +2 –2<br />
CHF –3 +4<br />
DKK –2 +2<br />
DB Group has numerous equity investments in foreign subsidiaries,<br />
whose net assets are exposed to a translation risk. This<br />
translation risk is not perceived to be a foreign currency risk for<br />
the purposes of IFRS 7, and is not hedged.<br />
Energy price risks<br />
DB Group is one of the largest consumers of electricity in Germany.<br />
In addition, the Group also requires considerable volumes<br />
of diesel fuel. The high energy procurement volume and the<br />
volatility of electricity and mineral oil markets result in substantial<br />
earnings risks, which are continuously monitored.<br />
The Energy Price Risk Management Committee (ERMC) is<br />
responsible for managing and minimizing these risks; this committee<br />
is responsible for ensuring the implementation of the<br />
risk policy of DB Group specifically with regard to energy price<br />
risks. The ERMC takes decisions with regard to specific hedging<br />
strategies and measures in which financial and energy derivatives<br />
are used.
| CONSOLIDATED FINANCIAL STATEMENTS<br />
| Notes<br />
229<br />
Swaps relating to the commodities underlying the price formulae<br />
(coal and heating oil) are used as hedges for the risks of price<br />
changes for sourcing electricity. Diesel price risks are for instance<br />
limited by taking out diesel swaps (hybrid hedges of diesel price<br />
and currency risks and individual hedges of currency risks are<br />
possible in exceptional cases).<br />
Energy price risks are quantified by means of sensitivity<br />
analyses in accordance with IFRS 7. These provide information<br />
concerning the effects of theoretical energy price changes on<br />
result and shareholders’ equity (in relation to the balance sheet<br />
exposure on the balance sheet date).<br />
The following assumptions have been made for performing the<br />
sensitivity analyses:<br />
a In the case of energy price swaps, the effective part is<br />
recognized in shareholders’ equity, and the ineffective part<br />
is recognized in the income statement.<br />
a If options are used (collars), the intrinsic value constitutes<br />
the effective part of the hedge, so that the intrinsic value<br />
is shown in shareholders’ equity. On the other hand, the<br />
fair value is not part of the hedge, and is shown in the<br />
income statement.<br />
If the energy prices at the end of the year had been 10 % lower<br />
(or higher), the result would have been affected as follows:<br />
[ € million ] Change in market prices of<br />
<strong>2010</strong> 2009<br />
+10 % –10% +10% –10%<br />
Impact on total result + 89 –89 +43 –43<br />
thereof recognized in the consolidated statement of income +1 – 1 +0 –0<br />
Diesel +1 – 1 +0 –0<br />
Hard coal + 0 –0 +0 –0<br />
HSL + 0 – 0 +0 –0<br />
thereof covered directly in equity + 88 –88 +43 –43<br />
Diesel + 73 –73 +30 –30<br />
Hard coal + 9 – 9 +11 –11<br />
HSL +6 – 6 +2 –2<br />
Counterparty default risk of interest, currency<br />
and energy derivatives<br />
Counterparty default risk is defined as possible losses due to<br />
the default of counterparties (“worst-case scenario”). It represents<br />
the replacement costs (at market values) of the derivative<br />
financial instruments for which DB Group has claims against<br />
contract partners. The counterparty default risk is monitored<br />
and actively managed by way of strict requirements relating to<br />
the creditworthiness of the counterparty at the point at which<br />
the transactions are concluded and also throughout the entire<br />
life of the transactions, and also by way of defining risk limits.<br />
The maximum counterparty default risk resulting from the<br />
derivative financial instruments as of the balance sheet date is<br />
€ 375 million (previous year: € 62 million). The increase in the<br />
counterparty default risks compared with the previous year is<br />
mainly attributable to the development in value of the crosscurrency<br />
swaps and the energy price derivatives. The maximum<br />
individual risk – default risk in relation to individual contract<br />
partners – is € 115 million, and exists in relation to a bank with<br />
a Moody’s rating of Aa3. For transactions with terms of more<br />
than one year, all banks which are exposed to a counterparty<br />
default risk have at least a Moody’s rating of A2.<br />
Liquidity risk<br />
Liquidity management involves maintaining adequate liquid<br />
assets, constantly checking the commercial paper market for<br />
ensuring adequate market liquidity and depth and the constant<br />
availability of financial resources via guaranteed credit facilities<br />
of banks (see Note (28)).<br />
The following table shows the contractually agreed undiscounted<br />
interest payments and redemption payments relating<br />
to the original financial liabilities as well as the derivative<br />
financial instruments with a positive and negative fair value of<br />
DB Group:
230<br />
| DEUTSCHE BAHN GROUP<br />
MATURITY ANALYSIS OF FINANCIAL LIABILITIES<br />
As of December 31, <strong>2010</strong><br />
[ € million ]<br />
NON-DERIVATIVE<br />
FINANCIAL LIABILITIES<br />
Fixed /<br />
variable<br />
interest<br />
2011 2012 2013–2015 2016–2020 2021 ff.<br />
Redemption<br />
Fixed / Redemp-<br />
Fixed /<br />
variable<br />
tion variable<br />
interest<br />
interest<br />
Redemption<br />
Fixed / Redemp-<br />
Fixed /<br />
variable<br />
tion variable<br />
interest<br />
interest<br />
Redemption<br />
Federal loans 18 439 9 431 – 799 – 1,213 – 974<br />
Bonds 475 1,371 419 645 1,076 1,980 1,119 6,302 154 1,600<br />
Commercial paper 0 42 – – – – – – – –<br />
Bank liabilities 26 157 23 84 59 63 55 433 16 407<br />
EUROFIMA loans 42 – 42 434 83 519 40 – 8 200<br />
Finance lease liabilities 75 145 67 196 108 703 64 271 108 109<br />
Other financial liabilities – 11 – – – 3 – 3 – –<br />
Trade liabilities – 4,286 – 33 – 88 – 156 – –<br />
Other miscellaneous<br />
liabilities – 3,109 – 21 – 12 – 17 – –<br />
DERIVATIVE FINANCIAL<br />
LIABILITIES (NET/GROSS<br />
SETTLED)<br />
Interest /currency<br />
derivatives connected<br />
with cash flow hedges 95 904 66 118 150 577 176 1,141 – –<br />
Interest derivatives not<br />
connected with hedges – – – – – – – – – –<br />
Interest derivatives<br />
connected with cash<br />
flow hedges 2 – 2 – 6 – 4 – 0 –<br />
Currency derivatives<br />
connected with cash<br />
flow hedges – 471 – – – – – – – –<br />
Currency derivatives not<br />
connected with hedges – 325 – 6 – 1 – – – –<br />
Energy prices<br />
derivatives 20 – 2 – 1 – – – – –<br />
DERIVATIVE FINANCIAL<br />
ASSETS (GROSS SETTLED)<br />
Interest /currency<br />
derivatives connected<br />
with cash flow hedges 29 226 21 93 40 405 9 54 – –<br />
Interest derivatives not<br />
connected with hedges – – – – – – – – – –<br />
Interest derivatives<br />
connected with cash<br />
flow hedges – – – – – – – – – –<br />
Currency derivatives<br />
connected with cash<br />
flow hedges – 791 – – – – – – – –<br />
Currency derivatives not<br />
connected with hedges – 175 – 6 – 1 – – – –<br />
Energy prices<br />
derivatives – – – – – – – – – –
| CONSOLIDATED FINANCIAL STATEMENTS<br />
| Notes<br />
231<br />
As of December 31, <strong>2010</strong><br />
[ € million ]<br />
V O L U N TA RY<br />
INFORMATION ABOUT<br />
DERIVATIVES<br />
DERIVATIVE FINANCIAL<br />
ASSETS (NET SETTLED)<br />
Fixed /<br />
variable<br />
interest<br />
2011 2012 2013 –2015 2016 –2020 2021 ff.<br />
Redemption<br />
Fixed / Redemp-<br />
Fixed / Redemp-<br />
variable<br />
tion variable<br />
tion<br />
interest<br />
interest<br />
Fixed / Redemption<br />
Fixed / Redemp-<br />
variable<br />
variable<br />
tion<br />
interest<br />
interest<br />
Interest /currency<br />
derivatives connected<br />
with cash flow hedges – – – – – – – – – –<br />
Interest derivatives not<br />
connected with hedges – – – – – – – – – –<br />
Interest derivatives<br />
connected with cash<br />
flow hedges – – – – – – – – – –<br />
Currency derivatives<br />
connected with cash<br />
flow hedges – – – – – – – – – –<br />
Currency derivatives not<br />
connected with hedges – – – – – – – – – –<br />
Energy prices<br />
derivatives 50 – 37 – 57 – 8 – – –<br />
I N F L O W O F F U N D S<br />
FROM GROSS SETTLED<br />
DERIVATIVE FINANCIAL<br />
INSTRUMENTS<br />
Interest /currency<br />
derivatives connected<br />
with cash flow hedges –100 –1,111 – 56 –205 –115 –1,044 – 98 –1,248 – –<br />
Interest derivatives not<br />
connected with hedges – – – – – – – – – –<br />
Interest derivatives<br />
connected with cash<br />
flow hedges – – – – – – – – – –<br />
Currency derivatives<br />
connected with cash<br />
flow hedges – –1,259 – – – – – – – –<br />
Currency derivatives not<br />
connected with hedges – –498 – –12 – – 1 – – – –<br />
Energy prices<br />
derivatives – – – – – – – – – –<br />
FINANCIAL WARRANTIES – 194 – – – – – – – –
232<br />
| DEUTSCHE BAHN GROUP<br />
MATURITY ANALYSIS OF FINANCIAL LIABILITIES<br />
As of December 31, 2009<br />
[ € million ]<br />
NON-DERIVATIVE<br />
FINANCIAL LIABILITIES<br />
Fixed /<br />
variable<br />
interest<br />
<strong>2010</strong> 2011 2012–2014 2015–2019 2020 ff.<br />
Redemption<br />
Fixed / Redemp-<br />
Fixed /<br />
variable<br />
tion variable<br />
interest<br />
interest<br />
Redemption<br />
Fixed / Redemp-<br />
Fixed /<br />
variable<br />
tion variable<br />
interest<br />
interest<br />
Redemption<br />
Federal loans 26 498 18 441 9 963 – 1,271 – 1,184<br />
Bonds 465 1,000 405 1,246 944 1,810 1,020 5,456 53 600<br />
Commercial paper – – – – – – – – – –<br />
Bank liabilities 15 87 18 8 52 14 58 407 24 400<br />
EUROFIMA loans 35 – 35 – 93 953 – – – –<br />
Finance lease liabilities 66 185 57 83 110 583 61 327 24 103<br />
Other financial liabilities – 18 – 1 – 2 – – – –<br />
Trade liabilities – 3,262 – 29 – 77 – 178 – –<br />
Other miscellaneous<br />
liabilities – 2,846 – 17 – 15 – 21 – –<br />
DERIVATIVE FINANCIAL<br />
LIABILITIES (NET/GROSS<br />
SETTLED)<br />
Interest /currency<br />
derivatives connected<br />
with cash flow hedges 66 – 66 1,017 66 542 12 64 – –<br />
Interest derivatives not<br />
connected with hedges – – – – – – – – – –<br />
Interest derivatives<br />
connected with cash<br />
flow hedges – – – – – – – – – –<br />
Currency derivatives<br />
connected with cash<br />
flow hedges – 547 – – – – – – – –<br />
Currency derivatives not<br />
connected with hedges – 123 – 28 – – – – – –<br />
Energy prices<br />
derivatives – 53 – 39 – 6 – – – –<br />
DERIVATIVE FINANCIAL<br />
ASSETS (GROSS SETTLED)<br />
Interest /currency<br />
derivatives connected<br />
with cash flow hedges 19 22 17 103 27 228 9 80 – –<br />
Interest derivatives not<br />
connected with hedges – – – – – – – – – –<br />
Interest derivatives<br />
connected with cash<br />
flow hedges – – – – – – – – – –<br />
Currency derivatives<br />
connected with cash<br />
flow hedges – 290 – – – – – – – –<br />
Currency derivatives not<br />
connected with hedges – 281 – 3 – 2 – – – –<br />
Energy prices<br />
derivatives – – – – – – – – – –
| CONSOLIDATED FINANCIAL STATEMENTS<br />
| Notes<br />
233<br />
As of December 31, 2009<br />
[ € million ]<br />
V O L U N TA RY<br />
INFORMATION ABOUT<br />
DERIVATIVES<br />
DERIVATIVE FINANCIAL<br />
ASSETS (NET SETTLED)<br />
Fixed /<br />
variable<br />
interest<br />
<strong>2010</strong> 2011 2012–2014 2015–2019 2020 ff.<br />
Redemption<br />
Fixed / Redemp-<br />
Fixed /<br />
variable<br />
tion variable<br />
interest<br />
interest<br />
Redemption<br />
Fixed / Redemp-<br />
Fixed /<br />
variable<br />
tion variable<br />
interest<br />
interest<br />
Redemption<br />
Interest /currency<br />
derivatives connected<br />
with cash flow hedges – – – – – – – – – –<br />
Interest derivatives not<br />
connected with hedges – – – – – – – – – –<br />
Interest derivatives<br />
connected with cash<br />
flow hedges – – – – – – – – – –<br />
Currency derivatives<br />
connected with cash<br />
flow hedges – – 0 – – – – – – – –<br />
Currency derivatives not<br />
connected with hedges – – – – – – – – – –<br />
Energy prices<br />
derivatives – – 6 – – 5 – – 4 – – – –<br />
I N F L O W O F F U N D S<br />
FROM GROSS SETTLED<br />
DERIVATIVE FINANCIAL<br />
INSTRUMENTS<br />
Interest /currency<br />
derivatives connected<br />
with cash flow hedges –73 –24 –72 – 1,013 – 64 –755 – 19 – 143 – –<br />
Interest derivatives not<br />
connected with hedges – – – – – – – – – –<br />
Interest derivatives<br />
connected with cash<br />
flow hedges – – – – – – – – – –<br />
Currency derivatives<br />
connected with cash<br />
flow hedges – – 841 – – – – – – – –<br />
Currency derivatives not<br />
connected with hedges – – 407 – –29 – –2 – – – –<br />
Energy prices<br />
derivatives – – – – – – – – – –<br />
FINANCIAL WARRANTIES – 126 – – – – – – – –<br />
This includes all instruments which were held at December 31,<br />
<strong>2010</strong> and for which payments had already been agreed. Foreign<br />
currency amounts have been translated using the spot rate<br />
applicable as of the reference date. The variable interest payments<br />
attributable to the financial instruments have been<br />
calculated on the basis of the interest rates applicable on<br />
December 31, <strong>2010</strong> (previous year on December 31, 2009).<br />
Financial liabilities which can be repaid at any time are allocated<br />
to the earliest possible time segment.<br />
The financial liabilities are opposed by cash and cash equivalents<br />
of € 1,475 million, consisting of positive account balances (50 %)<br />
and current fixed-term deposits (50 %).
234<br />
| DEUTSCHE BAHN GROUP<br />
OTHER DISCLOSURES<br />
(35) Contingent receivables and liabilities,<br />
and guarantee obligations<br />
Contingent receivables were stated as € 76 million as of<br />
December 31, <strong>2010</strong> (as of December 31, 2009: € 62 million), and<br />
mainly comprise a claim for a refund of investment grants which<br />
had been paid; however, as of the balance sheet date, the extent<br />
and due date of the claim was not sufficiently certain.<br />
The contingent liabilities are broken down as follows:<br />
[ € million ] Dec 31, <strong>2010</strong> Dec 31, 2009<br />
Contingent liabilities from<br />
Issuance and transfer of bills 1 2<br />
Provision of collateral for<br />
third-party liabilities 0 1<br />
Provision of warranties 2 2<br />
Other contingent liabilities 93 113<br />
TOTAL 96 118<br />
Other contingent liabilities also comprise risks arising from litigation<br />
which had not been stated as provisions because the<br />
expected probability of occurrence is less than 50 %.<br />
The contingencies attributable to warranties amounted to<br />
€ 188 million as of December 31, <strong>2010</strong> (as of December 31, 2009:<br />
€ 128 million). The increase is mainly attributable to the acquisition<br />
of Arriva. In addition, fixed assets with carrying amounts<br />
of € 196 million (previous year: € 131 million) were used besides<br />
others as security for loans of EUROFIMA extended to DB <strong>AG</strong>;<br />
this relates to rolling stock used at the operating companies in<br />
the segments DB <strong>Bahn</strong> Long-Distance, DB <strong>Bahn</strong> Regional and<br />
DB Schenker Rail as well as buses in the DB Arriva segment.<br />
The investigation proceedings initiated against the freight<br />
forwarding sector by the European Commission, the US Department<br />
of Justice (DOJ) and further national cartel authorities on<br />
the grounds of the suspicion of anti-competitive collusion in the<br />
field of land, ocean and air freight have been partially completed.<br />
On September 30, <strong>2010</strong>, the DOJ concluded plea agreements<br />
with Schenker <strong>AG</strong> and BAX Global Inc. for terminating the cartel<br />
proceedings pending in the USA. Schenker <strong>AG</strong> has accordingly<br />
been fined USD 3.53 million, and BAX Global Inc. has been fined<br />
USD 19.75 million. In return, the DOJ has agreed not to initiate<br />
legal proceedings against Schenker <strong>AG</strong> and BAX Global Inc. The<br />
plea agreements still have to be confirmed by the courts. In the<br />
proceedings before the EU Commission, a decision still has to<br />
be taken following the hearing in July <strong>2010</strong>. Overall, the cartel<br />
authority investigations are not expected to be concluded before<br />
the end of 2011. A class action for damages in the USA was<br />
settled for the companies of DB Group in return for the payment<br />
of USD 8.75 million and in return for the promise of various<br />
cooperation services – subject to the court approval which is<br />
still outstanding.<br />
DB Group acts as guarantor mainly for equity participations<br />
and common project units, and is subject to joint and several<br />
liability for all common project units in which it is involved.<br />
(36) Other financial obligations<br />
Capital expenditures in relation to which the company has<br />
entered into contractual obligations as of the balance sheet<br />
date, but for which no consideration has yet been received, are<br />
broken down as follows:<br />
[ € million ] 31. 12. <strong>2010</strong> 31. 12. 2009<br />
Committed capital expenditures<br />
Property, plant and<br />
equipment<br />
7,181 6,280<br />
Intangible assets 3 2<br />
Outstanding capital contributions 376 317<br />
TOTAL 7,560 6,599<br />
The increase in the order commitment for property, plant and<br />
equipment is mainly attributable to the procurement of new<br />
rolling stock as well as an increase in capital expenditures<br />
volume. In the case of some supply arrangements, there are<br />
independent admissions of guilt with regard to fulfilling the<br />
order commitment; these are opposed by claims of the same<br />
amount, backed by bank guarantees and insurance policies with<br />
maximum ratings.<br />
Of the figure shown for outstanding contribution, € 376 million<br />
(previous year: € 317 million) relates to outstanding contributions<br />
at EUROFIMA which have not been called in. Of this<br />
figure, EUROFIMA has called off € 82 million. In the Administrative<br />
Board meeting of December 17, <strong>2010</strong>, the Management<br />
Board of EUROFIMA announced that it would submit a proposal<br />
to the general meeting in March 2011 for the resolution regarding<br />
the calling off of additional capital to be reversed if the risk<br />
positions of EUROFIMA have not deteriorated significantly by<br />
that time.<br />
Various companies in DB Group have leased assets, e.g.<br />
property, buildings, technical equipment, plant and machinery<br />
as well as operational and business equipment within the framework<br />
of operating lease agreements.
| CONSOLIDATED FINANCIAL STATEMENTS<br />
| Notes<br />
235<br />
The terms of the future minimum payments arising from operating<br />
lease agreements are set out in the following table:<br />
[ € million ] <strong>2010</strong> 2009<br />
Less than 1 year 1,139 966<br />
1–2 years 790 677<br />
2–3 years 659 544<br />
3 – 4 years 513 452<br />
4 – 5 years 430 367<br />
More than 5 years 1,997 1,955<br />
TOTAL 5,528 4,961<br />
The increase is mainly attributable to the acquisition of Arriva.<br />
The minimum lease payments do not include expenses incurred<br />
in connection with using the track infrastructure.<br />
(37) Infrastructure and transport contracts<br />
The following notes and information refer to the requirements<br />
of SIC-29 (Disclosure – Service Concession Arrangements).<br />
INFRASTRUCTURE CONTRACTS<br />
In accordance with section 6 of the General Railways Act (Allgemeines<br />
Eisenbahngesetz; AEG), the rail infrastructure companies<br />
which belong to DB Group and which operate track,<br />
control systems or platforms have to have appropriate approval.<br />
This is applicable particularly for DB Netz <strong>AG</strong>, DB Station&Service<br />
<strong>AG</strong> and DB Energie GmbH.<br />
The approvals of the Federal Railway Authority (Eisenbahn-<br />
Bundesamt; EBA) for DB Netz <strong>AG</strong> and DB Station &Service <strong>AG</strong><br />
are limited until the end of December 31, 2048.<br />
The rights of the rail infrastructure companies to operate<br />
the rail infrastructure is connected to various obligations. They<br />
are required in particular to manage their operations safely,<br />
construct the rail infrastructure in a safe manner and ensure<br />
that it is maintained in a safe condition (section 4 (1) AEG). With<br />
regard to compliance with this regulation, the rail infrastructure<br />
companies of DB Group are regulated by the EBA.<br />
In addition, the rail infrastructure companies also have to<br />
observe statutory duties among others with regard to noise<br />
abatement in the case of any new and expansion projects.<br />
DB Group voluntarily participates in the “Rail noise abatement<br />
program” for existing lines.<br />
The rail infrastructure companies provide non-discriminatory<br />
access to the rail infrastructure in accordance with sections 14 et<br />
seq. AEG, and charge the train operating companies (TOC) for<br />
this access. They must comply with the requirements of the AEG<br />
and the Rail Infrastructure Utilization Ordinance (Eisenbahninfrastrukturverordnung;<br />
EIBV). Compliance with these regulations<br />
is regulated by the Federal Network Agency (Bundesnetzagentur;<br />
BNetzA).<br />
DB Netz <strong>AG</strong>, DB Station &Service <strong>AG</strong> as well as DB Energie<br />
GmbH generated total revenues of € 7,803 million in the year<br />
under review (previous year: € 7,446 million); of this figure,<br />
€ 1,910 million (previous year: € 1,628 million) was generated<br />
with non-Group customers.<br />
The assets of the rail infrastructure are the legal and economic<br />
property of the companies.<br />
TRANSPORT CONTRACTS<br />
Service licenses and similar approvals which guarantee the<br />
general public access to important economic and public facilities<br />
have been granted to companies in DB Group. This is applicable<br />
particularly for DB Regio <strong>AG</strong> as well as its subsidiaries which<br />
conduct regional rail passenger operations.<br />
DB Regio <strong>AG</strong> and its subsidiaries provide transport services<br />
on the basis of ordered-service contracts. These so-called transport<br />
contracts for local passenger transport services are signed<br />
with the organization which orders the transport services (e.g.<br />
Federal states, special-purpose association, local transport<br />
company); these contracts determine the way in which the<br />
transport service is provided and continued, and also governs<br />
the relevant compensation (concession fees) paid for the transport<br />
services.<br />
The funds necessary for this purpose are made available<br />
to the Federal states by the Federal Government in accordance<br />
with the regulations of the Regionalization Act (Regionalisierungsgesetz;<br />
RegG). The total ordering organization payment<br />
received by the subsidiaries of the DB <strong>Bahn</strong> Regional segment<br />
and DB Arriva segment, including comparable payments of<br />
international ordering organizations, amounted to € 4,370 million<br />
in the year under review (previous year: € 4,489 million)<br />
(see note (1)).<br />
In the year under review, the fact that most transport contracts<br />
include a concession fee increase by 1.5 % p. a., as well as<br />
revenues attributable to final settlements of previous years<br />
could not compensate for the effects of performance losses and<br />
cuts of the ordering organizations in the year under review.
236<br />
| DEUTSCHE BAHN GROUP<br />
The transport contracts usually run for periods of between eight<br />
and 12 years. A major transport contract will expire at the end<br />
of 2011. 75 % of the transport contracts run until at least 2016,<br />
50 % run until at least 2018 and 33 % run until at least 2021. The<br />
transport contracts can only be terminated by the ordering<br />
organization during the term of the contract for a compelling<br />
reason. After the transport contracts have expired, it is expected<br />
that the transport services will be put out to competitive tender.<br />
The companies enjoy legal and beneficial ownership of<br />
virtually all of the assets necessary for providing the services,<br />
and in particular the rolling stock. No special obligations exist<br />
after the end of the contract term.<br />
(38) Related-party disclosures<br />
The following parties are deemed to be related parties of<br />
DB Group in accordance with IAS 24 (Related-Party Disclosures):<br />
a the Federal Government in its capacity as the owner of all<br />
shares in DB <strong>AG</strong>,<br />
a the companies or enterprises subject to the control of the<br />
Federal Republic of Germany (referred to in the following<br />
as “Federal companies”),<br />
a affiliated, non-consolidated and associated companies as<br />
well as joint ventures of DB Group, as well as<br />
a the members of the Management Board and the Supervisory<br />
Board of DB <strong>AG</strong> and their close relatives.<br />
Transactions with related parties are conducted on an arm’s<br />
length basis.<br />
The figures attributable to related companies and persons<br />
are stated under the corresponding items of the “Notes to the<br />
Balance Sheet” with the designation “thereof.” Individual figures<br />
are set out in the Notes (19), (28) and (29).<br />
Details and explanations of transactions between DB Group<br />
and the Federal Republic of Germany are included in the Notes<br />
(3), (5), (9), (13), (32), (36) and (37).<br />
Significant economic relations which need to be reported<br />
separately between DB Group and related companies and persons<br />
are explained in the following:<br />
RELATIONSHIPS WITH THE FEDERAL REPUBLIC OF GERMANY<br />
[ € million ] Federal Government<br />
<strong>2010</strong> 2009<br />
SERVICES RECEIVED BY DB GROUP<br />
Purchase of goods and services 1,716 1,724<br />
Purchase of properties, buildings, track infrastructure and other assets 0 1<br />
Lease and rental payments made 0 1<br />
Licenses received 0 0<br />
Taking out loans 0 10<br />
Other services received 0 4<br />
Investment grants received 4,316 3,922<br />
Other income grants received 248 190<br />
6,280 5,852<br />
SERVICES RENDERED BY DB GROUP<br />
Sale of goods and services 281 285<br />
Sale of properties, buildings, track infrastructure and other assets 0 0<br />
Lease and rental payments received 9 9<br />
Other services rendered 118 108<br />
Repayment of loans 478 436<br />
Repayment of investment grants 67 118<br />
Repayment of other income grants 2 0<br />
955 956<br />
OTHER DISCLOSURES<br />
Unsecured receivables 88 89<br />
Unsecured liabilities 3,307 3,673<br />
Current total of guarantees received 3,200 3,067<br />
Current total of guarantees granted 0 0
| CONSOLIDATED FINANCIAL STATEMENTS<br />
| Notes<br />
237<br />
Purchases of products and services mainly comprise the fees<br />
paid to the Federal Government within the framework of the<br />
pro forma billing of the allocated civil servants as well as cost<br />
refunds for staff secondments in the service provision field.<br />
In <strong>2010</strong>, the economic recovery meant that the use of shorttime<br />
working was only necessary to a limited extent, primarily<br />
in the field of rail freight services. DB <strong>AG</strong> received a figure of<br />
€ 11 million from the Bundesagentur für Arbeit for short-time<br />
working benefit and the related social insurance contributions.<br />
In <strong>2010</strong>, the Agentur für Arbeit approved applications of<br />
DB <strong>AG</strong> for payments of around € 18 million under the Semi-<br />
Retirement Act (Altersteilzeitgesetz; AltTZG) section 3 AltTZG<br />
in conjunction with sections 4, 16 AltTZG. The claim to such<br />
payments is justified when a person is appointed to the position<br />
which has become free as a result of the semi-retirement<br />
arrangement.<br />
With effect from January 1, 2009, DB <strong>AG</strong> and the Federal<br />
Government signed a performance and financing agreement<br />
(Leistungs- und Finanzierungsvereinbarung; LuFV) with a volume<br />
of € 2.5 billion p.a. until 2013; this agreement has fundamentally<br />
reformed the financing regime for the existing network. The<br />
purpose of this agreement is to ensure that the use of Federal<br />
funds is managed in a quality-oriented manner. The aim is to<br />
improve the plannability, efficiency and transparency of funding<br />
for maintaining the infrastructure. The Federal Government<br />
undertakes to pay € 2.5 billion per annum for carrying out replacement<br />
capital expenditures in the existing network; the contribution<br />
of DB <strong>AG</strong> is € 500 million per annum. DB Group guarantees<br />
the maintenance and sales of the infrastructure. It is measured<br />
in terms of meeting the quality objectives and also providing<br />
supporting evidence for minimum replacement capital expenditures<br />
and minimum maintenance expenses (€ 1.0 billion to<br />
€ 1.25 billion p.a.). In the year under review stipulations of the<br />
LuFV regarding quality parameters were defined precisely or<br />
extended with effect from January 1, <strong>2010</strong>. More precise details<br />
were also provided with regard to supporting evidence for<br />
capital expenditures and maintenance.<br />
Further investment grants are provided for transport program<br />
measures in accordance with the Municipal Transport<br />
Financing Act (Gemeindeverkehrsfinanzierungsgesetz; GVFG)<br />
and via the Transport Infrastructure Financing Company (Verkehrsinfrastrukturfinanzierungsgesellschaft;<br />
VIFG) in accordance with<br />
the Transport Infrastructure Financing Act (Verkehrsinfrastrukturfinanzierungsgesetz;<br />
VIFGG).<br />
DB <strong>AG</strong> has been approved funds from the European Union for<br />
infrastructure projects in the fields of trans-European networks<br />
(TEN) and for the regional development of transport infrastructure<br />
(EFRE).<br />
Under the Federal economic stimulus programs I and II, the<br />
Federal Government provides around € 1.4 billion for rail infrastructure<br />
capital expenditures. The additionally provided funds<br />
from both economic stimulus programs will be used for specific<br />
measures for improving quality of the rail infrastructure. In <strong>2010</strong>,<br />
of the Federal funds of around € 1.4 billion, around € 0.5 billion<br />
was used for signing new contracts or for the adjustment of<br />
existing agreements.<br />
The grants recognized in the income statement relate mainly<br />
to payments provided by the Federal Government for covering<br />
excessive burdens borne by DB Group as a result of operating<br />
and maintaining equal-height crossings with roads of all construction<br />
authorities.<br />
Sales of products and services also comprise services for<br />
carrying severely disabled persons, persons who are working<br />
on alternative military service and Bundeswehr traffic.<br />
DB <strong>AG</strong> has repaid € 478 million loans to the Federal Government<br />
in accordance with the BSchw<strong>AG</strong>; almost all of this payment<br />
was covered by the agreed annual standard redemption<br />
payments.<br />
The liabilities due to the Federal Government comprise the<br />
extended loans, which are shown here with their present values,<br />
and other liabilities of € 371 million (previous year: € 397 million).<br />
The guarantees received from the Federal Government<br />
primarily relate to the loans received from EUROFIMA as well<br />
as the outstanding contributions and liabilities arising from<br />
collective liability of DB <strong>AG</strong> at EUROFIMA. In the first half of<br />
<strong>2010</strong>, DB <strong>AG</strong> raised a further loan of € 200 million from EUROFIMA.<br />
The guarantees which have been received include a maximum<br />
commitment of € 2,354 million of the Federal Government for<br />
loans of EUROFIMA. The loan volume amounted to € 1,153 million<br />
as of the balance sheet date.<br />
The following agreements were concluded with the Federal<br />
Government in the year under review:<br />
Seven new financing contracts were agreed with a Federal<br />
content of around € 682 million (of this figure: about € 96 million<br />
in <strong>2010</strong>). The financing agreements have different terms (ranging<br />
from one year up to ten). Financing is provided completely in<br />
the form of investment grants which do not have to be repaid.
238<br />
| DEUTSCHE BAHN GROUP<br />
For the years 2004 to 2008, DB <strong>AG</strong> has waived its entitlement to<br />
reimbursement of the costs for employees and assigned civil<br />
servants that occur by the implementation of technical, operational<br />
and organizational measures, that would lead to a reduction<br />
of personnel, as a result of the fact that employment<br />
contracts which were transferred to DB <strong>AG</strong> in accordance with<br />
section 14 (2) of the <strong>Deutsche</strong> <strong>Bahn</strong> Foundation Act (<strong>Deutsche</strong><br />
<strong>Bahn</strong> Gründungsgesetz; DBGrG) cannot be terminated (see<br />
section 21 (5) and (6) DBGrG). Starting in 2009, these claims<br />
will be settled by the Federal Government for the years 2009 to<br />
2012 with an annual amount of around € 70 million in accordance<br />
with the regulations of Section 21 (5) DBGrG. For the entire<br />
period, DB <strong>AG</strong> will receive a refund of around € 279 million.<br />
Within this context, DB <strong>AG</strong> will repay Federal loans of around<br />
€ 660 million, which were granted on the basis of the joint<br />
declaration regarding the extent of rail infrastructure capital<br />
expenditures in the year 2001 to 2003 (trilateral agreement).<br />
In line with the agreements which have been reached, interest<br />
will be charged on the loan starting January 1, 2009, and, starting<br />
in the year 2009, the loan will be repaid to the Federal Government<br />
in four annual installments of around € 165 million each.<br />
RELATIONS WITH FEDERAL COMPANIES<br />
Most of the transactions carried out in accordance with IAS 24 in<br />
the period under review and in the previous year period related<br />
to operations, and overall were of minor significance for DB Group.<br />
RELATIONS WITH AFFILIATED, NON-CONSOLIDATED<br />
COMPANIES, ASSOCIATES AND JOINT VENTURES<br />
In the year under review, DB Group purchased products and<br />
services worth € 123 million (previous year: € 189 million), mainly<br />
for purchasing passenger and freight transport services. Most<br />
of this figure, namely € 120 million (previous year: € 122 million),<br />
was attributable to transactions conducted with associates.<br />
Interest payments of € 36 million (previous year: € 71 million)<br />
were also incurred in the year under review. This figure relates<br />
almost exclusively to interest payments for the loans extended<br />
by EUROFIMA. Please refer to the details under Note (28).<br />
In the year under review, DB Group generated revenues of<br />
€ 582 million (previous year: € 795 million) from sales of products<br />
and services. The revenues were generated mainly in the<br />
DB Schenker Rail segment and relate to revenues generated by<br />
transport services which were provided.<br />
Guarantees totaling € 22 million (previous year: € 13 million)<br />
have been extended; of this figure € 22 million (previous year:<br />
€ 12 million) was attributable to joint ventures.<br />
An equivalent volume of transactions with related companies<br />
was conducted in the previous year period.<br />
RELATIONS WITH THE MAN<strong>AG</strong>EMENT BOARD<br />
AND SUPERVISORY BOARD OF DB <strong>AG</strong><br />
The following section sets out the transactions between DB Group<br />
and the members of the Management Board and the Supervisory<br />
Board, as well as the companies in which members of the Management<br />
Board or the Supervisory Board own a majority interest.<br />
[ € thousand ] <strong>2010</strong> 2009<br />
SERVICES RENDERED BY<br />
DB GROUP<br />
Sale of goods and services 16,386 14,065<br />
Trade receivables as of Dec 31 782 406<br />
SERVICES RECEIVED BY<br />
DB GROUP<br />
Purchase of goods and services 61,323 55,244<br />
Trade liabilities as of Dec 31 7,229 6,416<br />
The revenues of € 16,386 thousand (previous year: € 14,065 thousand)<br />
generated by DB Group (service provider) mainly comprise<br />
transport and freight forwarding services of DB Schenker Rail<br />
and DB Schenker Logistics segments; of this figure, € 1,666<br />
thousand (previous year: € 4,025 thousand) was generated with<br />
the SMS GmbH Group, and € 14,714 thousand (previous year:<br />
€ 10,040 thousand) was generated with the Georgsmarienhütte<br />
Holding GmbH Group.<br />
The products and services purchased by DB Group (service<br />
recipient) comprise almost entirely supplies of Georgsmarienhütte<br />
Holding GmbH Group.
| CONSOLIDATED FINANCIAL STATEMENTS<br />
| Notes<br />
239<br />
COMPENSATION OF THE MAN<strong>AG</strong>EMENT BOARD<br />
[ € thousand ] <strong>2010</strong> 2009<br />
Total compensation of the<br />
Management Board 1) 14,362 19,551<br />
Fixed 1) 6,218 5,051<br />
Variable 1) 6,294 3,738<br />
Severance payments<br />
including additional benefits 1,850 9,629<br />
Payments from deferred<br />
compensation 0 1,133<br />
Short-term 1) 10,960 17,670<br />
Long-term 1), 2) 3,402 2,537<br />
Compensation of former members<br />
of the Management Board and<br />
their surviving dependants 2,316 2,211<br />
Retirement benefit obligation in<br />
respect of former members of<br />
the Management Board and their<br />
surviving dependants 3), 4) 58,241 39,322<br />
1)<br />
Pro rata temporis: Dr. Richard Lutz (April 1 –Decem ber 31, <strong>2010</strong>), Stefan Garber<br />
(January 1 –March 31, <strong>2010</strong>), Diethelm Sack (January 1 –March 31, <strong>2010</strong>).<br />
2)<br />
The figure for long-term compensation consists of retirement provisions<br />
(€ 2,896 thousand) and long-term incentives (€ 506 thousand). The figure<br />
for long-term compensation for retirement provisions of the new Board<br />
member is estimated.<br />
3)<br />
Details of defined benefit obligation.<br />
4)<br />
Including Board members who retired in the <strong>2010</strong> financial year.<br />
No loans and advances were extended to members of the Management<br />
Board in the year under review. Nor did the company<br />
take on any contingencies for the benefit of members of the<br />
Management Board.<br />
COMPENSATION OF THE SUPERVISORY BOARD<br />
[ € thousand ] <strong>2010</strong> 2009<br />
Total compensation of the<br />
Supervisory Board 808 877<br />
thereof short-term 808 877<br />
thereof fixed 541 506<br />
thereof variable 74 0<br />
thereof attendance fees 33 55<br />
thereof pecuniary advantage<br />
condition from travel benefits 41 25<br />
thereof compensation for<br />
membership in Supervisory<br />
Boards of DB Group companies<br />
(including attendance fees) 119 291<br />
No loans and advances were extended to members of the Supervisory<br />
Board in the year under review. Nor did the company take<br />
on any contingencies for the benefit of members of the Supervisory<br />
Board.<br />
With regard to an individual breakdown and further details<br />
of the compensation of the members of the Management Board<br />
and members of the Supervisory Board, please refer to the comments<br />
in the compensation report on pages 31 to 35 of this<br />
<strong>Annual</strong> <strong>Report</strong>.<br />
(39) Events after the balance sheet date<br />
At the end of January <strong>2010</strong>, agreement in the wage-bargaining<br />
negotiations <strong>2010</strong> was reached with the Eisenbahn- und Verkehrsgewerkschaft<br />
(EVG) trade union. The results of the negotiations<br />
envisage a two-tier increase in incomes. Accordingly, an increase<br />
of 1.8 % will be payable from March 1, 2011 (taking account of<br />
the one-off payment made in December <strong>2010</strong>), and a further<br />
2 % will be payable after January 1, 2012. In addition one percent<br />
per annum will be paid preferably for individual retirement<br />
benefits. Further improvements were agreed for the shift<br />
bonuses and vacation allowances. The wage-bargaining agreement<br />
is due to run for a period of 29 months: from August 1,<br />
<strong>2010</strong> to December 31, 2012.<br />
At the beginning of February 2011, the GDL trade union<br />
stated that the negotiations with DB <strong>AG</strong> and the local rail passenger<br />
transport companies Abellio GmbH, Arriva Deutschland<br />
GmbH, BeNEX GmbH, Keolis Deutschland GmbH & Co. KG,<br />
Veolia Verkehr GmbH as well as Hessische Landesbahn had<br />
failed, and announced a series of strikes.<br />
At the beginning of February 2011, the Federal Supreme<br />
Court (Bundesgerichtshof; BGH) approved the review application<br />
of Abellio and stated that the contractual agreement<br />
between the Rhine-Ruhr transport association (Verkehrsverbund<br />
Rhein-Ruhr; VRR) and DB Regio NRW was ineffective. The judgement<br />
has resulted in the revival of the original agreement which<br />
was due to run until December 2018. DB Group will evaluate the<br />
judgement and assess alternative action. This fundamental<br />
decision of the BGH affects more than 30 direct route contracts<br />
which are about to be awarded, and is therefore of far-reaching<br />
significance for the German local transport market.<br />
No compensation was incurred for former members of the Supervisory<br />
Board and their surviving dependants. There are no<br />
pension obligations for former members of the Supervisory<br />
Board and their surviving dependants.
240<br />
| DEUTSCHE BAHN GROUP<br />
(40) Exemption of subsidiaries<br />
from the disclosure requirements<br />
of the German Commercial Code<br />
The following subsidiaries intend to<br />
utilize the possibility of Section 264 (3)<br />
German Commercial Code (Handels-<br />
ge setz buch; HGB) and not disclose their<br />
fi nan cial statements:<br />
A A. Philippi GmbH, Quierschied<br />
A AMEROPA-REISEN GmbH,<br />
Bad Homburg v.d. Höhe<br />
A Anterist& Schneider GmbH,<br />
Saarbrücken<br />
A Anterist + Schneider Automotive Service<br />
GmbH, Saarwellingen<br />
A Anterist + Schneider Möbel-Logistik<br />
GmbH, Saarbrücken<br />
A Autokraft GmbH, Kiel<br />
A Bayern Express&P. Kühn Berlin GmbH,<br />
Berlin<br />
A BBH <strong>Bahn</strong>Bus Hochstift GmbH,<br />
Paderborn<br />
A BRN Busverkehr Rhein-Neckar GmbH,<br />
Ludwigshafen am Rhein<br />
A BRN Stadtbus GmbH,<br />
Ludwigshafen am Rhein<br />
A BRS Busverkehr Ruhr-Sieg GmbH,<br />
Meschede<br />
A BVO Busverkehr Ostwestfalen GmbH,<br />
Bielefeld<br />
A BVR Busverkehr Rheinland GmbH,<br />
Düsseldorf<br />
A DB Akademie GmbH, Potsdam<br />
A DB Dialog Telefonservice GmbH, Berlin<br />
A DB Dienstleistungen GmbH, Berlin<br />
A DB European Railservice GmbH,<br />
Dortmund<br />
A DB FuhrparkService GmbH,<br />
Frankfurt am Main<br />
A DB Gastronomie GmbH,<br />
Frankfurt am Main<br />
A DB Intermodal Services GmbH, Mainz<br />
A DB International GmbH, Berlin<br />
A DB JobService GmbH, Berlin<br />
A DB Kommunikationstechnik GmbH,<br />
Berlin<br />
A DB Media&Buch GmbH, Kassel<br />
A DB Mobility Logistics <strong>AG</strong>, Berlin<br />
A DB ProjektBau GmbH, Berlin<br />
A DB Regio Bayern GmbH, Munich<br />
A DB Regio Hanse Verkehr GmbH, Rostock<br />
A DB Regio Hessen GmbH,<br />
Frankfurt am Main<br />
A DB Regio Nahverkehr Drei GmbH,<br />
Frankfurt am Main<br />
A DB Regio Nahverkehr Eins GmbH,<br />
Frankfurt am Main<br />
A DB Regio Nord GmbH, Hanover<br />
A DB Regio Nordost GmbH, Potsdam<br />
A DB Regio Rhein-Ruhr GmbH, Essen<br />
A DB Regio Südost GmbH, Leipzig<br />
A DB Regio Südwest GmbH, Mainz<br />
A DB Regio Thüringen GmbH, Erfurt<br />
A DB Regio Westfalen GmbH, Dortmund<br />
A DB Rent GmbH, Frankfurt am Main<br />
A DB Schenker BTT GmbH, Mainz<br />
A DB Schenker Nieten GmbH, Freilassing<br />
A DB Schenker Rail Automotive GmbH,<br />
Kelsterbach<br />
A DB Schenker Rail Corridor Operations<br />
GmbH, Mainz<br />
A DB Schenker Rail GmbH, Mainz<br />
A DB Services Immobilien GmbH, Berlin<br />
A DB Sicherheit GmbH, Berlin<br />
A DB Stadtverkehr Bayern GmbH, Coburg<br />
A DB Stadtverkehr GmbH,<br />
Frankfurt am Main<br />
A DB Systel GmbH, Frankfurt am Main<br />
A DB Vertrieb GmbH, Frankfurt am Main<br />
A DB Zeitarbeit GmbH, Berlin<br />
A DVA <strong>Deutsche</strong> Verkehrs-Assekuranz-<br />
Vermittlungs-GmbH, Bad Homburg<br />
A ECO-Trucking GmbH, Coburg<br />
A EL<strong>AG</strong> Emder Lagerhaus und Automotive<br />
GmbH, Emden<br />
A ELSPED Speditions-Gesellschaft m.b.H.,<br />
Hamburg<br />
A EV<strong>AG</strong> Emder Verkehrs und Automotive<br />
Gesellschaft mbH, Emden<br />
A EVB Handelshaus Bour GmbH,<br />
Landau in der Pfalz<br />
A Friedrich Müller Omnibusunternehmen<br />
GmbH, Schwäbisch Hall<br />
A Georg Schulmeyer GmbH,<br />
Mörfelden-Walldorf<br />
A H. Albrecht Speditions Gesellschaft<br />
mit beschränkter Haftung,<br />
Frankfurt am Main<br />
A Haller Busbetrieb GmbH, Walsrode<br />
A Hanekamp Busreisen GmbH,<br />
Cloppenburg<br />
A Heider Stadtverkehr GmbH, Heide<br />
A Intertec GmbH, Landau in der Pfalz<br />
A Intertec Retail Logistics GmbH,<br />
Landau in der Pfalz<br />
A Inter-Union Technohandel GmbH,<br />
Landau in der Pfalz<br />
A Karpeles Flight Services GmbH,<br />
Frankfurt am Main<br />
A NVO Nahverkehr Ostwestfalen GmbH,<br />
Münster/ Westphalia<br />
A Omnibusverkehr Franken GmbH (OVF),<br />
Nuremberg<br />
A ORN Omnibusverkehr Rhein-Nahe<br />
GmbH, Mainz<br />
A RBO Regionalbus Ostbayern GmbH,<br />
Regensburg<br />
A Regional Bus Stuttgart GmbH RBS,<br />
Stuttgart<br />
A Regionalbus Braunschweig GmbH<br />
–RBB–, Brunswick<br />
A Regionalverkehr Allgäu GmbH (RVA),<br />
Oberstdorf<br />
A Regionalverkehr Kurhessen GmbH (RKH),<br />
Kassel<br />
A Regionalverkehr Oberbayern<br />
Gesellschaft mit beschränkter Haftung,<br />
Munich<br />
A RMV Rhein-Mosel Verkehrsgesellschaft<br />
mbH, Koblenz<br />
A RVE Regionalverkehr Euregio<br />
Maas-Rhein GmbH, Aachen<br />
A RVN Regionalverkehr Niederrhein<br />
GmbH, Wesel<br />
A RVS Regionalbusverkehr Südwest GmbH,<br />
Karlsruhe<br />
A Saar-Pfalz-Bus GmbH, Saarbrücken<br />
A S-<strong>Bahn</strong> Mitteldeutschland GmbH,<br />
Leipzig<br />
A SBG SüdbadenBus GmbH,<br />
Freiburg im Breisgau<br />
A Schenker (BAX) Europe Holding GmbH,<br />
Essen
| CONSOLIDATED FINANCIAL STATEMENTS<br />
| Notes<br />
241<br />
A SCHENKER AIR TRANSPORT GmbH,<br />
Kelsterbach<br />
A Schenker Aktiengesellschaft, Essen<br />
A SCHENKER BETEILIGUNGS GmbH,<br />
Dortmund<br />
A Schenker Deutschland <strong>AG</strong>,<br />
Frankfurt am Main<br />
A SCHENKER INTERNATIONAL<br />
AKTIEN GESELLSCHAFT, Essen<br />
A Schenker NIGHT PLUS GmbH, Wülfrath<br />
A Stinnes Beteiligungs-Verwaltungs GmbH,<br />
Essen<br />
A Stinnes Immobiliendienst Verwaltungsgesellschaft<br />
mbH, Mülheim an der Ruhr<br />
A Stinnes Logistics GmbH, Essen<br />
A Südwest Mobil GmbH, Mainz<br />
A TLS Transa Logistik& Service GmbH,<br />
Offenbach am Main<br />
A TRANSA Spedition GmbH,<br />
Offenbach am Main<br />
A Trilag Geschäftsführungs GmbH, Trier<br />
A Verkehrsgesellschaft mbH Untermain<br />
– VU –, Aschaffenburg<br />
A Verkehrsgesellschaft Schleswig-Holstein<br />
mbH, Flensburg<br />
A WB Westfalen Bus GmbH, Münster<br />
A Weser-Ems Busverkehr GmbH (WEB),<br />
Bremen<br />
A Zehlendorfer Eisenbahn- und Hafen<br />
Gesellschaft mit beschränkter Haftung,<br />
Berlin<br />
A Zentral-Omnibusbahnhof Berlin GmbH,<br />
Berlin<br />
(41) List of shareholdings<br />
The list of shareholdings is set out on the following pages. It<br />
does not include the companies from the acquired business of<br />
Arriva in Germany, because we do not have reliable information<br />
as a result of cartel law requirements. Information regarding<br />
Arriva Deutschland GmbH, Viechtach, and its subsidiaries is<br />
available in the Federal Gazette at www.ebundesanzeiger.de.<br />
LIST OF SHAREHOLDINGS OF DB <strong>AG</strong> (ACCORDING TO SECTION 313 (2) HGB)<br />
Subsidiary [ Name and domicile ]<br />
Equity<br />
in TLC 6)<br />
Ownership<br />
in %<br />
DB BAHN LONG-DISTANCE<br />
FULLY CONSOLIDATED<br />
City Night Line CNL <strong>AG</strong> i.L., Zurich /Switzerland 71 1) 100.00<br />
DB <strong>Bahn</strong> Italia S.r.l., Verona /Italy 7,568 100.00<br />
DB European Railservice GmbH, Dortmund 7) –309 100.00<br />
DB Fernverkehr Aktiengesellschaft,<br />
Frankfurt am Main 7) 2,061,803 100.00<br />
DB Reise &Touristik Suisse SA,<br />
Bern /Switzerland 547 100.00<br />
DB AutoZug GmbH, Dortmund 7) 134,291 100.00<br />
GERMAN RAIL UK LIMITED,<br />
London /Great Britain –23 100.00<br />
le train DB S.A.S, Paris /France 1,551 100.00<br />
AT EQUITY<br />
Alleo GmbH, Saarbrücken 7) 127 50.00<br />
RailLink B.V.,<br />
Amsterdam /the Netherlands 7 ), 10) – 5,838 25.00<br />
Railteam B.V., Amsterdam /<br />
the Netherlands 7 ), 8), 10) 82 25.00<br />
Rheinalp GmbH, Freiburg im Breisgau 7), 8) 0 50.00<br />
DB BAHN REGIONAL<br />
FULLY CONSOLIDATED<br />
Botniatag AB, Stockholm /Sweden 19,010 60.00<br />
Chiltern Railway Company Limited,<br />
London /Great Britain 11,125 100.00<br />
DB <strong>Bahn</strong> Polska Sp. z o.o., Warsaw /Poland 68 100.00<br />
DB Regio Aktiengesellschaft,<br />
Frankfurt am Main 7) 1,797,308 100.00<br />
Subsidiary [ Name and domicile ]<br />
Equity<br />
in TLC 6)<br />
Ownership<br />
in %<br />
DB Regio Bayern GmbH, Munich 7) 25 100.00<br />
DB Regio Essex Thameside Limited,<br />
London /Great Britain 0 100.00<br />
DB Regio Hanse Verkehr GmbH, Rostock 7) 25 100.00<br />
DB Regio Hessen GmbH, Frankfurt am Main 7) 25 100.00<br />
DB Regio Nahverkehr Drei GmbH,<br />
Frankfurt am Main 7) 25 100.00<br />
DB Regio Nahverkehr Eins GmbH,<br />
Frankfurt am Main 7) 25 100.00<br />
DB Regio Nord GmbH, Hanover 7) 25 100.00<br />
DB Regio Nordost GmbH, Potsdam 7) 25 100.00<br />
DB Regio NRW GmbH, Düsseldorf 7) 249,654 100.00<br />
DB Regio Rheinland GmbH, Cologne 7) 16,989 100.00<br />
DB Regio Rhein-Ruhr GmbH, Essen 7) 25 100.00<br />
DB Regio Südost GmbH, Leipzig 7) 25 100.00<br />
DB Regio Südwest GmbH, Mainz 7) 25 100.00<br />
DB Regio Sverige AB, Stockholm /Sweden 16,467 100.00<br />
DB Regio Thüringen GmbH, Erfurt 7) 25 100.00<br />
DB Regio Tyne and Wear Limited,<br />
London /Great Britain –3,383 100.00<br />
DB Regio UK Limited, London /Great Britain –9,271 100.00<br />
DB Regio Westfalen GmbH, Dortmund 7) 25 100.00<br />
DB RegioNetz Verkehrs GmbH,<br />
Frankfurt am Main 7) 67,651 100.00<br />
DB ZugBus Regionalverkehr<br />
Alb-Bodensee GmbH (RAB), Ulm 7) 24,218 100.00<br />
M40 Trains Limited, London /Great Britain 38,719 100.00
242<br />
| DEUTSCHE BAHN GROUP<br />
Subsidiary [ Name and domicile ]<br />
Equity<br />
in TLC 6)<br />
Ownership<br />
in %<br />
RegioTram Betriebsgesellschaft mbH, Kassel 128 50.96<br />
S-<strong>Bahn</strong> Berlin GmbH, Berlin 7) 168,146 100.00<br />
S-<strong>Bahn</strong> Hamburg GmbH, Hamburg 7) 61,924 100.00<br />
S-<strong>Bahn</strong> Mitteldeutschland GmbH, Leipzig 7) 25 100.00<br />
AT EQUITY<br />
Bodensee-Oberschwaben Verkehrsverbundgesellschaft<br />
mit beschränkter<br />
Haftung, Ravensburg 7), 9) 119 25.31<br />
Kahlgrund-Verkehrs-Gesellschaft mit<br />
beschränkter Haftung, Schöllkrippen 7), 9) 10,277 28.00<br />
London Overground Rail Operations Limited,<br />
London /Great Britain 7), 9) 3,717 50.00<br />
NSH Nahverkehr Schleswig-Holstein GmbH,<br />
Kiel 7 ), 10) 4 46.90<br />
Regionalverkehr Bayerisch Schwaben GmbH<br />
(RBS), Augsburg 7), 9) 111 50.00<br />
Regio-Verkehrsverbund Freiburg GmbH (RVF),<br />
Freiburg 7 ), 10) 411 45.00<br />
stadtbus Ravensburg Weingarten GmbH,<br />
Ravensburg 7), 9) 25 45.20<br />
Unternehmensgesellschaft Verkehrsverbund<br />
Rhein-Neckar GmbH (URN GmbH),<br />
Mannheim 7), 9) 202 34.15<br />
Verkehrsgemeinschaft Mittelthüringen GmbH<br />
(VMT), Erfurt 7), 9) 61 16.67<br />
Verkehrsunternehmen Hegau-Bodensee<br />
Verbund GmbH (VHB), Constance 7), 9) 30 34.00<br />
Verkehrsverbund Bremen /Niedersachsen<br />
GmbH (VBN), Bremen 7 ), 10) 181 29.65<br />
Verkehrsverbund Großraum Nürnberg GmbH<br />
(VGN), Nuremberg 7), 9) 38 26.32<br />
Verkehrsverbund Neckar-Alb-Donau GmbH<br />
(naldo), Hechingen 7), 9) 40 21.00<br />
Verkehrsverbund Süd-Niedersachsen GmbH<br />
(VSN), Göttingen 7 ), 10) 88 33.08<br />
Wrexham, Shropshire & Marylebone<br />
Holdings Limited, London /Great Britain 7), 9) –10,741 50.00<br />
WTV Waldshuter Tarifverbund GmbH,<br />
Waldshut-Tiengen 7), 9) 94 40.00<br />
DB BAHN URBAN<br />
FULLY CONSOLIDATED<br />
A. Philippi GmbH, Quierschied 7) 384 100.00<br />
Autokraft GmbH, Kiel 7) 8,554 100.00<br />
Bayern Express & P. Kühn Berlin GmbH,<br />
Berlin 7) 3,913 100.00<br />
BBH <strong>Bahn</strong>Bus Hochstift GmbH, Paderborn 7) 2,166 100.00<br />
Berlin Linien Bus GmbH, Berlin 26 65.00<br />
BRN Busverkehr Rhein-Neckar GmbH,<br />
Ludwigshafen am Rhein 7) 13,269 100.00<br />
BRN Stadtbus GmbH,<br />
Ludwigshafen am Rhein 7) 205 100.00<br />
BRS Busverkehr Ruhr-Sieg GmbH, Meschede 7) 4,519 100.00<br />
Busverkehr Märkisch-Oderland GmbH,<br />
Strausberg 6,026 51.17<br />
Subsidiary [ Name and domicile ]<br />
Equity<br />
in TLC 6)<br />
Ownership<br />
in %<br />
Busverkehr Oder-Spree GmbH, Fürstenwalde 4,003 51.17<br />
BVO Busverkehr Ostwestfalen GmbH,<br />
Bielefeld 7) 10,924 100.00<br />
BVR Busverkehr Rheinland GmbH,<br />
Düsseldorf 7) 4,257 100.00<br />
DB Stadtverkehr Bayern GmbH, Coburg 7) 25 100.00<br />
DB Stadtverkehr GmbH, Frankfurt am Main 7) –1,262 100.00<br />
Friedrich Müller Omnibusunternehmen GmbH,<br />
Schwäbisch Hall 7) 292 100.00<br />
Georg Schulmeyer GmbH,<br />
Mörfelden-Walldorf 7) 444 100.00<br />
Haller Busbetrieb GmbH, Walsrode 7) 25 100.00<br />
Hanekamp Busreisen GmbH, Cloppenburg 7) 555 100.00<br />
Heider Stadtverkehr GmbH, Heide 7) 52 100.00<br />
KOB GmbH, Oberthulba 790 70.00<br />
NVO Nahverkehr Ostwestfalen GmbH,<br />
Münster/Westphalia 7) 1,397 100.00<br />
Omnibusverkehr Franken GmbH (OVF),<br />
Nuremberg 7) 13,703 100.00<br />
ORN Omnibusverkehr Rhein-Nahe GmbH,<br />
Mainz 7) 5,201 100.00<br />
Pan Bus A/S, Viborg /Denmark 8,628 90.00<br />
RBO Regionalbus Ostbayern GmbH,<br />
Regensburg 7) 10,166 100.00<br />
RDS bus s.r.o., Babylon /Czech Republic 87 1) 100.00<br />
Regional Bus Stuttgart GmbH RBS, Stuttgart 7) 15,862 100.00<br />
Regional- und Stadtverkehr Bayern GmbH (RSB),<br />
Nuremberg 7) 25 100.00<br />
Regionalbus Braunschweig GmbH –RBB–,<br />
Brunswick 7) 7,140 100.00<br />
Regionalverkehr Allgäu GmbH (RVA),<br />
Oberstdorf 7) 3,234 70.00<br />
Regionalverkehr Dresden GmbH, Dresden 5,621 51.00<br />
Regionalverkehr Kurhessen GmbH (RKH),<br />
Kassel 7) 15,515 100.00<br />
Regionalverkehr Oberbayern Gesellschaft mit<br />
beschränkter Haftung, Munich 7) 13,255 100.00<br />
rhb rheinhunsrückbus GmbH, Simmern 240 48.69<br />
Rhein-Westerwald Nahverkehr GmbH,<br />
Montabaur 129 61.36<br />
RMV Rhein-Mosel Verkehrsgesellschaft mbH,<br />
Koblenz 7) 9,551 74.90<br />
RVE Regionalverkehr Euregio Maas-Rhein GmbH,<br />
Aachen 7) 1,340 100.00<br />
RVN Regionalverkehr Niederrhein GmbH,<br />
Wesel 7) 509 100.00<br />
RVS Regionalbusverkehr Südwest GmbH,<br />
Karlsruhe 7) 7,164 100.00<br />
Saar-Pfalz-Bus GmbH, Saarbrücken 7) 9,435 100.00<br />
SBG SüdbadenBus GmbH,<br />
Freiburg im Breisgau 7) 6,660 100.00<br />
Südwest Mobil GmbH, Mainz 7) 51 100.00<br />
Verkehrsgesellschaft mbH Untermain – VU –,<br />
Aschaffenburg 7) 2,572 100.00
| CONSOLIDATED FINANCIAL STATEMENTS<br />
| Notes<br />
243<br />
Subsidiary [ Name and domicile ]<br />
Equity<br />
in TLC 6)<br />
Ownership<br />
in %<br />
Verkehrsgesellschaft Schleswig-Holstein mbH,<br />
Flensburg 7) 59 100.00<br />
Verkehrsgesellschaft Schwalm-Eder mbH (VSE),<br />
Kassel 26 100.00<br />
WB Westfalen Bus GmbH, Münster 7) 6,024 100.00<br />
Weser-Ems Busverkehr GmbH (WEB),<br />
Bremen 7) 10,130 100.00<br />
Zentral-Omnibusbahnhof Berlin GmbH,<br />
Berlin 7) 414 100.00<br />
AT EQUITY<br />
“Steig ein” GmbH, Kempten 7), 9) 37 23.33<br />
die Linie GmbH Verkehrsbetrieb,<br />
Schenefeld 7), 9) 1,043 25.00<br />
ETP EURO TRAFFIC PARTNER GmbH,<br />
Chemnitz 7), 9) 447 12.75<br />
Filsland Mobilitätsverbund GmbH,<br />
Göppingen 30.00<br />
FSN Fahrzeugservice Neunkirchen GmbH,<br />
Neunkirchen 7), 9) 99 47.50<br />
Hövelhofer Ortsbus GmbH (HOB),<br />
Rheda-Wiedenbrück 7 ), 12) 11 50.00<br />
Kitzinger Nahverkehrsgemeinschaft (KiNG),<br />
Kitzingen 50.00<br />
Kreisbahn Aurich GmbH, Aurich 7), 9) 1,192 33.33<br />
Main-Spessart-Nahverkehrsgesellschaft mbH,<br />
Gemünden (Main) 7 ), 10) 107 25.00<br />
Nahverkehrsgesellschaft Kreis Gütersloh mbH<br />
(NVG) i. L., Gütersloh 7 ), 12) 45 24.70<br />
OWL Verkehr GmbH, Bielefeld 7), 9) 51 34.35<br />
RBP Regionalbusverkehr Passau Land GmbH,<br />
Bad Füssing 7 ), 10) 77 33.33<br />
Rhein-Nahe Nahverkehrsverbund GmbH,<br />
Ingelheim am Rhein 7 ), 11) 127 38.33<br />
Saarländische Nahverkehrs-Service GmbH,<br />
Saarbrücken 7 ), 10) 50 30.00<br />
TGO – Tarifverbund Ortenau GmbH,<br />
Offenburg 7), 9) 225 48.50<br />
UVW Unternehmensverbund Westpfalz GmbH,<br />
Kaiserslautern 9) 29 61.67<br />
Verkehrsgemeinschaft Aalen GmbH (VGA),<br />
Aalen 7 ), 10) 64 26.67<br />
Verkehrsgemeinschaft Schwäbisch Gmünd<br />
GmbH (VSG), Schwäbisch Gmünd 7 ), 11) 28 25.00<br />
Verkehrsgesellschaft Landkreis Nienburg mbH<br />
(VLN), Nienburg /Weser 7 ), 10) 26 47.00<br />
VerkehrsGesellschaft Main-Tauber mbH<br />
(VGMT), Lauda-Königshofen 7 ), 10) 48 42.19<br />
Verkehrs-Servicegesellschaft Paderborn /<br />
Höxter mbH (VPH), Paderborn 7 ), 12) 41 37.00<br />
Verkehrsunternehmens-Verbund<br />
Mainfranken GmbH – VVM, Würzburg 7), 9) 28 19.82<br />
Verkehrsverbund Schwarzwald-Baar GmbH<br />
(VSB), Villingen-Schwenningen 7), 9) 172 45.00<br />
Subsidiary [ Name and domicile ]<br />
Equity<br />
in TLC 6)<br />
Ownership<br />
in %<br />
VGC Verkehrsgesellschaft Bäderkreis<br />
Calw mbH, Calw 7), 9) 321 32.50<br />
VHN Verkehrsholding Nord GmbH& Co. KG,<br />
Flensburg 7), 9) 720 20.00<br />
VHN Verwaltungsgesellschaft mbH,<br />
Flensburg 7), 9) 266 20.00<br />
VMS Verkehrs-Management und Service GmbH,<br />
Trier 7), 9) 56 38.46<br />
Völklinger Verkehrsgesellschaft mbH,<br />
Völklingen 7), 9) 231 25.50<br />
WNS Westpfälzische Nahverkehrs-Service GmbH,<br />
Kaiserslautern 7), 9) 290 45.00<br />
ZOB Zentral-Omnibus-<strong>Bahn</strong>hof GmbH,<br />
Bremen 7), 9) 30 25.60<br />
AT COST<br />
Regio Verkehrsverbund Lörrach GmbH (RVL),<br />
Lörrach 7 ), 9), 17 ) 233 54.00<br />
Verkehrsverbund Rottweil GmbH (VVR),<br />
Rottweil 7 ), 9), 17 ) 87 70.20<br />
vgf Verkehrs-Gemeinschaft Landkreis<br />
Freudenstadt GmbH, Waldachtal 7 ), 9), 17 ) 127 52.92<br />
DB ARRIVA<br />
FULLY CONSOLIDATED<br />
A &T Motor Retailing Limited,<br />
Sunderland /Great Britain 1,514 100.00<br />
ACTIJOVEN CONSULTING &TRAVELLING s.l.,<br />
Madrid /Spain 263 100.00<br />
AJ Transit Limited, Sunderland /Great Britain 0 100.00<br />
Alliance Rail Holdings Ltd,<br />
York /Great Britain –92 75.10<br />
Alliance Rail Management Ltd,<br />
York /Great Britain 0 75.10<br />
Alnery 1345 Limited,<br />
Sunderland /Great Britain –0 100.00<br />
Ambermile Ltd, Sunderland /Great Britain 98 100.00<br />
APS (Leasing) Ltd,<br />
Sunderland /Great Britain 12,282 100.00<br />
Arriva (2007) Limited,<br />
Sunderland /Great Britain 380,702 100.00<br />
Arriva (Doxford ) Limited,<br />
Sunderland /Great Britain 0 100.00<br />
Arriva Abbey Line Limited,<br />
Sunderland /Great Britain 0 100.00<br />
Arriva Achterhoek – Rivierenland BV,<br />
Heerenveen /the Netherlands 183 100.00<br />
Arriva Beheer NV,<br />
Heerenveen /the Netherlands 8,051 100.00<br />
Arriva Brabant BV,<br />
Heerenveen /the Netherlands –1,011 100.00<br />
Arriva Bus & Coach Holdings Limited,<br />
Sunderland /Great Britain 20,883 100.00<br />
Arriva Bus and Coach Finance Ltd,<br />
Sunderland /Great Britain 1,871 100.00
244<br />
| DEUTSCHE BAHN GROUP<br />
Subsidiary [ Name and domicile ]<br />
Equity<br />
in TLC 6)<br />
Ownership<br />
in %<br />
Arriva Bus and Coach Ltd,<br />
Sunderland /Great Britain 7,781 100.00<br />
Arriva Bus and Coach Rental (1) Ltd,<br />
Sunderland /Great Britain 3,465 100.00<br />
Arriva Bus and Coach Rental (2) Ltd,<br />
Sunderland /Great Britain 3,166 100.00<br />
Arriva Bus and Coach Rental (3) Ltd,<br />
Sunderland /Great Britain 1,831 100.00<br />
Arriva Bus and Coach Rental (4) Ltd,<br />
Sunderland /Great Britain –3,295 100.00<br />
Arriva Busfleet NV,<br />
Heerenveen /the Netherlands – 3,619 100.00<br />
Arriva Cheshire Limited,<br />
Sunderland /Great Britain 1,251 100.00<br />
Arriva Colchester Limited,<br />
Sunderland /Great Britain –64 100.00<br />
Arriva Concessie BV,<br />
Heerenveen /the Netherlands 18 100.00<br />
Arriva Coöperatie W.A.,<br />
Heerenveen /the Netherlands 686,483 100.00<br />
Arriva Croydon & North Surrey Limited,<br />
Sunderland /Great Britain –16 100.00<br />
Arriva Cymru Limited,<br />
Sunderland /Great Britain 5,534 100.00<br />
Arriva DAV BV,<br />
Heerenveen /the Netherlands –6,218 100.00<br />
Arriva Derby Limited,<br />
Sunderland /Great Britain 6,295 100.00<br />
Arriva Durham County Limited,<br />
Sunderland /Great Britain 1,424 100.00<br />
Arriva East Herts & Essex Ltd,<br />
Sunderland /Great Britain 876 100.00<br />
Arriva Finance Holding BV,<br />
Heerenveen /the Netherlands 76,546 100.00<br />
Arriva Finance Lease Limited,<br />
Sunderland /Great Britain 7,557 100.00<br />
Arriva Finance Limited,<br />
Sunderland /Great Britain 0 100.00<br />
Arriva Findiv Limited,<br />
Sunderland /Great Britain 259,966 100.00<br />
Arriva Fox County Limited,<br />
Sunderland /Great Britain 0 100.00<br />
Arriva Guildford &West Surrey Limited,<br />
Sunderland /Great Britain 2,031 100.00<br />
Arriva Holding Ceska Republika s.r.o.,<br />
Prague /Czech Republic 358,617 100.00<br />
Arriva Hongarije Holding BV,<br />
Heerenveen /the Netherlands 33,468 100.00<br />
Arriva HWGO BV,<br />
Heerenveen /the Netherlands –2,477 100.00<br />
Arriva Insurance A/S, Kastrup /Denmark 29,985 100.00<br />
Arriva Insurance Company (Gibraltar) Limited,<br />
Gibraltar/Gibraltar 5,570 2) 100.00<br />
Arriva International (2) Limited,<br />
Sunderland /Great Britain 3 100.00<br />
Arriva International (7) Limited,<br />
Sunderland /Great Britain 151,615 100.00<br />
Subsidiary [ Name and domicile ]<br />
Equity<br />
in TLC 6)<br />
Ownership<br />
in %<br />
Arriva International (Northern Europe)<br />
Limited, Sunderland /Great Britain 362,304 1) 100.00<br />
Arriva International (Southern Europe) Limited,<br />
Sunderland /Great Britain 362,302 1) 100.00<br />
Arriva International Finance Limited,<br />
Sunderland /Great Britain 367,108 1) 100.00<br />
Arriva International Limited,<br />
Sunderland /Great Britain 291,800 100.00<br />
Arriva International Trains (Leasing) Limited,<br />
Sunderland /Great Britain 14,550 1) 100.00<br />
ARRIVA INVESTIMENTOS SGPS, SA,<br />
Almada /Portugal 194,820 99.99<br />
Arriva Italia S.R.L., Bergamo /Italy –2 100.00<br />
Arriva Italia s.r.l., Milan /Italy 77,172 99.99<br />
Arriva Kent & Sussex Limited,<br />
Sunderland /Great Britain 5,457 100.00<br />
Arriva Kent Thameside Limited,<br />
Sunderland /Great Britain 10,593 100.00<br />
Arriva Leasing (UK) Limited,<br />
Sunderland /Great Britain 0 100.00<br />
ARRIVA LISBOA TRANSPORTES SA,<br />
Almada /Portugal 7 99.99<br />
Arriva Liverpool Limited,<br />
Sunderland /Great Britain 736 100.00<br />
Arriva London Limited,<br />
Sunderland /Great Britain 0 100.00<br />
ARRIVA LONDON NORTH EAST LTD,<br />
Sunderland /Great Britain 5,749 100.00<br />
ARRIVA LONDON NORTH LTD,<br />
Sunderland /Great Britain 35,532 100.00<br />
ARRIVA LONDON SOUTH LTD,<br />
Sunderland /Great Britain 17,698 100.00<br />
Arriva Magyarorszag Vagyonkezelo Kft,<br />
Budapest /Hungary 7,800.454 100.00<br />
Arriva Malta Finance & Investments Limited,<br />
Sunderland /Great Britain 609,164 1) 99.99<br />
Arriva Malta Holdings Limited,<br />
Sunderland /Great Britain 582,458 1) 100.00<br />
Arriva Malta Limited,<br />
Sunderland /Great Britain 6 1) 66.67<br />
Arriva Manchester Limited,<br />
Sunderland /Great Britain –790 100.00<br />
Arriva Medway Towns Limited,<br />
Sunderland /Great Britain 3,338 100.00<br />
Arriva Merseyside Limited,<br />
Sunderland /Great Britain 16,125 100.00<br />
Arriva Midland Red North Limited,<br />
Sunderland /Great Britain 109 100.00<br />
Arriva Midlands Limited,<br />
Sunderland /Great Britain 5,041 100.00<br />
Arriva Midlands North Limited,<br />
Sunderland /Great Britain 9,672 100.00<br />
Arriva Motor Holdings Limited,<br />
Sunderland /Great Britain 140,858 100.00<br />
Arriva Motor Retailing Limited,<br />
Sunderland /Great Britain 67,365 100.00
| CONSOLIDATED FINANCIAL STATEMENTS<br />
| Notes<br />
245<br />
Subsidiary [ Name and domicile ]<br />
Equity<br />
in TLC 6)<br />
Ownership<br />
in %<br />
Arriva Multimodaal BV,<br />
Heerenveen /the Netherlands 18 100.00<br />
Arriva Noroeste s.l., Ferrol /Spain 20,518 100.00<br />
Arriva North East Limited,<br />
Sunderland /Great Britain 6,330 100.00<br />
Arriva North West Limited,<br />
Sunderland /Great Britain 1,104 100.00<br />
Arriva Northumbria Limited,<br />
Sunderland /Great Britain 4,378 100.00<br />
Arriva Openbaar Vervoer NV,<br />
Heerenveen /the Netherlands 62,200 100.00<br />
Arriva Passenger Services (International)<br />
Limited, Sunderland /Great Britain –167 100.00<br />
Arriva Passenger Services Limited,<br />
Sunderland /Great Britain 174,647 100.00<br />
Arriva Passenger Services Pension Trustees<br />
Limited, Sunderland /Great Britain 0 100.00<br />
Arriva Personenvervoer Nederland BV,<br />
Heerenveen /the Netherlands 152,695 100.00<br />
Arriva Plc, Sunderland /Great Britain 605,000 100.00<br />
Arriva Polen Holding BV,<br />
Heerenveen /the Netherlands 4,656 100.00<br />
Arriva Polska Sp. z o.o., Warsaw /Poland 6,516 100.00<br />
ARRIVA PORTUGAL – TRANSPORTES LDA,<br />
Guimarães /Portugal 8,884 99.99<br />
Arriva RP Sp. z o.o., Warsaw /Poland 141 100.00<br />
Arriva Scotland West Limited,<br />
Inchinnan /Great Britain 2,739 100.00<br />
Arriva Skandinavien A/S, Kastrup /Denmark 428,934 100.00<br />
Arriva Slowakije Holding BV,<br />
Heerenveen /the Netherlands 19 100.00<br />
Arriva Southend Limited,<br />
Sunderland /Great Britain 5,208 100.00<br />
Arriva Southern Counties Limited,<br />
Sunderland /Great Britain 1,165 100.00<br />
Arriva Sverige AB, Helsingborg /Sweden 26,344 100.00<br />
Arriva Tag AB, Malmö /Sweden 53,952 100.00<br />
Arriva Techniek BV,<br />
Heerenveen /the Netherlands –1,363 100.00<br />
Arriva Tees & District Limited,<br />
Sunderland /Great Britain 446 100.00<br />
Arriva Teeside Limited,<br />
Sunderland /Great Britain 129 100.00<br />
Arriva the Shires Limited,<br />
Sunderland /Great Britain 6,232 100.00<br />
Arriva Tog A/S, Kastrup /Denmark 114,149 100.00<br />
Arriva Touring BV,<br />
Heerenveen /the Netherlands 1,443 100.00<br />
Arriva Tours Ltd,<br />
Sunderland /Great Britain 5 100.00<br />
Arriva Trains (Poland) Limited,<br />
Sunderland /Great Britain 657 1) 100.00<br />
Arriva Trains Anglia Limited,<br />
Sunderland /Great Britain 0 100.00<br />
Arriva Trains East Coast Limited,<br />
Sunderland /Great Britain 0 100.00<br />
Subsidiary [ Name and domicile ]<br />
Equity<br />
in TLC 6)<br />
Ownership<br />
in %<br />
Arriva Trains Merseyside Limited,<br />
Sunderland /Great Britain 21,029 100.00<br />
Arriva Trains Northern Limited,<br />
Sunderland /Great Britain 47,501 100.00<br />
Arriva Trains Scotrail Limited,<br />
Sunderland /Great Britain 0 100.00<br />
Arriva Trains Thameside Limited,<br />
Sunderland /Great Britain 0 100.00<br />
Arriva Trains Wales Limited,<br />
Sunderland /Great Britain 24,837 100.00<br />
ARRIVA TRANSPORTES DA MARGEM SUL, SA,<br />
Almada /Portugal 81,183 99.99<br />
Arriva Trustee Company Limited,<br />
Sunderland /Great Britain 0 100.00<br />
Arriva UK Trains Limited,<br />
Sunderland /Great Britain 27,951 100.00<br />
Arriva vlaky s.r.o., Prague /Czech Republic –538 100.00<br />
Arriva Wadden BV,<br />
Heerenveen /the Netherlands 1,119 100.00<br />
Arriva Waterland Rivierenland BV,<br />
Heerenveen /the Netherlands –14,833 100.00<br />
Arriva Watford Ltd,<br />
Sunderland /Great Britain 5 100.00<br />
Arriva West Sussex Limited,<br />
Sunderland /Great Britain 4,332 100.00<br />
Arriva Yorkshire Ltd,<br />
Sunderland /Great Britain 3,573 100.00<br />
Arriva Yorkshire North Ltd,<br />
Sunderland /Great Britain 246 100.00<br />
Arriva Yorkshire South Ltd,<br />
Sunderland /Great Britain 1,264 100.00<br />
Arriva Yorkshire West Ltd,<br />
Sunderland /Great Britain 1,458 100.00<br />
Arriva Zuid Europa Holding BV,<br />
Heerenveen /the Netherlands 570,343 100.00<br />
Arrowline (Travel) Limited,<br />
Sunderland /Great Britain –1 100.00<br />
ASC 2001 A /S, Kastrup /Denmark 182,668 100.00<br />
At Seat Catering Limited,<br />
Cardiff/Great Britain –10 100.00<br />
AUTOBUSES GREISI S.L., Madrid /Spain 246 100.00<br />
AUTOCARES FRAY ESCOBA SLU,<br />
Madrid /Spain 1,584 100.00<br />
Autocares Mallorca, s.l., Alcudia /Spain 4,832 100.00<br />
Autocares Pujol s.l., Alcudia /Spain –130 100.00<br />
Autoservizi F.V.G. S.P.A. – SAF, Udine /Italy 63,948 60.00<br />
B.B. Motors (Bristol) Limited,<br />
Sunderland /Great Britain 0 100.00<br />
Bergamo Trasporti Est S.c.a.r.l.,<br />
Bergamo /Italy 10 93.66<br />
Bergamo Trasporti Ovest S.c.a.r.l.,<br />
Bergamo /Italy 10 65.76<br />
BOSAK BUS spol. s r.o.,<br />
Dobris /Czech Republic 48,092 100.00<br />
British Bus (1993) Limited,<br />
Sunderland /Great Britain 1 100.00
246<br />
| DEUTSCHE BAHN GROUP<br />
Subsidiary [ Name and domicile ]<br />
Equity<br />
in TLC 6)<br />
Ownership<br />
in %<br />
British Bus (Properties) Limited,<br />
Sunderland /Great Britain 74,564 100.00<br />
British Bus Group Limited,<br />
Sunderland /Great Britain 43,138 100.00<br />
British Bus Limited,<br />
Sunderland /Great Britain – 6,840 100.00<br />
Broadwood Finance Company Limited,<br />
Sunderland /Great Britain –42,845 100.00<br />
Bus Nord Balear s.l., Alcudia /Spain –2,800 100.00<br />
Buscompagniet 2004 ApS,<br />
Kastrup /Denmark 9,377 100.00<br />
BUSCOMP<strong>AG</strong>NIET ApS, Kastrup /Denmark 74,259 100.00<br />
BUSDAN 20 ApS, Kastrup /Denmark 6,861 100.00<br />
BUSDAN 21 ApS, Kastrup /Denmark 153,981 100.00<br />
BUSDAN 24 ApS, Kastrup /Denmark 7,402 100.00<br />
BUSDAN 25 ApS, Kastrup /Denmark 6,185 100.00<br />
BUSDAN 26 ApS, Kastrup /Denmark 477 100.00<br />
BUSDAN 27 ApS, Kastrup /Denmark –305 100.00<br />
BUSDAN 28 ApS, Kastrup /Denmark 1,279 100.00<br />
BUSDAN 29 ApS, Kastrup /Denmark –4,539 100.00<br />
BUSDAN 291 ApS, Kastrup /Denmark 1,423 100.00<br />
BUSDAN 30 ApS, Kastrup /Denmark –4,592 100.00<br />
BUS-SERVICE SLOVAKIA, spol. s r.o.,<br />
Komarno /Slovakia 969 100.00<br />
BWS Cymru Cyfyngedig,<br />
Sunderland /Great Britain 5 100.00<br />
Caserapid Limited,<br />
Sunderland /Great Britain 241 100.00<br />
CDK Ejendomme 2005 A/S,<br />
Kastrup /Denmark 938 100.00<br />
CDK Fleet Management A/S,<br />
Kastrup /Denmark –260 100.00<br />
CDK Service A/S, Kastrup /Denmark –26,620 100.00<br />
Chase Coaches Limited,<br />
Sunderland /Great Britain –215 100.00<br />
Classic Buses (Stanley) Limited,<br />
Sunderland /Great Britain 0 100.00<br />
Classic Coaches (Continental) Limited,<br />
Sunderland /Great Britain 201 100.00<br />
Classic Trim Ltd, Sunderland /Great Britain 0 100.00<br />
Clydeside Buses Limited,<br />
Sunderland /Great Britain 0 100.00<br />
COMBUS EJENDOMME ApS,<br />
Kastrup /Denmark 27,030 100.00<br />
Cooperativa Bergamasca Trasporti a r.l.,<br />
Bergamo /Italy 30 59.52<br />
County Bus Holdings Ltd,<br />
Sunderland /Great Britain 98 100.00<br />
Cowie Aviation Limited,<br />
Sunderland /Great Britain 0 100.00<br />
Cowie Contract Hire Limited,<br />
Sunderland /Great Britain 0 100.00<br />
Cowie Lease Limited,<br />
Sunderland /Great Britain 0 100.00<br />
Subsidiary [ Name and domicile ]<br />
Equity<br />
in TLC 6)<br />
Ownership<br />
in %<br />
Crossville Bus Limited,<br />
Sunderland /Great Britain 1 100.00<br />
CTD Leasing 2001 A/S, Kastrup /Denmark 33 100.00<br />
Curtis Coaches Limited,<br />
Sunderland /Great Britain 0 100.00<br />
Derby City Transport Limited,<br />
Sunderland /Great Britain 12 100.00<br />
Derby Omnibus Limited,<br />
Sunderland /Great Britain 1,420 100.00<br />
East Coast Buses Limited,<br />
Sunderland /Great Britain 0 100.00<br />
Eastern Tractors (1981) Limited,<br />
Sunderland /Great Britain 0 100.00<br />
Eastern Tractors (Holdings) Limited,<br />
Sunderland /Great Britain 0 100.00<br />
EMPRESA DE BLAS Y CIA S.L., Madrid /Spain 56,930 100.00<br />
Entidad Unica Ltd, Ferrol /Spain 26 90.91<br />
ESFERA BUS SLU, Madrid /Spain 1,206 100.00<br />
ESFERA UNIVERSAL SLU, Madrid /Spain 13,672 100.00<br />
Estacion de autobuses de Ferrol S.A.,<br />
Ferrol /Spain 192 80.14<br />
EUROBUS-INVEST Regionalis<br />
Kozlkedesfejlesztesi Zrt, Budapest /Hungary 1,572,114 100.00<br />
EUROBUS-INVEST SLOVAKIA, s.r.o.,<br />
Komarno /Slovakia –2,465 100.00<br />
Eurocare Travel Ltd,<br />
Sunderland /Great Britain 253 100.00<br />
Excel Gatwick Limited,<br />
Sunderland /Great Britain 0 100.00<br />
Excel Passenger Logistics Limited,<br />
Sunderland /Great Britain 0 100.00<br />
Fareway Passenger Services Limited,<br />
Sunderland /Great Britain 1 100.00<br />
Fickling Investments Limited,<br />
Sunderland /Great Britain 0 100.00<br />
Flight Delay Services Limited,<br />
Sunderland /Great Britain 0 100.00<br />
Foxhound Limited,<br />
Sunderland /Great Britain –1,402 100.00<br />
Great North Eastern Railway Company Ltd,<br />
York /Great Britain 0 75.10<br />
Great North Western Railway Company Ltd,<br />
York /Great Britain 0 75.10<br />
Green Travel Limited,<br />
Sunderland /Great Britain 3 100.00<br />
Greenline Travel Ltd,<br />
Sunderland /Great Britain 8 100.00<br />
Grey Green Ltd, Sunderland /Great Britain 8 100.00<br />
Guildford &West Surrey Buses Limited,<br />
Sunderland /Great Britain 3 100.00<br />
Hanger Trucks Limited,<br />
Sunderland /Great Britain –1,194 100.00<br />
Hoppanstopper Ltd,<br />
Sunderland /Great Britain 3 100.00<br />
Horsham Buses Limited,<br />
Sunderland /Great Britain 62 100.00
| CONSOLIDATED FINANCIAL STATEMENTS<br />
| Notes<br />
247<br />
Subsidiary [ Name and domicile ]<br />
Equity<br />
in TLC 6)<br />
Ownership<br />
in %<br />
Hylton Castle Motors Limited,<br />
Sunderland /Great Britain 84 100.00<br />
INFRA-S, spol. s .r.o., Komarno /Slovakia 1,120 100.00<br />
INTER-BUS INVEST Befektetesi Zrt,<br />
Budapest /Hungary 1,137.913 100.00<br />
JTL 2004 ApS, Kastrup /Denmark 9,216 100.00<br />
JTL 2009 ApS, Kastrup /Denmark 5,294 100.00<br />
Jylland Transport Service ApS,<br />
Kastrup /Denmark 867 100.00<br />
K Line Travel Ltd, Sunderland /Great Britain 195 100.00<br />
Kennan Investments Limited,<br />
Sunderland /Great Britain 0 100.00<br />
Lecco Trasporti S.c.a.r.l., Lecco /Italy 10 56.94<br />
Linkline Coaches Limited,<br />
Sunderland /Great Britain 1 100.00<br />
Liverline Travel Services Limited,<br />
Sunderland /Great Britain 1 100.00<br />
LJ Transit (Southern) Limited,<br />
Sunderland /Great Britain 0 100.00<br />
London & Country Bus (North West) Ltd,<br />
Sunderland /Great Britain 0 100.00<br />
London & Country Ltd,<br />
Sunderland /Great Britain 282 100.00<br />
London and Northwestern Railway Company<br />
Limited, Sunderland /Great Britain –3,373 99.97<br />
London Pride (Bus Sales) Ltd,<br />
Sunderland /Great Britain 65 100.00<br />
London Pride Bus and Coach Sales Ltd,<br />
Sunderland /Great Britain 41 100.00<br />
London Pride Engineering Ltd,<br />
Sunderland /Great Britain 0 100.00<br />
London Pride Group Ltd,<br />
Sunderland /Great Britain 452 100.00<br />
London Pride Sightseeing Ltd,<br />
Sunderland /Great Britain 1,579 100.00<br />
Londonlinks Buses Limited,<br />
Sunderland /Great Britain –6 100.00<br />
LSK Leasing A/S, Kastrup /Denmark 2,565 100.00<br />
Maidstone & District Advertising Limited,<br />
Sunderland /Great Britain –13 100.00<br />
Maidstone & District Motor Services Ltd,<br />
Sunderland /Great Britain 1,046 100.00<br />
Maldencrest Limited,<br />
Sunderland /Great Britain 1 100.00<br />
Meadowhall Limited,<br />
Sunderland /Great Britain 52 100.00<br />
Merseyrail Electrics Limited,<br />
Sunderland /Great Britain 0 100.00<br />
Merseyrider Limited,<br />
Sunderland /Great Britain 66 100.00<br />
Merseyside Transport Limited,<br />
Sunderland /Great Britain 0 100.00<br />
Milton Keynes Coaches Ltd,<br />
Sunderland /Great Britain 0 100.00<br />
MK Metro Ltd,<br />
Sunderland /Great Britain 7,062 100.00<br />
Subsidiary [ Name and domicile ]<br />
Equity<br />
in TLC 6)<br />
Ownership<br />
in %<br />
Moor-dale Coaches Limited ,<br />
Sunderland /Great Britain 553 100.00<br />
Motor Coach (Holdings) Limited,<br />
Sunderland /Great Britain 553 100.00<br />
MTL (Heysham) Limited,<br />
Sunderland /Great Britain 0 100.00<br />
MTL Asset Management Limited,<br />
Sunderland /Great Britain 0 100.00<br />
MTL Northern Limited,<br />
Sunderland /Great Britain 0 100.00<br />
MTL Services Limited,<br />
Sunderland /Great Britain 29,946 100.00<br />
MTL Transport Limited,<br />
Sunderland /Great Britain 8 100.00<br />
MTL Transport Services Limited,<br />
Sunderland /Great Britain –589 100.00<br />
MTL Trust Holdings Limited,<br />
Sunderland /Great Britain –1 100.00<br />
NETOSEC SLU, Madrid /Spain 293 100.00<br />
Network Colchester Limited,<br />
Sunderland /Great Britain 335 100.00<br />
New Enterprise Coaches (Tonbridge) Limited,<br />
Sunderland /Great Britain –274 100.00<br />
North British Bus Limited,<br />
Sunderland /Great Britain 2,369 100.00<br />
North East Bus Limited,<br />
Sunderland /Great Britain 16,234 100.00<br />
North East Bus Properties Limited,<br />
Sunderland /Great Britain 118 100.00<br />
North Western Road Car Company Limited,<br />
Sunderland /Great Britain 26 100.00<br />
Northern Spirit Limited,<br />
Sunderland /Great Britain 0 100.00<br />
Northern Spirit Rail Limited,<br />
Sunderland /Great Britain 0 100.00<br />
Northern Spirit Services Limited,<br />
Sunderland /Great Britain 25 100.00<br />
Northern Spirit Trains Limited,<br />
Sunderland /Great Britain 0 100.00<br />
Northern Spirit Transport Limited,<br />
Sunderland /Great Britain 0 100.00<br />
Northern Spirit Travel Limited,<br />
Sunderland /Great Britain 0 100.00<br />
Northumbria Motor Services Limited,<br />
Sunderland /Great Britain 126 100.00<br />
NV Arriva Groningen,<br />
Heerenveen /the Netherlands 4,311 100.00<br />
NV Personeel de Noord-Westhoek,<br />
Heerenveen /the Netherlands 421 100.00<br />
OFJ Connections Limited,<br />
Sunderland /Great Britain 0 100.00<br />
OFJ Ground Services Limited,<br />
Sunderland /Great Britain 1 100.00<br />
OSNADO spol. s.r.o.,<br />
Svoboda nad Upou /Czech Republic 54,952 100.00<br />
Peter Sherratt Limited,<br />
Sunderland /Great Britain 0 100.00
248<br />
| DEUTSCHE BAHN GROUP<br />
Subsidiary [ Name and domicile ]<br />
Equity<br />
in TLC 6)<br />
Ownership<br />
in %<br />
Pickerings Transport Services Limited,<br />
Sunderland /Great Britain 1,024 100.00<br />
Premier Buses Ltd,<br />
Sunderland /Great Britain 2,102 100.00<br />
Proudmutual Fleet Management Ltd.,<br />
Sunderland /Great Britain 221 100.00<br />
Regional Railways North East Limited,<br />
Sunderland /Great Britain 0 100.00<br />
RIVIERA TRASPORTI LINEA S.P.A.,<br />
Imperia /Italy 325 79.99<br />
Runway Motors (Bristol) Limited,<br />
Sunderland /Great Britain 0 100.00<br />
S.A.B. AUTOSERVIZI S.R.L., Bergamo /Italy 27,356 99.99<br />
S.A.L. Servizi automobilistici Lecchesi S.R.L.,<br />
Lecco /Italy 5,736 99.99<br />
S.I.A. Societa Italiana Autoservizi S.P.A.,<br />
Brescia /Italy 36,860 99.99<br />
SAB Piemonte S.r.l. a socio unico,<br />
Grugliasco (TO)/Italy 6,780 99.99<br />
SAD-BUSZ Szemelyszallitasi es Szolgaltato Kft,<br />
Szekesfehervar/Hungary 6,754 72.25<br />
SADEM – SOCIETA‘ PER AZIONI, Turint /Italy 19,572 99.99<br />
SAIA TRASPORTI S.P.A., Brescia /Italy 19,862 99.99<br />
SBM ApS, Kastrup /Denmark –52,742 100.00<br />
Selby and District Bus Company Limited,<br />
Sunderland /Great Britain 8 100.00<br />
SERVICIOS INTEGRALES BUS &TRUCK S.A.,<br />
Madrid /Spain 180 100.00<br />
Slovenska autobusova doprava Michalovce, a.s.,<br />
Michalovce /Slovakia 8,551 60.14<br />
Slovenska autobusova doprava Nove Zamky,<br />
a.s., Nove Zamky/Slovakia 6,777 60.36<br />
South Lancs Transport Limited,<br />
Sunderland /Great Britain 120 100.00<br />
Stevensons Bus Services Limited,<br />
Sunderland /Great Britain 0 100.00<br />
Stevensons of Uttoxeter Limited,<br />
Sunderland /Great Britain 374 100.00<br />
STRM ApS, Kastrup /Denmark 74 100.00<br />
T.Cowie Property Developments (Sheffield)<br />
Limited, Sunderland /Great Britain –130 100.00<br />
Tees and District Transport Company Limited,<br />
Sunderland /Great Britain 0 100.00<br />
Teeside Motor Services Limited,<br />
Sunderland /Great Britain 3 100.00<br />
Teesside Bus Services Ltd,<br />
Sunderland /Great Britain 0 100.00<br />
Tellings Golden Miller Group Limited,<br />
Sunderland /Great Britain 7,714 100.00<br />
Tellings Golden Miller Limited,<br />
Sunderland /Great Britain –1,280 100.00<br />
TGM Group Limited,<br />
Sunderland /Great Britain –6,530 100.00<br />
The Beeline Buzz Company Limited,<br />
Sunderland /Great Britain 3,743 100.00<br />
Subsidiary [ Name and domicile ]<br />
Equity<br />
in TLC 6)<br />
Ownership<br />
in %<br />
The Keep Motor Group (Epsom) Limited,<br />
Sunderland /Great Britain 0 100.00<br />
The Keep Motor Group (High Wycombe)<br />
Limited, Sunderland /Great Britain 0 100.00<br />
The Keep Motor Group (Wolverhampton)<br />
Limited, Sunderland /Great Britain 0 100.00<br />
The Keep Motor Group (Worcester) Limited,<br />
Sunderland /Great Britain 0 100.00<br />
The Keep Trust Limited,<br />
Sunderland /Great Britain 0 100.00<br />
The Original London Sightseeing Tour Ltd,<br />
Sunderland /Great Britain 5,309 100.00<br />
The Original Passenger Picture Show Limited,<br />
Sunderland /Great Britain 880 100.00<br />
The Proudmutual Transport Group Limited,<br />
Sunderland /Great Britain 102 100.00<br />
Transcare Solutions Limited,<br />
Sunderland /Great Britain –65 100.00<br />
TRANSCENTRUM bus s.r.o.,<br />
Kosmonosy/Czech Republic 65,667 100.00<br />
Transportes Sul do Tejo S.A.,<br />
Almada /Portugal 9,493 99.99<br />
TRANSURBANOS DE GUIMARAES TP, LDA,<br />
Guimarães /Portugal 1,137 99.99<br />
Trasporti Brescia Nord S.c.a.r.l.,<br />
Brescia /Italy 100 91.99<br />
Trasporti Brescia Sud S.c.a.r.l.,<br />
Brescia /Italy 100 92.99<br />
Trolebuses Coruna Carballo S.A.,<br />
Ferrol /Spain 2,570 98.38<br />
TUF-TRANSPORTES URBANOS DE FAMALICAO, LDA,<br />
Vila Nova de Famalicao /Portugal –423 66.66<br />
U Drive Rental Limited,<br />
Sunderland /Great Britain 0 100.00<br />
Uddannelsescenteret for kollektiv trafik A/S,<br />
Kastrup /Denmark 20,545 100.00<br />
United Automobile Services Limited,<br />
Sunderland /Great Britain 13,085 100.00<br />
Upperchance Limited,<br />
Sunderland /Great Britain 0 100.00<br />
Utbildningscenteret för kollektivtrafikken AB,<br />
Malmö /Sweden 10,609 100.00<br />
Viajes Ideal S.L., Ferrol /Spain 3 100.00<br />
Viking Tours and Travel Limited,<br />
Sunderland /Great Britain 245 100.00<br />
VSK Bus 2007 A/S, Kastrup /Denmark 386,961 100.00<br />
WBL gmbH, Berlin 9,684 100.00<br />
West Riding Automobile Company Limited,<br />
Sunderland /Great Britain 0 100.00<br />
XC Trains Limited,<br />
Sunderland /Great Britain 77,445 100.00<br />
Yorkshire Bus Group Ltd,<br />
Sunderland /Great Britain 38,541 100.00<br />
Yorkshire Bus Holdings Ltd,<br />
Sunderland /Great Britain 34,408 100.00
| CONSOLIDATED FINANCIAL STATEMENTS<br />
| Notes<br />
249<br />
Subsidiary [ Name and domicile ]<br />
Equity<br />
in TLC 6)<br />
Ownership<br />
in %<br />
Yorkshire Woolen District Transport Co Limited,<br />
Sunderland /Great Britain 68 100.00<br />
AT EQUITY<br />
Aquabus BV, Heerenveen /the Netherlands 7), 8) 4,050 50.00<br />
Barraqueiro SGPS SA, Lisbon /Portugal 215,299 21.50<br />
Bergamo Trasporti Sud Scarl, Bergamo /Italy 7) 10 25.57<br />
Bus Center Srl, Rodengo Saiano (BS)/Italy 14) –2 45.00<br />
Bus Point Srl, Lallio (BG)/Italy 7) 114 30.00<br />
Centrebus Holdings Limited,<br />
Leicester/Great Britain 14) 155 40.00<br />
Estacion Autobuses de Pobra, Ferrol /Spain 9 33.33<br />
Explotacion Gasoleos de la Coruna, s.l.,<br />
Ferrol /Spain 98 40.00<br />
Garda Trasporti Scarl,<br />
Desenzano del Garda (BS)/Italy 7) 20 23.00<br />
Great Park Bus Company Limited,<br />
Sunderland /Great Britain 14) 0 50.00<br />
Intercambiador de Transportes<br />
Principe PIO S.A., Madrid /Spain 9,066 30.00<br />
KM S.P.A., Cremona /Italy 14) 4,043 49.00<br />
Omnibus partecipazioni S.R.L.,<br />
Milan /Italy 7) 7,810 50.00<br />
Prometro S.A., Porto /Portugal 7), 8) 3,804 20.00<br />
PTI (South East) Limited,<br />
Sunderland /Great Britain 14) 238 20.00<br />
Rodinform – Informatica Aplicada aos<br />
Transportes, SA, Lisbon /Portugal 14) 182 20.00<br />
S.I.T. VALLEE SOC. CONS. AR.L.,<br />
Charvensod (AO)/Italy 7), 8) 150 20.00<br />
TPL FVG Scarl s.r.l., Gorizia /Italy 7), 8) 81 15.00<br />
Trieste Trasporti S.P.A., Trieste /Italy 7) 43,678 39.94<br />
Union Ferrolana de Transportes S.A.,<br />
Ferrol /Spain 9) 2 50.00<br />
Veroercombinatie Noord B.V.,<br />
Heerenveen /the Netherlands 8) 37 33.00<br />
VIAJEROS DEL EO SL, Ferrol /Spain 9) 9 50.00<br />
VT-Transman Szemelyszallito es<br />
Szolgaltato Kft, Szekesfehervar/Hungary 8) 1,105,045 49.91<br />
DB SCHENKER RAIL<br />
FULLY CONSOLIDATED<br />
“TRAWIPOL” Sp. z o.o., Gliwice /Poland 22,010 100.00<br />
Activa Rail S.A., Madrid /Spain 19 77.32<br />
ATG Autotransportlogistic Sp. z o. o.,<br />
Malaszewicze /Poland 255 100.00<br />
Autologistic Poland Sp. z o. o., Tychy/Poland 2,417 51.00<br />
Auxiliar Logística de Vehiculos S.L.,<br />
Saragossa /Spain 13 65.28<br />
Axiom Rail (Cambridge) Limited,<br />
Doncaster/Great Britain 457 100.00<br />
Axiom Rail (Stoke) Limited,<br />
Doncaster/Great Britain –6,973 100.00<br />
Axiom Rail Components Limited,<br />
Doncaster/Great Britain –2,769 100.00<br />
Axiom Rail SAS, Paris /France –233 100.00<br />
Boreal & Austral Railfreight Ltd,<br />
Doncaster/Great Britain 67,500 100.00<br />
Subsidiary [ Name and domicile ]<br />
Equity<br />
in TLC 6)<br />
Ownership<br />
in %<br />
Compañía Aragonesa de Portacoches S.A.,<br />
Saragossa /Spain 13,546 65.28<br />
Container Szállítmányátrakó Állomás Kft.,<br />
Györ/Hungary 104 1) 100.00<br />
container-Terminal Púchov s. r. o.,<br />
Púchov/Slovakia 297 100.00<br />
Contiwaggon SA, Freiburg /Switzerland 15,710 77.32<br />
DB Intermodal Services GmbH, Mainz 7) 4,131 100.00<br />
DB Polska Acquisition Sp. z.o.o,<br />
Warsaw /Poland 796,015 100.00<br />
DB PORT SZCZECIN Sp. z o.o.,<br />
Szczecin /Poland 14,647 93.40<br />
DB Schenker BTT GmbH, Mainz 7) 2,061 100.00<br />
DB Schenker Nieten GmbH, Freilassing 7) 3,989 100.00<br />
DB Schenker Rail (UK) Limited,<br />
Doncaster/Great Britain 159,966 100.00<br />
DB Schenker Rail Automotive GmbH,<br />
Kelsterbach 7) 11,748 100.00<br />
DB Schenker Rail Bulgaria EOOD,<br />
Sofia /Bulgaria 1,153 100.00<br />
DB Schenker Rail Coaltran Sp. z o.o.,<br />
Warsaw /Poland 18,899 100.00<br />
DB Schenker Rail Corridor Operations GmbH,<br />
Mainz 47 98.00<br />
DB Schenker Rail Danmark Services A/S,<br />
Taastrup /Denmark 4,589 100.00<br />
DB Schenker Rail Deutschland<br />
Aktiengesellschaft, Mainz 7) 464,773 98.00<br />
DB Schenker Rail GmbH, Mainz 7) 650,934 98.00<br />
DB Schenker Rail Italia S.r.L.,<br />
Alessandria /Italy 13,210 98.00<br />
DB Schenker Rail Italia Services S.r.l.,<br />
Milan /Italy 470 98.00<br />
DB Schenker Rail Lok-Wag S.A. i. L.,<br />
Jaworzno /Poland 363 100.00<br />
DB Schenker Rail Nederland N.V.,<br />
Utrecht /the Netherlands –32,642 98.00<br />
DB Schenker Rail Polska S.A.,<br />
Jaworzno /Poland 461,688 100.00<br />
DB Schenker Rail Rybnik S.A.,<br />
Rybnik /Poland 206,375 100.00<br />
DB Schenker Rail Scandinavia A/S,<br />
Taastrup /Denmark 306,048 49.98<br />
DB Schenker Rail Schweiz GmbH,<br />
Opfikon /Switzerland 992 98.00<br />
DB Schenker Rail Slawkow S.A. i. L.,<br />
Slawkow/Poland 1,874 100.00<br />
DB Schenker Rail Spedkol Sp. z o.o.,<br />
Kedzierzyn-Kozle /Poland 27,872 100.00<br />
DB Schenker Rail Tabor S.A., Rybnik /Poland 38,407 100.00<br />
DB Schenker Rail Zabrze S.A., Zabrze /Poland 177,472 100.00<br />
<strong>Deutsche</strong> TRANSFESA GmbH Internationale<br />
Eisenbahn-Spezial-Transporte, Kehl /Rhein 856 77.32<br />
Doker-Port Sp. z o.o., Szczecin /Poland –302 58.38<br />
DUSS Italia Terminal s.r.l., Verona /Italy 124 80.00<br />
East & West Railway Ltd,<br />
Doncaster/Great Britain 0 100.00
250<br />
| DEUTSCHE BAHN GROUP<br />
Subsidiary [ Name and domicile ]<br />
Equity<br />
in TLC 6)<br />
Ownership<br />
in %<br />
Energoport Sp. z o.o., Rybnik /Poland 40,376 100.00<br />
Engineering Support Group Ltd,<br />
Doncaster/Great Britain 3,158 100.00<br />
English Welsh & Scottish Railway Holdings Ltd,<br />
Doncaster/Great Britain 267,224 100.00<br />
English Welsh & Scottish Railway<br />
International Ltd, Doncaster/Great Britain –9,961 100.00<br />
Euro Cargo Rail S.A., Madrid /Spain –1,508 100.00<br />
Euro Cargo Rail SAS, Paris /France 43,905 100.00<br />
EW& S Trustees Ltd, Doncaster/Great Britain 0 100.00<br />
EWS Information Services Ltd,<br />
Doncaster/Great Britain 521 100.00<br />
Guga B.V., Amsterdam /the Netherlands 5,999 77.32<br />
Infra Silesia S.A., Rybnik /Poland 7,379 100.00<br />
LGP Lagerhausgesellschaft Pfullendorf mbH,<br />
Pfullendorf 279 49.08<br />
Loadhaul Ltd, Doncaster/Great Britain 16,131 100.00<br />
Locomotive 6667 Ltd,<br />
Doncaster/Great Britain 0 100.00<br />
Logistic Center Hungaria Kft., Györ/Hungary 285,527 100.00<br />
Logistic Services Danubius S.R.L.,<br />
Temeswar/Romania 37,780 98.00<br />
Logística Sanmival S.L., Burgos /Spain 342 57.99<br />
Mainline Freight Ltd, Doncaster/Great Britain 21,266 100.00<br />
Marcroft Holdings Ltd,<br />
Doncaster/Great Britain –3,097 100.00<br />
MDL Distribución y Logistica S.A.,<br />
Madrid /Spain 2,586 77.32<br />
MDL Servicios de Marketing y Logística S.A.,<br />
Barcelona /Spain 336 77.32<br />
Mitteldeutsche Eisenbahn GmbH, Schkopau 7) 1,953 78.40<br />
Nadwislanski Zaklad Transportu Kolejowego<br />
Sp. z o.o., Miedzna /Poland 44,252 100.00<br />
New Locomotive Finance Ltd,<br />
Doncaster/Great Britain 0 100.00<br />
NordCargo S.r.l, Milan /Italy 6,934 58.80<br />
OOO Railion Russija Services,<br />
Moscow/Russia 52,346 98.00<br />
PRZEDSIEBIORSTWO INWESTYCYJNO-TECHNICZNE<br />
“INTECHKOP” Sp. z o.o., Katowice /Poland 285 71.75<br />
PRZEDSIEBIORSTWO USLUG TRANSPORTOWYCH<br />
“TRANS PAK” Sp. z o.o., Konin /Poland 5,792 100.00<br />
Rail Cargo East Sp.z.o.o., Warsaw /Poland 91 99.60<br />
Rail Express Systems Ltd,<br />
Doncaster/Great Britain 29,681 100.00<br />
Rail Service Center Rotterdam B.V.,<br />
Rotterdam /the Netherlands 8,425 98.00<br />
Rail Terminal Services Limited,<br />
Doncaster/Great Britain –2,104 100.00<br />
Railway Approvals Ltd,<br />
Doncaster/Great Britain 1,366 100.00<br />
Railway Investments Ltd,<br />
Doncaster/Great Britain 68,907 100.00<br />
RBH Logistics GmbH, Gladbeck 7) 37,917 98.00<br />
Subsidiary [ Name and domicile ]<br />
Equity<br />
in TLC 6)<br />
Ownership<br />
in %<br />
RES December Ltd, Doncaster/Great Britain 16,048 100.00<br />
T.M.T. (Transporte Marítimo Terrestre),<br />
Cantabria /Spain 253 46.39<br />
TGP Terminalgesellschaft Pfullendorf mbH,<br />
Pfullendorf 239 75.50<br />
Transervi France S.A.S., Cerbère /France 368 77.32<br />
Transervi S.A., Madrid /Spain 1,529 77.32<br />
Transfesa Benelux S.P.R.L., Brussels /Belgium 238 77.32<br />
Transfesa Distribución y Logistica S.L.,<br />
Madrid /Spain 14,193 77.32<br />
Transfesa France SAS, Gennevilliers /France 2,018 77.32<br />
Transfesa Italia S.r.l., Milan /Italy 185 77.32<br />
Transfesa Portugal Lda., Lisbon /Portugal 847 77.32<br />
Transfesa UK Ltd.,<br />
Rainham (Essex)/Great Britain 329 77.32<br />
Transportes Ferroviarios Especiales S.A.,<br />
Madrid /Spain 187,767 77.32<br />
Transportes Jouchoux España S.L.,<br />
Valencia /Spain 222 77.32<br />
Zehlendorfer Eisenbahn- und Hafen<br />
Gesellschaft mit beschränkter Haftung, Berlin 7) 474 98.00<br />
AT EQUITY<br />
ATN Auto Terminal Neuss GmbH & Co. KG,<br />
Neuss 7), 9) 3,567 50.00<br />
Auto Logistic Spain S.A., Madrid /Spain 7 ), 11) 455 50.00<br />
Autoterminal Slask Logistic Sp.z.o.o.,<br />
Dabrowa Gornicza /Poland 14,701 50.00<br />
Autotrax Limited, Lufton /Great Britain 24.00<br />
BLS Cargo <strong>AG</strong>, Bern /Switzerland 7), 9) 93,817 44.10<br />
Cererail A.E.I.E., Madrid /Spain 25.77<br />
Container Terminal Dortmund GmbH,<br />
Dortmund 7), 9) 2,295 30.00<br />
Corridor Operations NMBS /SNCB<br />
DB Schenker Rail N.V., Brussels /Belgium 48.02<br />
CTS Container-Terminal GmbH<br />
Rhein-See-Land-Service, Cologne 7), 9) 3,395 22.50<br />
DAP Barging B.V.,<br />
Rotterdam /the Netherlands 7), 9) 2,233 53.90<br />
DCH Düsseldorfer Container-Hafen GmbH,<br />
Düsseldorf 7), 9) 559 51.00<br />
Doerpener Umschlaggesellschaft für den<br />
kombinierten Verkehr mbH (DUK), Dörpen 7), 9) 3,395 35.00<br />
Elevator-Gesellschaft mit beschränkter<br />
Haftung, Hanover 245 50.00<br />
EuroShuttle A/S i.L.,<br />
Copenhagen /Denmark 7 ), 13) 17,302 26.54<br />
Hansa Rail GmbH i.L., Frankfurt am Main 10) 260 49.00<br />
Hispanauto – Empresas Agrupadas A.E.I.E. ©,<br />
Madrid /Spain 0 58.04<br />
INTERCONTAINER – INTERFRIGO SA,<br />
Brussels /Belgium 7), 9) 4,893 1) 35.66<br />
Kombiverkehr <strong>Deutsche</strong> Gesellschaft für<br />
kombinierten Güterverkehr mbH& Co.<br />
Kommanditgesellschaft, Frankfurt am Main 7), 9) 14,999 50.00
| CONSOLIDATED FINANCIAL STATEMENTS<br />
| Notes<br />
251<br />
Subsidiary [ Name and domicile ]<br />
Equity<br />
in TLC 6)<br />
Ownership<br />
in %<br />
Lokomotion Gesellschaft für<br />
Schienentraktion mbH, Munich 7), 9) 5,638 29.40<br />
METRANS a. s., Prague /Czech Republic 97,409 1) 34.33<br />
OFP La Rochelle Maritime Rail Services SAS,<br />
La Rochelle /France 24.90<br />
Omfesa Logistica S.A., Madrid /Spain 3,050 38.66<br />
OPTIMODAL NEDERLAND B.V.,<br />
Rotterdam /the Netherlands 7 ), 10) 300 23.85<br />
PKV Planungsgesellschaft kombinierter<br />
Verkehr Duisburg mbH, Duisburg 7), 9) 897 50.00<br />
POLZUG Intermodal GmbH, Hamburg 8) 6,787 33.33<br />
Pool Ibérico Ferroviario A.E.I.E.,<br />
Madrid /Spain 0 9.02<br />
PORT HANDLOWY SWINOUJSCIE Sp. z o.o.,<br />
Swinoujscie /Poland 7) 15,706 42.80<br />
Rail Euro Concept SAS i.L.,<br />
Levallois-Perret /France 7 ), 10) 193 49.00<br />
Railmax B.V., Nijmegen /the Netherlands 87 38.66<br />
Railmax C.V., Nijmegen /the Netherlands 9) 192 38.27<br />
SLASKIE CENTRUM LOGISTYKI S.A.,<br />
Gliwice /Poland 21.86<br />
Sociedad de Estudios y Explotacion Material<br />
Auxiliar de Transportes, S.A. (“SEMAT”),<br />
Madrid /Spain 7) 12,268 48.56<br />
Stifa S.A., Alverca de Ribatejo /Portugal –85 38.66<br />
Terminal Singen TSG GmbH, Singen 7), 9) 589 50.00<br />
TFG Transfracht Internationale Gesellschaft<br />
für kombinierten Güterverkehr mbH& Co. KG,<br />
Frankfurt am Main –707 50.00<br />
TFG Verwaltungs GmbH, Frankfurt am Main 7) 127 50.00<br />
Trans-Eurasia Logistics GmbH, Berlin 7), 9) 306 30.00<br />
Vistula Rail Operator Sp. z o.o.,<br />
Swiecie /Poland 7) 1,497 50.00<br />
Xrail S.A., Brussels /Belgium 31.76<br />
ZAO Eurasia Rail Logistics i.L.,<br />
Mosow/Russia 7 ), 10) 1,675 34.20<br />
DB SCHENKER LOGISTICS<br />
FULLY CONSOLIDATED<br />
Air Terminal Handling S.A.,<br />
Tremblay en France /France 1,066 94.50<br />
AkeriTerminal Bilspedition Aktiebolag,<br />
Tranas /Sweden 1,523 58.33<br />
ALB Automative Logistica LTDA,<br />
Juiz de Fora – MG /Brasil 3,377 51.00<br />
Anterist & Schneider GmbH, Saarbrücken 7) 7,021 100.00<br />
Anterist + Schneider Automotive Service GmbH,<br />
Saarwellingen 7) 2,662 100.00<br />
Anterist + Schneider Logistik GmbH,<br />
Zwenkau 295 100.00<br />
Anterist + Schneider Möbel-Logistik GmbH,<br />
Saarbrücken 7) 88 100.00<br />
Anterist + Schneider Zeebrugge B.V.,<br />
Zeebrugge /Belgium 355 100.00<br />
AS Schenker, Tallinn /Estonia 336,851 100.00<br />
Subsidiary [ Name and domicile ]<br />
Equity<br />
in TLC 6)<br />
Ownership<br />
in %<br />
ASIMEX Anterist + Schneider Import – Export<br />
S.a.r.L., Stiring-Wendel /France 713 100.00<br />
ATLANTIQUE EXPRESS SAS,<br />
Montaigu Cedex /France 357 99.91<br />
BAX Global (Aust.) Pty Ltd.,<br />
Alexandria /Australia 190 100.00<br />
BAX Global (Israel) Ltd., Ramat Gan /Israel –4,023 100.00<br />
BAX Global (Malaysia) Sdn. Bhd.,<br />
Petaling Jaya /Malaysia – 3,231 100.00<br />
BAX Global (Pty.) Ltd.,<br />
Johannesburg /South Africa 10 100.00<br />
BAX Global (Thailand) Limited,<br />
Bangkok /Thailand 391,106 49.00<br />
BAX Global (UK) Limited,<br />
London /Great Britain 7,979 100.00<br />
BAX Global B.V.,<br />
Haarlemmermeer/the Netherlands 9,081 100.00<br />
BAX Global Cartage Pty Ltd.,<br />
Alexandria /Australia 0 100.00<br />
BAX Global EPE Transportation<br />
Freight Forwarding & Logistics Solutions,<br />
Athens /Greece 52 100.00<br />
BAX Global Holding, S.L.U.,<br />
Barcelona /Spain 20,155 100.00<br />
BAX Global Holdings Pty Ltd.,<br />
Alexandria /Australia 0 100.00<br />
BAX Global Inc., Irvine /USA 135,674 100.00<br />
BAX Global Kft., Csor/Hungary – 40,005 100.00<br />
BAX Global Limited, London /Great Britain 2,738 100.00<br />
BAX Global Limited, Hong Kong /Hong Kong 23,044 100.00<br />
BAX Global Logistics (Shanghai) Co. Ltd.,<br />
Shanghai /China 159,528 100.00<br />
BAX Global Logistics Sdn.Bhd.,<br />
Petaling Jaya /Malaysia 90,916 100.00<br />
BAX Global Networks B.V.,<br />
Ridderkerk /the Netherlands 50,702 100.00<br />
BAX Holdings Inc.,<br />
Makati City/the Philippines 0 100.00<br />
BEMI JOYAU SCI, Montaigu Cedex /France 123 99.94<br />
Bilspedition Transport & Logistics AB,<br />
Göteborg /Sweden 4,500 100.00<br />
Bischof Betriebsführungsgesellschaft mbH,<br />
Vienna /Austria 38 100.00<br />
Bosch y Bassols Distribuciones y<br />
Almacenases S.L., Barcelona /Spain 101 100.00<br />
Bosch y Bassols S.A., Mataro /Spain 867 100.00<br />
BTL AB, Göteborg /Sweden 3,678,822 100.00<br />
BTL International AB, Göteborg /Sweden 160,376 100.00<br />
BTL Nord GmbH, Lübeck 19,843 100.00<br />
BTL Reinsurance S.A.,<br />
Luxembourg /Luxembourg 61,832 3) 100.00<br />
Cold Stores AB, Göteborg /Sweden 408,959 100.00<br />
<strong>Deutsche</strong> <strong>Bahn</strong> Iberica Holding, S.L.,<br />
Barcelona /Spain 188,703 100.00<br />
DP Schenker, Kiev/Ukraine –9,247 100.00
252<br />
| DEUTSCHE BAHN GROUP<br />
Subsidiary [ Name and domicile ]<br />
Equity<br />
in TLC 6)<br />
Ownership<br />
in %<br />
Dritte Kommanditgesellschaft<br />
Stinnes Immobiliendienst GmbH& Co. KG,<br />
Mülheim an der Ruhr 10,857 100.00<br />
ECO-Trucking GmbH, Coburg 7) 50 100.00<br />
EL<strong>AG</strong> Emder Lagerhaus und Automotive GmbH,<br />
Emden 7) 1,363 100.00<br />
ELSPED Speditions-Gesellschaft m.b.H.,<br />
Hamburg 7) 3,663 100.00<br />
Engelberg Transportes Internacionales C.A.<br />
(Entra), Caracas /Venezuela 5,560 100.00<br />
EV<strong>AG</strong> Emder Verkehrs und Automotive<br />
Gesellschaft mbH, Emden 7) 1,262 100.00<br />
EVB Handelshaus Bour GmbH,<br />
Landau in der Pfalz 7) 25 100.00<br />
Facility Plus B.V., Tilburg /the Netherlands 855 100.00<br />
Fastighets Aktiebolaget Orbyn,<br />
Göteborg /Sweden 11,167 100.00<br />
Fastighetsaktiebolaget Kylen 1,<br />
Göteborg /Sweden 3,870 100.00<br />
Fertrans <strong>AG</strong>, Buchs /Switzerland 6,635 100.00<br />
FERTRANS d.o.o. za medunarodni prijevoz,<br />
Zagreb /Croatia –2,059 100.00<br />
General de Manipulacion y Almacenases S.A.<br />
(Gemalsa), Barcelona /Spain 186 100.00<br />
General de Transportes Zona Central, S.A.,<br />
Alcala de Menares (Madrid)/Spain –3,806 100.00<br />
H. Albrecht Speditions Gesellschaft mit<br />
beschränkter Haftung, Frankfurt am Main 7) 460 100.00<br />
HANGARTNER S.r.l., Verona /Italy 4,953 100.00<br />
HANGARTNER Terminal <strong>AG</strong>, Aarau /Switzerland –201 100.00<br />
HANGARTNER Terminal S.r.l., Verona /Italy 1,391 100.00<br />
HB Zolldeklarationsservice GmbH,<br />
Vienna /Austria 158 100.00<br />
Herber Hausner Süd-Ost Speditionsgesellschaft<br />
m.b.H., Vienna /Austria 1,789 100.00<br />
Herber Hausner Szállitmányozási Kft.,<br />
Budapest /Hungary 88,956 100.00<br />
I.C.S. “Schenker” S.R.L, Chisinau /Moldova –492 100.00<br />
Intertec Asia Limited,<br />
Sheung Wan /Hong Kong 233 100.00<br />
Intertec GmbH, Landau in der Pfalz 7) 26 100.00<br />
INTERTEC Polska Sp.zo.o., Nardarzyn /Poland 769 100.00<br />
Intertec Retail Logistics GmbH,<br />
Landau in der Pfalz 7) 26 100.00<br />
Inter-Union Technohandel Gesellschaft m.b.H.,<br />
Vienna /Austria 19 100.00<br />
Inter-Union Technohandel GmbH,<br />
Landau in der Pfalz 7) 26 100.00<br />
Intreprinderea Mixta Moldo-Romana<br />
“Balcantir” S.R.L., Chisinau /Moldova 3,302 97.21<br />
Joyau S.A., Montaigu Cedex /France 12,791 99.94<br />
Karpeles Flight Services GmbH,<br />
Frankfurt am Main 7) 1,698 100.00<br />
KB Ädelgasen 1 -Jönköping,<br />
Jönköping /Sweden 114,388 100.00<br />
Subsidiary [ Name and domicile ]<br />
Equity<br />
in TLC 6)<br />
Ownership<br />
in %<br />
KB Älghunden Jönköping, Jönköping /Sweden 20,248 100.00<br />
KB Älghunden 1 -Jönköping,<br />
Jönköping /Sweden 28,334 100.00<br />
KB Anholt 3, Stockholm /Sweden 9,203 100.00<br />
KB Arbetsbasen 4 -Stockholm,<br />
Stockholm /Sweden 42,384 100.00<br />
KB Ättehögen Östra 1 -Helsingborg,<br />
Helsingborg /Sweden 59,832 100.00<br />
KB Backa 107:3 -Göteborg, Göteborg /Sweden 128,113 100.00<br />
KB Backa 107:4 -Göteborg, Göteborg /Sweden 33,707 100.00<br />
KB Backa 107:5 -Göteborg, Göteborg /Sweden 27,585 100.00<br />
KB Baggböle 2:35 -Umeå, Umeå /Sweden 21,486 100.00<br />
KB Benkammen 12 -Malmö, Malmö /Sweden 118,467 100.00<br />
KB Bleckslagaren 9 -Örebro, Örebro /Sweden 20,459 100.00<br />
KB Bleket 1 -Karlstad, Karlstad /Sweden 40,099 100.00<br />
KB Distributören 3 och 4 -Örebro,<br />
Örebro /Sweden 79,493 100.00<br />
KB Forsmark 2 -Stockholm,<br />
Stockholm /Sweden 63,979 100.00<br />
KB Forsmark 3 -Stockholm,<br />
Stockholm /Sweden 159,424 100.00<br />
KB Forsmark 5 Stockholm, Göteborg /Sweden –305 100.00<br />
KB Frysen 1 Visby, Visby/Sweden 16,392 100.00<br />
KB Fryshuset 3-Visby , Visby/Sweden 813 100.00<br />
KB Gurkan 2 -Eslöv, Eslöv/Sweden 31,336 100.00<br />
KB Hajen 19 Göteborg, Göteborg /Sweden 39,850 100.00<br />
KB Husby 4:2 -Sigtuna, Sigtuna /Sweden 4 100.00<br />
KB Husby 6:7 -Sigtuna, Sigtuna /Sweden 1 100.00<br />
KB Jordbromalm 4:4 -Haninge,<br />
Haninge /Sweden 48,085 100.00<br />
KB Kolet 4 -Malmö, Malmö /Sweden 24,502 100.00<br />
KB Köpmannen 10 -Västerås,<br />
Västerås /Sweden 34,536 100.00<br />
KB Kungsängen 28:1 -Uppsala,<br />
Uppsala /Sweden 13,559 100.00<br />
KB Langtradaren 2 -Borlänge,<br />
Borlänge /Sweden 33,986 100.00<br />
KB Lertaget 1, Skara, Skara /Sweden 46,376 100.00<br />
KB Malmö Hamnen 22 Malmö,<br />
Malmö /Sweden 65,891 100.00<br />
KB Maskinen 3 -Linköping,<br />
Linköping /Sweden 57,880 100.00<br />
KB Neonljuset 3 -Eskilstuna,<br />
Eskilstuna /Sweden 4,978 100.00<br />
KB Önnestad 108:4 -Kristianstad,<br />
Kristianstad /Sweden 40,788 100.00<br />
KB Överön 1:66 -Örnsköldsvik,<br />
Örnsköldsvik /Sweden 10,816 100.00<br />
KB Pantern 1 -Växjö, Växjö /Sweden 36,825 100.00<br />
KB Reläet 8 -Norrköping,<br />
Norrköping /Sweden 29,471 100.00<br />
KB Sandstuhagen 3 -Stockholm,<br />
Stockholm /Sweden 26,578 100.00<br />
KB Sockret 4 -Malmö, Malmö /Sweden 3,075 100.00
| CONSOLIDATED FINANCIAL STATEMENTS<br />
| Notes<br />
253<br />
Subsidiary [ Name and domicile ]<br />
Equity<br />
in TLC 6)<br />
Ownership<br />
in %<br />
KB Sörby 24:3 -Gävle, Gävle /Sweden 33,723 100.00<br />
KB Storheden 1:8 -Luleå, Luleå /Sweden 28,259 100.00<br />
KB Tigern 10 -Kalmar, Kalmar/Sweden 11,057 100.00<br />
KB Tingstadsvassen 31:3 -Göteborg,<br />
Göteborg /Sweden 44,802 100.00<br />
KB Transporten 1 -Hultsfred,<br />
Hultsfred /Sweden 18,603 100.00<br />
KB Transportören 1 -Värnamo,<br />
Värnamo /Sweden 82,321 100.00<br />
KB Viken 3 -Karlshamn, Karlshamn /Sweden 11,584 100.00<br />
KB Vindtrycket 1 -Borås, Borås /Sweden 62,524 100.00<br />
KB Vivstamon 1:13 -Timrå, Timrå /Sweden 52,601 100.00<br />
Kiinteistö Oy Ferryroad, Helsinki /Finland –235 100.00<br />
Kiinteistö Oy Helsingin Metsäläntie 2–4,<br />
Helsinki /Finland 4,783 100.00<br />
Kiinteistö Oy Kaakon Terminaali,<br />
Lappeenranta /Finland 128 100.00<br />
Kiinteistö Oy Porin Kiitolinja,<br />
Björneborg /Finland 152 100.00<br />
Kiinteistö Oy Reininkatu 9, Vasa /Finland 89 100.00<br />
Kiinteistö Oy Seinäjoen Kiitolinja-asema,<br />
Seinäjoki /Finland 86 100.00<br />
Kiinteistö Oy Tampereen Rahtiasema,<br />
Helsinki /Finland 374 100.00<br />
Kiinteistö Oy Tir-Trans,<br />
Joentaustankatu /Finland 421 100.00<br />
Kiinteistö Oy Turun Nosturinkatu 6,<br />
Abo /Finland 1,181 100.00<br />
Kiinteistö Oy Varastohotelli, Tikkurilantie,<br />
Vantaa /Finland 1,468 100.00<br />
Kiinteistömaaliikenne Oy, Helsinki /Finland 1,912 54.70<br />
Kommanditgesellschaft Stinnes<br />
Immobiliendienst GmbH& Co., Emden 51 100.00<br />
Langtradaren i Jämtland AB,<br />
Göteborg /Sweden 5,861 100.00<br />
Logidocks S.L., Barcelona /Spain 1,002 100.00<br />
Nordisk Bilspedition AB,<br />
Göteborg /Sweden 14,436 100.00<br />
Oy Schenker East AB, Helsinki /Finland 54,231 100.00<br />
Rengaslinja Oy, Helsinki /Finland 235 100.00<br />
Romtrans Benelux N.V., Antwerp /Belgium 103 66.67<br />
Romtrans GmbH Internationale<br />
Speditionsgesellschaft i.L., Munich –17 100.00<br />
Romtrans Holiday Ltd., Eforie Sud,<br />
Constanţa /Romania –42 100.00<br />
Romtrans Impex Ltd., Bucharest /Romania 59 100.00<br />
Scansped S.A., Mitry-Mory<br />
Cedex /France 1,267 100.00<br />
Scanspol Sp. z o. o. Warsaw /Poland 2,642 99.60<br />
Scantrans SAS, Rouen /France 437 100.00<br />
SCHENKER &Co. <strong>AG</strong>, Vienna /Austria 165,466 100.00<br />
Schenker (Asia Pacific) Pte. Ltd.,<br />
Singapore /Singapore 201,872 100.00<br />
Subsidiary [ Name and domicile ]<br />
Equity<br />
in TLC 6)<br />
Ownership<br />
in %<br />
Schenker (BAX) Europe Holding GmbH,<br />
Essen 7) 289,355 100.00<br />
Schenker (BAX) Holding Asia Limited,<br />
Hong Kong /Hong Kong 1,805,184 100.00<br />
Schenker (BAX) Holding Corp.,<br />
Delaware /USA 144,788 100.00<br />
Schenker (H.K.) Ltd., Hong Kong /Hong Kong 208,495 100.00<br />
Schenker (Ireland ) Ltd., Shannon /Ireland 14,335 100.00<br />
Schenker (L.L.C),<br />
Dubai /United Arab Emirates 19,940 60.00<br />
Schenker (NZ) Ltd., Auckland /New Zealand 790 100.00<br />
Schenker (Thai) Holdings Ltd.,<br />
Bangkok /Thailand 49,520 49.00<br />
Schenker (Thai) Ltd., Bangkok /Thailand 1,006,190 49.00<br />
Schenker A.E., Athens /Greece 2,108 100.00<br />
Schenker A/S, Hvidovre /Denmark 123,225 100.00<br />
Schenker AB, Göteborg /Sweden 439,355 100.00<br />
SCHENKER AIR TRANSPORT GmbH,<br />
Kelsterbach 7) 230 100.00<br />
Schenker Akeri AB, Göteborg /Sweden 8,766 100.00<br />
Schenker Aktiengesellschaft, Essen 7) 898,718 100.00<br />
Schenker Argentina S.A.,<br />
Buenos Aires /Argentina – 6,159 100.00<br />
Schenker AS, Oslo /Norway 592,114 100.00<br />
Schenker Australia Pty. Ltd.,<br />
Alexandria /Australia 226,520 100.00<br />
Schenker B.V., Tilburg /the Netherlands 16,956 100.00<br />
SCHENKER BETEILIGUNGS GmbH, Dortmund 7) 26 100.00<br />
SCHENKER BETEILIGUNGS GmbH & Co. OHG,<br />
Mülheim an der Ruhr 0 100.00<br />
Schenker BITCC Customs Broker (Beijing)<br />
Co. Ltd., Beijing /China 1,146 70.00<br />
Schenker BITCC Logistics (Beijing) Co., Ltd.,<br />
Beijing /China 63,090 70.00<br />
Schenker Cargo Oy, Turku /Finland 18,844 100.00<br />
Schenker Chile S.A., Santiago /Chile 5,276,689 100.00<br />
Schenker China Ltd., Pudong,<br />
Shanghai /China 1,243,299 100.00<br />
Schenker Consulting AB, Göteborg /Sweden 12,793 100.00<br />
Schenker Customs Agency B.V.,<br />
Rotterdam /the Netherlands –63 100.00<br />
Schenker d.d, Ljubljana /Slovenia 16,287 100.00<br />
SCHENKER d.o.o.,<br />
Sarajevo /Bosnia and Herzegovina 1,125 100.00<br />
Schenker d.o.o., Zagreb /Croatia 16,120 100.00<br />
Schenker d.o.o., Belgrade /Serbia 62,504 100.00<br />
Schenker Dedicated Services AB,<br />
Göteborg /Sweden 19,235 100.00<br />
Schenker Deutschland <strong>AG</strong>,<br />
Frankfurt am Main 7) 56 100.00<br />
Schenker do Brasil Transportes<br />
Internacionais Ltda., São Paulo /Brazil 26,134 100.00<br />
SCHENKER DOOEL, Skopje /Macedonia 33,753 100.00<br />
Schenker Egypt Ltd., Cairo /Egypt 417 60.00
254<br />
| DEUTSCHE BAHN GROUP<br />
Subsidiary [ Name and domicile ]<br />
Equity<br />
in TLC 6)<br />
Ownership<br />
in %<br />
SCHENKER EOOD, Sofia /Bulgaria 8,747 100.00<br />
Schenker Espana, S.A.,<br />
Coslada /Madrid (Spain) 12,222 100.00<br />
Schenker Filen 8 Aktiebolag,<br />
Göteborg /Sweden 3,924 100.00<br />
Schenker High Tech Logistics B.V.,<br />
Rotterdam /the Netherlands 15,358 100.00<br />
Schenker Holdings (NZ) Limited,<br />
Auckland /New Zealand 2,798 100.00<br />
SCHENKER INDIA PRIVATE LIMITED,<br />
New Delhi /India 1,763,668 100.00<br />
Schenker International (HK) Ltd.,<br />
Hong Kong /Hong Kong 1,831,015 100.00<br />
Schenker International (Macau) Ltd.,<br />
Macao /Macao 35,324 4) 100.00<br />
Schenker International AB,<br />
Göteborg /Sweden 1,238,769 100.00<br />
SCHENKER INTERNATIONAL<br />
AKTIENGESELLSCHAFT, Essen 7) 56 100.00<br />
Schenker International B.V.,<br />
Rotterdam /the Netherlands 13,420 100.00<br />
Schenker International S.A. de C.V.,<br />
Mexico /Mexico 361,727 100.00<br />
Schenker Ireland Holding Limited,<br />
Dublin /Ireland 19,701 100.00<br />
Schenker Italiana S.p.A., Peschiera /Italy 52,541 100.00<br />
Schenker Korea Ltd., Seoul /South Korea 31,819,424 100.00<br />
Schenker Limited, London /Great Britain 30,674 100.00<br />
Schenker Logistics (Chongqing) Co. Ltd,<br />
Chongqing /China 5,282 100.00<br />
Schenker Logistics (Guangzhou)<br />
Company Ltd., Guangzhou /China 64,954 100.00<br />
Schenker Logistics (Malaysia) Sdn Bhd.,<br />
Kuala Lumpur/Malaysia 100,896 100.00<br />
Schenker Logistics (Shanghai) Co., Ltd.,<br />
Shanghai /China 20,833 100.00<br />
Schenker Logistics (Shenzhen) Co. Ltd.,<br />
Shenzhen /China 13,316 100.00<br />
Schenker Logistics (Suzhou) Company Ltd.,<br />
Suzhou /China 106,759 100.00<br />
Schenker Logistics (Xiamen) Co. Ltd.,<br />
Xiamen /China 46,542 100.00<br />
Schenker Logistics AB, Göteborg /Sweden 29,376 100.00<br />
Schenker Logistics Inc.,<br />
Calamba City/the Philippines 23,125 100.00<br />
Schenker Logistics LTD, Lod /Israel 100.00<br />
Schenker Logistics, Inc.,<br />
Greensboro, NC /USA 15,033 100.00<br />
Schenker Ltd., Nairobi /Kenya 93,266 100.00<br />
SCHENKER LUXEMBURG GMBH,<br />
Leudelange /Luxembourg 316 100.00<br />
Schenker Malaysia Sdn. Bhd.,<br />
Kuala Lumpur/Malaysia 14,122 100.00<br />
Schenker Maroc S.a.r.l.,<br />
Casablanca /Morocco 11,743 100.00<br />
Schenker Mauritanie SAS,<br />
Nouakchott /Mauritania –130,116 100.00<br />
Subsidiary [ Name and domicile ]<br />
Equity<br />
in TLC 6)<br />
Ownership<br />
in %<br />
Schenker Mauritius (Malaysian Holdings) Ltd.,<br />
Port Louis /Mauritius 35,931 5) 100.00<br />
Schenker Mauritius (Thai Holdings) Ltd.,<br />
Port Louis /Mauritius 35,118 5) 100.00<br />
Schenker Metafores A.G. i. L.,<br />
Athens /Greece 786 100.00<br />
Schenker Middle East FZE,<br />
Dubai /United Arab Emirates 5,725 100.00<br />
SCHENKER N.V., Antwerp /Belgium 24,089 100.00<br />
Schenker Nederland Holding B.V.,<br />
Rotterdam /the Netherlands –3,341 100.00<br />
Schenker Nemzetközi Szallitmanyozasi es<br />
Logisztikai Kft., Budapest /Hungary 2,815,599 100.00<br />
Schenker NIGHT PLUS GmbH, Wülfrath 7) 25 100.00<br />
Schenker North AB, Göteborg /Sweden 994,805 100.00<br />
Schenker o.g. Beheer B.V.,<br />
Tilburg /the Netherlands 4,163 100.00<br />
Schenker of Canada Ltd., Toronto /Canada 119,192 100.00<br />
Schenker OY, Helsinki /Finland 22,721 100.00<br />
Schenker Peru S.R.L., Lima /Peru 6,135 100.00<br />
Schenker Petrolog Utama, PT,<br />
Jakarta /Indonesia 13,272 5) 71.00<br />
Schenker Philippines, Inc.,<br />
Makati City/the Philippines 466,467 100.00<br />
Schenker Privpak AB, Boras /Sweden 3,095 100.00<br />
Schenker Privpak AS, Oslo /Norway –13,697 100.00<br />
Schenker Property Sweden AB,<br />
Göteborg /Sweden 117,471 100.00<br />
Schenker Re Limited, Dublin /Ireland 45,571 100.00<br />
Schenker Romtrans S.A., Bucharest /Romania 365,360 100.00<br />
Schenker Russia LLC, Moscow/Russia 874 100.00<br />
Schenker S.A., Guatemala City/Guatemala –7,691 100.00<br />
SCHENKER s.r.o., Bratislava /Slovakia 1,751 100.00<br />
Schenker SA, Gennevilliers /France 104,536 100.00<br />
Schenker Saudi Arabia LLC,<br />
Riad /Saudi Arabia 3,318 100.00<br />
Schenker Schweiz <strong>AG</strong>, Zurich /Switzerland 86,164 100.00<br />
Schenker Shared Services (Nanjing) Co. Ltd.,<br />
Nanjing /China 6,085 100.00<br />
Schenker Singapore (PTE) Ltd.,<br />
International Forwarders,<br />
Singapore /Singapore 164,825 100.00<br />
Schenker South Africa (Pty) Ltd.,<br />
Isando /South Africa 121,574 100.00<br />
Schenker Sp.zo.o., Warsaw /Poland 216,428 99.60<br />
SCHENKER spol. s r.o., Prague /Czech Republic 178,580 100.00<br />
Schenker Transitarios, S.A., Loures /Portugal 2,280 100.00<br />
Schenker Transport Aktiebolag,<br />
Göteborg /Sweden 70,879 100.00<br />
Schenker Transport Groep B.V.,<br />
Tilburg /the Netherlands 332 100.00<br />
Schenker Vastgoed B.V.,<br />
Enschede /the Netherlands 1,761 100.00<br />
Schenker Vietnam Co., Ltd.,<br />
Ho Chi Minh City (Saigon)/Vietnam 3,681 5) 51.00
| CONSOLIDATED FINANCIAL STATEMENTS<br />
| Notes<br />
255<br />
Subsidiary [ Name and domicile ]<br />
Equity<br />
in TLC 6)<br />
Ownership<br />
in %<br />
Schenker Warehousing & Customs Brokerage<br />
(Xiamen) Co. Ltd., Xiamen /China 2,832 100.00<br />
Schenker, Inc., New York /USA 65,125 100.00<br />
Schenker-Arkas Nakliyat Ve Tic. A.S.,<br />
Zincirlikuyu /Turkey 27,567 55.00<br />
Schenker-Gemadept Logistics Vietnam<br />
Company Limited, Binh Duong Province /Vietnam 731 5) 51.00<br />
SCHENKER-JOYAU SAS,<br />
Montaigu Cedex /France 18,333 99.94<br />
Schenkerocean Ltd, Wanchai /Hong Kong 17,179 100.00<br />
Schenker-Seino Co. Ltd., Tokyo /Japan 4,366,589 60.00<br />
SIA Schenker, Riga /Latvia 2,109 100.00<br />
SIA Sky Partners, Riga /Latvia 5 100.00<br />
Sky Partners OÜ, Tallinn /Estonia 13,715 100.00<br />
SPAIN TIR Centro Transportes Internacionales S.A.,<br />
Coslada (Madrid)/Spain 5,990 100.00<br />
Spain Tir Norte, Transportes Internacionales,<br />
S.A., Zaisa /Spain 2,147 100.00<br />
SPAIN-TIR Transportes Internacionales S.A.,<br />
Barcelona /Spain 129,660 100.00<br />
Star Global (Shanghai) Ltd.,<br />
Shanghai /China 458 100.00<br />
Star Global International (HK) Ltd.,<br />
Hong Kong /Hong Kong –874 100.00<br />
Star Global Services Limited,<br />
Hong Kong /Hong Kong 4,552 100.00<br />
Stinnes (UK) Limited, Feltham,<br />
Middlesex /Great Britain 21,750 100.00<br />
Stinnes Danmark A/S, Hvidovre /Denmark 119,578 100.00<br />
Stinnes Immobiliendienst GmbH& Co. KG,<br />
Mülheim an der Ruhr 1,609 100.00<br />
Stinnes Immobiliendienst Verwaltungsgesellschaft<br />
mbH, Mülheim an der Ruhr 7) –89 100.00<br />
SW Zoll-Beratung GmbH, Dortmund 2,568 100.00<br />
TEGRO <strong>AG</strong>, Schwerzenbach /Switzerland 13,287 90.00<br />
TLS Transa Logistik & Service GmbH,<br />
Offenbach am Main 7) 268 100.00<br />
Traficos Comerciales E Inmobiliarios SL,<br />
Barcelona /Spain 86,019 100.00<br />
Trafikaktiebolaget NP Kagström,<br />
Göteborg /Sweden 2,277 100.00<br />
Tramex, S.A., Poligono Malpica /Spain –242 100.00<br />
TRANSA Spedition GmbH,<br />
Offenbach am Main 7) 13,205 100.00<br />
Transorient SA, Bucharest /Romania 4,242 54.00<br />
Transport Gesellschaft mbH, Hamburg 538 96.70<br />
Transworld Asig – Broker de Asigurare Ltd.,<br />
Bucharest /Romania 256 100.00<br />
Trilag Geschäftsführungs GmbH, Trier 7) 27 100.00<br />
UAB “Schenker”, Vilnius /Lithuania 4,068 100.00<br />
Viktor E. Kern Gesellschaft m.b.H.,<br />
Vienna /Austria 1,240 100.00<br />
ZAO Schenker, Moscow/Russia 101,960 100.00<br />
ZAO Schenker Russija, Moscow/Russia 226,394 100.00<br />
Subsidiary [ Name and domicile ]<br />
Equity<br />
in TLC 6)<br />
Ownership<br />
in %<br />
Zweite Kommanditgesellschaft<br />
Stinnes Immobiliendienst GmbH& Co.,<br />
Mülheim an der Ruhr 113,889 100.00<br />
AT EQUITY<br />
ATS Air Transport Service <strong>AG</strong>,<br />
Zurich /Switzerland 8) 7,906 26.00<br />
Autoport Emden GmbH, Emden 77 33.30<br />
Bäckebols Akeri AB,<br />
Hisings Backa /Sweden 8) 53,050 35.00<br />
BTU – Bilspedition Transportörer<br />
Utvecklings AB, Solna /Sweden 9) 6,237 50.00<br />
DASH Global Logistics SAS,<br />
Saint Julien /France 41 50.00<br />
Express Air Systems GmbH (EASY), Kriftel 8) 2,758 50.00<br />
Gardermoen Perishables Center AS,<br />
Gardermoen /Norway 8) 4,360 33.30<br />
Germans Corbalan & Alvarez, S.L.,<br />
Manresa (Barcelona)/Spain 8) 257 20.00<br />
Halmstadsakarnas Fastighets AB,<br />
Halmstad /Sweden 8) 16,971 31.44<br />
Immo Fumeron S.A.R.L., Arnage /France 8) 377 27.98<br />
LogCap-IR Grundverwertungsgesellschaft mbH,<br />
Vienna /Austria 4,603 49.00<br />
Moldromukrtrans SRL, Chisinau /Moldova 16,859 33.33<br />
Speditionsbau und Verwertungsgesellschaft<br />
m.b.H., Salzburg /Austria 9) 50 25.00<br />
Titan Containers Romania SRL,<br />
Constanţa /Romania 207 20.00<br />
Trans Jelabel S.L.,<br />
Aldeamayorde S Martin /Spain 8) 453 20.00<br />
Transatlantic Shipping and Trading SRL,<br />
Bucharest /Romania 930 50.00<br />
Värnamo Akeri AB, Värnamo /Sweden 8) 14,364 50.00<br />
Volla Eiendom AS, Oslo /Norway 8) 10,503 50.00<br />
DB SERVICES<br />
FULLY CONSOLIDATED<br />
DB Dienstleistungen GmbH, Berlin 7) 618,562 100.00<br />
DB Fahrzeuginstandhaltung GmbH,<br />
Frankfurt am Main 7) 177,168 100.00<br />
DB FuhrparkService GmbH,<br />
Frankfurt am Main 7) 3,650 100.00<br />
DB Kommunikationstechnik GmbH, Berlin 7) 4,028 100.00<br />
DB Rent GmbH, Frankfurt am Main 7) 18 100.00<br />
DB Services Nord GmbH, Hamburg 7) 1,240 100.00<br />
DB Services Nordost GmbH, Berlin 7) 317 100.00<br />
DB Services Süd GmbH, Munich 7) 1,550 100.00<br />
DB Services Südost GmbH, Leipzig 7) 363 100.00<br />
DB Services Südwest GmbH,<br />
Frankfurt am Main 7) 1,871 100.00<br />
DB Services West GmbH, Cologne 7) 1,111 100.00<br />
DB Sicherheit GmbH, Berlin 7) 1,247 100.00<br />
DB Systel GmbH, Frankfurt am Main 7) 161,032 100.00<br />
DB Waggonbau Niesky GmbH, Niesky 11,813 100.00
256<br />
| DEUTSCHE BAHN GROUP<br />
Subsidiary [ Name and domicile ]<br />
Equity<br />
in TLC 6)<br />
Ownership<br />
in %<br />
AT EQUITY<br />
Leipziger Servicebetriebe (LSB) GmbH,<br />
Leipzig 7), 9) 285 49.00<br />
DB NETZE TRACK<br />
FULLY CONSOLIDATED<br />
DB <strong>Bahn</strong>bau Gruppe GmbH, Berlin 7) 28,224 100.00<br />
DB Fahrwegdienste GmbH, Berlin 7) 2,870 100.00<br />
DB Netz Aktiengesellschaft,<br />
Frankfurt am Main 7) 7,318,307 100.00<br />
DB RegioNetz Infrastruktur GmbH,<br />
Frankfurt am Main 7) 1,494 100.00<br />
<strong>Deutsche</strong> Umschlaggesellschaft Schiene –<br />
Straße (DUSS) mbH, Bodenheim am Rhein 7) 2,948 87.50<br />
AT EQUITY<br />
EEIG Corridor Rotterdam-Genoa EWIV,<br />
Frankfurt am Main 7 ), 10) 0 33.33<br />
Güterverkehrszentrum Entwicklungsgesellschaft<br />
Dresden mbH, Dresden 7), 9) 1,523 24.53<br />
MegaHub Lehrte Betreibergesellschaft mbH,<br />
Hanover 7 ), 11) 1,198 29.17<br />
S-<strong>Bahn</strong> Tunnel Leipzig GmbH i. L.,<br />
Leipzig 7 ), 16 ) 81 30.00<br />
TKN Terminal Köln-Nord GmbH, Cologne 7), 9) 24 42.88<br />
TriCon Container-Terminal Nürnberg GmbH,<br />
Nuremberg 7), 9) 137 21.88<br />
DB NETZE STATIONS<br />
FULLY CONSOLIDATED<br />
DB <strong>Bahn</strong>Park GmbH, Berlin 2,830 51.00<br />
DB Station & Service Aktiengesellschaft,<br />
Berlin 7) 1,496,682 100.00<br />
AT COST<br />
Immobilien-Vermietungsgesellschaft<br />
Schumacher& Co Objekt <strong>Bahn</strong>höfe<br />
Deutschland KG, Düsseldorf 7 ), 9), 17 ) –21,872 100.00<br />
TUDO Grundstücks-Vermietungsgesellschaft<br />
mbH & Co. Objekt <strong>Bahn</strong>höfe KG Düsseldorf,<br />
Düsseldorf 7 ), 9), 17 ) –2,541 100.00<br />
DB NETZE ENERGY<br />
FULLY CONSOLIDATED<br />
DB Energie GmbH, Frankfurt am Main 7) 665,247 100.00<br />
OTHER SUBSIDIARIES<br />
FULLY CONSOLIDATED<br />
AMEROPA-REISEN GmbH,<br />
Bad Homburg v.d. Höhe 7) 2,748 100.00<br />
CLG Lagerhaus GmbH i. L., Mannheim –1,201 100.00<br />
DB (UK) Logistics Holdings Limited,<br />
Doncaster/Great Britain 7) 1,880,045 100.00<br />
DB Akademie GmbH, Potsdam 6,034 100.00<br />
DB Belgie Holding BVBA, Antwerp /Belgium 19 100.00<br />
DB Consult GmbH, Berlin 716 100.00<br />
DB Danmark Holding ApS, Taastrup /Denmark 210,043 100.00<br />
DB Dialog Telefonservice GmbH, Berlin 7) 885 100.00<br />
Subsidiary [ Name and domicile ]<br />
Equity<br />
in TLC 6)<br />
Ownership<br />
in %<br />
DB France Holding SAS,<br />
Gennevilliers Cedex /France 529,214 100.00<br />
DB Gastronomie GmbH, Frankfurt am Main 7) 792 100.00<br />
DB Hungaria Holding Kft.,<br />
Budapest /Hungary 11,039,475 100.00<br />
DB International GmbH, Berlin 7) 31,812 100.00<br />
DB International USA, Inc., Delaware /USA 284 100.00<br />
DB JobService GmbH, Berlin 7) 875 100.00<br />
DB Media & Buch GmbH, Kassel 7) 26 100.00<br />
DB Mobility Logistics <strong>AG</strong>, Berlin 7) 2,697,632 100.00<br />
DB Nederland Holding B.V.,<br />
Utrecht /the Netherlands 18 100.00<br />
DB Polska Holding Sp.z.o.o, Warsaw /Poland 1,716,744 100.00<br />
DB ProjektBau GmbH, Berlin 7) 26,471 100.00<br />
DB Services Immobilien GmbH, Berlin 7) – 410 100.00<br />
DB UK Holding Limited,<br />
Doncaster/Great Britain 1,884,991 100.00<br />
DB US Corporation, Tarrytown /USA 256,383 100.00<br />
DB US Holding Corporation, Tarrytown /USA 290,399 100.00<br />
DB Vertrieb GmbH, Frankfurt am Main 7) 5,974 100.00<br />
DB Zeitarbeit GmbH, Berlin 7) –295 100.00<br />
<strong>Deutsche</strong> <strong>Bahn</strong> Aktiengesellschaft, Berlin 15,328,720 100.00<br />
<strong>Deutsche</strong> <strong>Bahn</strong> Finance B. V.,<br />
Amsterdam /the Netherlands 57,355 100.00<br />
<strong>Deutsche</strong> <strong>Bahn</strong> France Voyages &Tourisme<br />
SARL, Paris /France 221 100.00<br />
<strong>Deutsche</strong> <strong>Bahn</strong> Romania Holding S.R.L.,<br />
Bucharest /Romania 0 100.00<br />
<strong>Deutsche</strong> Industrieholz GmbH, Essen 733 29.15<br />
Die <strong>Bahn</strong> DB Demiryollari Limited Sirketi,<br />
Istanbul Bagcilar/Turkey 25 99.95<br />
DVA <strong>Deutsche</strong> Verkehrs-Assekuranz-<br />
Vermittlungs-GmbH, Bad Homburg 7) 3,217 65.00<br />
DVA REINSURANCE LIMITED, Dublin /Ireland 5,368 65.00<br />
Frank & Schulte GmbH, Essen 26 100.00<br />
GI-Consult Geo Information Consult GmbH,<br />
Berlin 2,509 50.00<br />
GI-CONSULT GEO INFORMATION CONSULT Polska<br />
Sp.zo.o., Warsaw /Poland 35 1) 50.00<br />
Grundstückspool Potsdam Center GbR mbH,<br />
Berlin 70.00<br />
HD ocel s.r.o., Prague /Czech Republic –9,047 100.00<br />
HEROS Rail Rent GmbH, Fürth 15) 3,621 2.00<br />
Mataki Kemi AB, Malmö /Sweden 19,113 100.00<br />
Precision National Plating Services, Inc.,<br />
Delaware /USA –11,204 100.00<br />
Stinnes Beteiligungs-Verwaltungs GmbH,<br />
Essen 7) 175,181 100.00<br />
Stinnes Grundstücke GmbH& Co.<br />
Sanitär Heizung Fliesen Immobilien KG,<br />
Mülheim an der Ruhr 22,268 100.00
| CONSOLIDATED FINANCIAL STATEMENTS<br />
| Notes<br />
257<br />
Subsidiary [ Name and domicile ]<br />
Equity<br />
in TLC 6)<br />
Ownership<br />
in %<br />
Stinnes Handel GmbH & Co. Beteiligungs OHG,<br />
Essen –89 100.00<br />
Stinnes Holz GmbH, Essen 420 53.00<br />
Stinnes International <strong>AG</strong>, Zug /Switzerland 602 100.00<br />
Stinnes Logistics GmbH, Essen 7) 2,754 100.00<br />
Stinnes Montan Gesellschaft mit beschränkter<br />
Haftung i.L., Essen 182 100.00<br />
Stinnes ocel s.r.o., Prague /Czech Republic 2,074 100.00<br />
UBB Polska Sp.z o.o., Swinemünde /Poland 79 100.00<br />
UBB Usedomer Bäderbahn GmbH,<br />
Heringsdorf 7) 2,442 100.00<br />
Unterstützungskasse der Firma H.M.<br />
Gehrckens Gesellschaft mit beschränkter<br />
Haftung, Hamburg 263 100.00<br />
Vienna Consult Verkehrsberatungsgesellschaft<br />
mbH, Vienna /Austria 75 100.00<br />
Zweite Kommanditgesellschaft Stinnes<br />
Immobiliendienst GmbH& Co., Berlin 56 100.00<br />
AT EQUITY<br />
ALSTOM Lokomotiven Service GmbH,<br />
Stendal 7) 19,484 49.00<br />
<strong>Bahn</strong>flächenEntwicklungsGesellschaft<br />
NRW mbH, Essen 7), 8) 218 49.90<br />
Beijing HuaJing DeBo International Engineering<br />
Consulting Co., Ltd, Beijing /China 25.00<br />
BwFuhrparkService GmbH, Troisdorf 7), 9) 98,000 24.90<br />
CD-DUSS Terminal, a.s.,<br />
Lovosice /Czech Republic 7 ), 10) 6,753 49.00<br />
EUROFIMA Europäische Gesellschaft für<br />
die Finanzierung von Eisenbahnmaterial,<br />
Basel /Switzerland 7), 8) 1,439,847 22.60<br />
Innovationszentrum für Mobilität und<br />
gesellschaftlichen Wandel (InnoZ) GmbH,<br />
Berlin 7), 9) 54 50.40<br />
Qatar Railways Development Company,<br />
Doha /Katar 49.00<br />
Rail Technology Company Limited,<br />
Jeddah /Saudi Arabia 24.90<br />
SSG Saar-Service GmbH, Saarbrücken 7), 9) 1,416 25.50<br />
AT COST<br />
TREMA Grundstücks-Vermietungsgesellschaft<br />
mbH & Co. Objekt <strong>Bahn</strong>höfe West KG,<br />
Berlin 7 ), 9), 17 ) 4,128 94.00<br />
TRENTO Grundstücks-Vermietungsgesellschaft<br />
mbH & Co. Objekt <strong>Bahn</strong>höfe Ost KG,<br />
Düsseldorf 7 ), 9), 17 ) –87 100.00<br />
1)<br />
Euro<br />
2) GBP<br />
3) SEK<br />
4) HKD<br />
5)<br />
USD<br />
6) IFRS data<br />
7)<br />
Local GAAP data<br />
8)<br />
Preliminary data<br />
9)<br />
Data: 2009 financial year<br />
10)<br />
Data: 2008 financial year<br />
11)<br />
Data: 2007 financial year<br />
12)<br />
Data: 2006 financial year<br />
13)<br />
Data: 2005 financial year<br />
14)<br />
Data: Interim balance sheet as of Aug 31, <strong>2010</strong><br />
15)<br />
Inclusion in the consolidated financial statements according to<br />
SIC-12 (Consolidation – Special Purpose Entities)<br />
16)<br />
Data: Final liquidation balance sheet 2004<br />
17)<br />
Inclusion has been omitted, as DB <strong>AG</strong> cannot exercise control with<br />
respect to these subsidiaries.<br />
Figures in thousand local currency (TLC);<br />
ownership calculated in indirect ownership
258<br />
| DEUTSCHE BAHN GROUP<br />
(42) Management Board and<br />
Supervisory Board<br />
The names and mandates of the members<br />
of the Supervisory Board and the Management<br />
Board of DB <strong>AG</strong> are as follows:<br />
MAN<strong>AG</strong>EMENT BOARD<br />
a Dr. Rüdiger Grube<br />
Chief Executive Officer and Chairman of the<br />
Management Board, Chief Executive Officer<br />
and Chairman of the Management Board<br />
of DB Mobility Logistics <strong>AG</strong>,<br />
Gechingen<br />
a) DB Netz <strong>AG</strong> 1) (Chairman)<br />
DEVK <strong>Deutsche</strong> Eisenbahn Versicherung<br />
Lebensversicherungsverein a.G.<br />
Betriebliche Sozialeinrichtung der<br />
<strong>Deutsche</strong>n <strong>Bahn</strong><br />
DEVK <strong>Deutsche</strong> Eisenbahn Versicherung<br />
Sach- und HUK-Versicherungsverein a.G.<br />
Betriebliche Sozialeinrichtung der<br />
<strong>Deutsche</strong>n <strong>Bahn</strong><br />
b) Arriva Plc, Sunderland/Great Britain 1)<br />
(Board of Directors)<br />
<strong>Deutsche</strong> Bank <strong>AG</strong><br />
(Advisory Board operating region<br />
Stuttgart)<br />
a Gerd Becht<br />
Compliance, Privacy and Legal Affairs,<br />
Member of the Management Board<br />
of DB Mobility Logistics <strong>AG</strong>,<br />
Bad Homburg<br />
a) DB Schenker Rail Deutschland <strong>AG</strong> 1)<br />
DB International GmbH 1)<br />
DB Sicherheit GmbH 1)<br />
DEVK Rückversicherungs- und<br />
Beteiligungs-Aktiengesellschaft<br />
b) DEVK <strong>Deutsche</strong> Eisenbahn Versicherung<br />
Sach- und HUK-Versicherungsverein a.G.<br />
Betriebliche Sozialeinrichtung<br />
der <strong>Deutsche</strong>n <strong>Bahn</strong> (Advisory Board)<br />
a Stefan Garber<br />
Infrastructure,<br />
Bad Homburg<br />
– up to March 31, <strong>2010</strong> –<br />
a) DB Station& Service <strong>AG</strong> 1) (Chairman)<br />
DB Energie GmbH 1) (Chairman)<br />
DB ProjektBau GmbH 1) (Chairman)<br />
Sparda-Bank Baden-Württemberg eG<br />
b) IDUNA Lebensversicherung a.G.<br />
Signal Iduna Gruppe (Advisory Board)<br />
a Dr. Volker Kefer<br />
Rail Technology and Services,<br />
Infrastructure (since March 24, <strong>2010</strong>),<br />
Member of the Management Board<br />
of DB Mobility Logistics <strong>AG</strong>,<br />
Erlangen<br />
a) DB Energie GmbH 1) (Chairman)<br />
DB International GmbH 1) (Chairman)<br />
DB ProjektBau GmbH 1) (Chairman)<br />
DB Station& Service <strong>AG</strong> 1) (Chairman)<br />
b) DB Dienstleistungen GmbH 1)<br />
(Advisory Board, Chairman)<br />
DEVK <strong>Deutsche</strong> Eisenbahn Versicherung<br />
Sach- und HUK-Versicherungsverein a.G.<br />
Betriebliche Sozialeinrichtung<br />
der <strong>Deutsche</strong>n <strong>Bahn</strong> (Advisory Board)<br />
a Dr. Richard Lutz<br />
Chief Financial Officer,<br />
Member of the Management Board<br />
of DB Mobility Logistics <strong>AG</strong>,<br />
Hoppegarten (Mark)<br />
– since April 1, <strong>2010</strong> –<br />
a) DB Netz <strong>AG</strong> 1)<br />
b) Arriva Plc, Sunderland/Great Britain 1)<br />
(Board of Directors)<br />
a Diethelm Sack<br />
Chief Financial Officer,<br />
Member of the Management Board<br />
of DB Mobility Logistics <strong>AG</strong>,<br />
Frankfurt am Main<br />
– March 31, <strong>2010</strong> –<br />
a) DB Services Immobilien GmbH 1)<br />
(Chairman)<br />
b) DVA <strong>Deutsche</strong> Verkehrs-Assekuranz-<br />
Vermittlungs-GmbH 1) (Chairman)<br />
a Ulrich Weber<br />
Personnel,<br />
Member of the Management Board<br />
of DB Mobility Logistics <strong>AG</strong>,<br />
Krefeld<br />
a) DB Regio <strong>AG</strong> 1)<br />
DB Schenker Rail Deutschland <strong>AG</strong> 1)<br />
Schenker <strong>AG</strong> 1)<br />
DB Gastronomie GmbH 1) (Chairman)<br />
DB JobService GmbH 1) (Chairman)<br />
DEVK <strong>Deutsche</strong> Eisenbahn Versicherung<br />
Lebensversicherungsverein a.G.<br />
Betriebliche Sozialeinrichtung der<br />
<strong>Deutsche</strong>n <strong>Bahn</strong><br />
DEVK <strong>Deutsche</strong> Eisenbahn Versicherung<br />
Sach- und HUK-Versicherungsverein a.G.<br />
Betriebliche Sozialeinrichtung<br />
der <strong>Deutsche</strong>n <strong>Bahn</strong><br />
HDI-Gerling Industrie Versicherung <strong>AG</strong><br />
HDI-Gerling Sach Serviceholding <strong>AG</strong><br />
b) DB Dienstleistungen GmbH 1)<br />
(Advisory Board)<br />
DB Zeitarbeit GmbH 1)<br />
(Advisory Board, Chairman)<br />
1)<br />
Mandate within the Group<br />
a) Membership in other supervisory boards<br />
required by law<br />
b) Membership in comparable domestic and<br />
foreign corporate control committees of<br />
business enterprises<br />
Information relating to December 31, <strong>2010</strong> or<br />
the time of leaving the services of the company<br />
in <strong>2010</strong>. If appointed after December 31, <strong>2010</strong>,<br />
the time of appointment is used.
| CONSOLIDATED FINANCIAL STATEMENTS<br />
| Notes<br />
259<br />
SUPERVISORY BOARD<br />
a Dr. Günther Saßmannshausen<br />
Honorary Chairman of the Supervisory Board,<br />
Hanover<br />
– deceased November 21, <strong>2010</strong> –<br />
a Prof. Dr. Dr. Utz-Hellmuth Felcht<br />
Chairman of the Supervisory Board,<br />
Partner One Equity Partners Europe GmbH,<br />
Munich<br />
– since March 24, <strong>2010</strong> –<br />
a) DB Mobility Logistics <strong>AG</strong> (Chairman)<br />
b) CRH plc, Dublin/Ireland<br />
Jungbunzlauer Holding <strong>AG</strong>,<br />
Basel /Switzerland (Administrative Board)<br />
Süd-Chemie Aktiengesellschaft (Chairman)<br />
a Alexander Kirchner*<br />
Deputy Chairman of the Supervisory Board,<br />
Chairman of the Eisenbahn- und Verkehrsgewerkschaft<br />
trade union,<br />
Runkel<br />
a) DB Mobility Logistics <strong>AG</strong><br />
DEVK <strong>Deutsche</strong> Eisenbahn Versicherung<br />
Lebensversicherungsverein a.G.<br />
Betriebliche Sozialeinrichtung<br />
der <strong>Deutsche</strong>n <strong>Bahn</strong> (Chairman)<br />
DEVK <strong>Deutsche</strong> Eisenbahn Versicherung<br />
Sach- und HUK-Versicherungsverein a.G.<br />
Betriebliche Sozialeinrichtung<br />
der <strong>Deutsche</strong>n <strong>Bahn</strong> (Chairman)<br />
DEVK Rückversicherungs- und Beteiligungs-<br />
Aktiengesellschaft (Chairman)<br />
a Christoph Dänzer-Vanotti<br />
Lawyer,<br />
Essen<br />
a) E.ON Energie <strong>AG</strong><br />
E.ON Energy from Waste <strong>AG</strong><br />
a Patrick Döring<br />
Member of the German Bundestag,<br />
Hanover<br />
– since March 24, <strong>2010</strong> –<br />
a) VIFG Verkehrsinfrastrukturfinanzierungsgesellschaft<br />
mbH<br />
b) DFS <strong>Deutsche</strong> Flugsicherung GmbH<br />
(Advisory Board)<br />
WEGE RE s.a, Luxembourg /Luxembourg<br />
(Administrative Board)<br />
a Dr. Werner Müller<br />
Chairman of the Supervisory Board,<br />
Mülheim an der Ruhr<br />
– up to March 24, <strong>2010</strong> –<br />
a) DB Mobility Logistics <strong>AG</strong> (Chairman)<br />
b) Stadler Rail <strong>AG</strong>, Bussnang/Switzerland<br />
(Administrative Board)<br />
a Dr. Hans Bernhard Beus<br />
State Secretary in the Federal Ministry<br />
of Finance,<br />
Berlin<br />
– since March 9, <strong>2010</strong> –<br />
a) DB Mobility Logistics <strong>AG</strong><br />
b) KfW IPEX-Bank GmbH<br />
a Georg Brunnhuber<br />
Member of the German Bundestag (retired),<br />
Oberkochen<br />
– up to March 24, <strong>2010</strong> –<br />
a Dr.-Ing. Dr. E.h. Jürgen Großmann<br />
Chairman of the Management Board of RWE <strong>AG</strong>,<br />
Hamburg<br />
a) BATIG Gesellschaft für Beteiligungen mbH<br />
British American Tobacco (Germany) GmbH<br />
British American Tobacco (Industrie) GmbH<br />
SURTECO SE (Chairman)<br />
VOLKSW<strong>AG</strong>EN <strong>AG</strong><br />
b) Hanover Acceptances Limited,<br />
London/Great Britain<br />
a Niels Lund Chrestensen<br />
General Manager of N.L. Chrestensen<br />
Samenzucht und Produktion GmbH,<br />
Erfurt<br />
– up to March 24, <strong>2010</strong> –<br />
a) Funkwerk <strong>AG</strong><br />
b) Landesbank Hessen-Thüringen<br />
(Advisory Board Public Sector Companies/<br />
Institutions, Municipalities and Savings<br />
Banks)<br />
Thüringer Aufbaubank<br />
(Administrative Board)
260<br />
| DEUTSCHE BAHN GROUP<br />
a Horst Hartkorn*<br />
Chairman of the Works Council of<br />
S-<strong>Bahn</strong> Hamburg GmbH,<br />
Hamburg<br />
– up to March 24, <strong>2010</strong> –<br />
a) S-<strong>Bahn</strong> Hamburg GmbH<br />
DEVK <strong>Deutsche</strong> Eisenbahn Versicherung<br />
Lebensversicherungsverein a.G.<br />
Betriebliche Sozialeinrichtung der<br />
<strong>Deutsche</strong>n <strong>Bahn</strong><br />
DEVK <strong>Deutsche</strong> Eisenbahn Versicherung<br />
Sach- und HUK-Versicherungsverein a.G.<br />
Betriebliche Sozialeinrichtung<br />
der <strong>Deutsche</strong>n <strong>Bahn</strong><br />
a Klaus-Dieter Hommel*<br />
Deputy Chairman of the Eisenbahn- und<br />
Verkehrsgewerkschaft trade union,<br />
Frankfurt am Main<br />
a) DEVK <strong>Deutsche</strong> Eisenbahn Versicherung<br />
Sach- und HUK-Versicherungsverein a.G.<br />
Betriebliche Sozialeinrichtung<br />
der <strong>Deutsche</strong>n <strong>Bahn</strong><br />
DEVK Pensionsfonds-<strong>AG</strong><br />
DEVK Rechtsschutz-Versicherungs-<strong>AG</strong><br />
DEVK <strong>Deutsche</strong> Eisenbahn Versicherung<br />
Lebensversicherungsverein a.G.<br />
Betriebliche Sozialeinrichtung der<br />
<strong>Deutsche</strong>n <strong>Bahn</strong><br />
a Helmut Kleindienst*<br />
Chairman of the Branch Works Council of<br />
the Services Business Unit of DB Group,<br />
Eppstein/ Taunus<br />
a) DB Dienstleistungen GmbH<br />
(Advisory Board)<br />
a Dr. Jürgen Krumnow<br />
Former member of the Management Board<br />
of <strong>Deutsche</strong> Bank <strong>AG</strong>,<br />
Königstein/ Taunus<br />
a) DB Mobility Logistics <strong>AG</strong><br />
Lenze <strong>AG</strong><br />
b) Peek&Cloppenburg KG (Advisory Board)<br />
a Dr. Bernhard Heitzer<br />
State Secretary in the Federal Ministry of<br />
Economics and Technological Affairs,<br />
Alfter<br />
a) DB Mobility Logistics <strong>AG</strong><br />
a Jörg Hensel*<br />
Chairman of the Central Works Council of<br />
DB Schenker Rail Deutschland <strong>AG</strong>,<br />
Chairman of the Branch Works Council of<br />
DB Mobility Logistics <strong>AG</strong>,<br />
Hamm<br />
a) DB Schenker Rail Deutschland <strong>AG</strong><br />
b) DEVK Pensionsfonds-<strong>AG</strong> (Advisory Board)<br />
a Wolfgang Joosten*<br />
Chairman of the Central Works Council,<br />
DB Fernverkehr <strong>AG</strong>,<br />
Lünen<br />
– since March 24, <strong>2010</strong> –<br />
a) DB Fernverkehr <strong>AG</strong><br />
b) DEVK <strong>Deutsche</strong> Eisenbahn Versicherung<br />
Lebensversicherungsverein a.G.<br />
Betriebliche Sozialeinrichtung<br />
der <strong>Deutsche</strong>n <strong>Bahn</strong> (Advisory Board)<br />
a Günter Kirchheim*<br />
Chairman of the Group Works Council of<br />
<strong>Deutsche</strong> <strong>Bahn</strong> <strong>AG</strong>,<br />
Chairman of the Central Works Council of<br />
DB Netz <strong>AG</strong>,<br />
Essen<br />
a) DEVK <strong>Deutsche</strong> Eisenbahn Versicherung<br />
Lebensversicherungsverein a.G.<br />
Betriebliche Sozialeinrichtung<br />
der <strong>Deutsche</strong>n <strong>Bahn</strong><br />
DEVK <strong>Deutsche</strong> Eisenbahn Versicherung<br />
Sach- und HUK-Versicherungsverein a.G.<br />
Betriebliche Sozialeinrichtung<br />
der <strong>Deutsche</strong>n <strong>Bahn</strong> (Chairman)<br />
DEVK Pensionsfonds-<strong>AG</strong> (Chairman)<br />
DEVK Vermögensvorsorge- und<br />
Beteiligungs-<strong>AG</strong> (Chairman)<br />
a Prof. Dr. Knut Löschke<br />
Management consultant,<br />
Leipzig<br />
– since March 24, <strong>2010</strong> –<br />
a) Stratos Aktiengesellschaft<br />
b) Druck&Werte GmbH<br />
(Advisory Board, Chairman)<br />
a Vitus Miller*<br />
Chairman of the Central Works Council<br />
Regional /Urban Transport of DB Group,<br />
Stuttgart<br />
a) DB Regio <strong>AG</strong><br />
b) DB GesundheitsService GmbH<br />
(Advisory Board)<br />
a Heike Moll*<br />
Chairwoman of the Central Works Council<br />
of DB Station& Service <strong>AG</strong>,<br />
Munich<br />
– up to March 24, <strong>2010</strong> –<br />
a) DB Station& Service <strong>AG</strong><br />
b) DEVK <strong>Deutsche</strong> Eisenbahn Versicherung<br />
Sach- und HUK-Versicherungsverein a.G.<br />
Betriebliche Sozialeinrichtung<br />
der <strong>Deutsche</strong>n <strong>Bahn</strong> (Advisory Board)
| CONSOLIDATED FINANCIAL STATEMENTS<br />
| Notes<br />
261<br />
a Dr. Walther Otremba<br />
State Secretary in the Federal Ministry<br />
of Defense,<br />
St. Augustin<br />
– up to March 8, <strong>2010</strong> –<br />
a) DB Mobility Logistics <strong>AG</strong><br />
a Ute Plambeck*<br />
Management Representative<br />
<strong>Deutsche</strong> <strong>Bahn</strong> <strong>AG</strong> for the Federal States<br />
of Hamburg/Schleswig-Holstein,<br />
Hamburg<br />
a) Autokraft GmbH<br />
S-<strong>Bahn</strong> Hamburg GmbH<br />
Sparda-Bank Hamburg eG<br />
a Mario Reiß*<br />
Chairman of the Works Council of<br />
DB Schenker Rail Deutschland <strong>AG</strong> NL Süd-Ost,<br />
Süptitz<br />
– since March 24, <strong>2010</strong> –<br />
a) DB Schenker Rail Deutschland <strong>AG</strong><br />
a Regina Rusch-Ziemba*<br />
Deputy Chairwoman of the Eisenbahn- und<br />
Verkehrsgewerkschaft trade union,<br />
Hamburg<br />
a) DB Station& Service <strong>AG</strong><br />
DB <strong>Bahn</strong>bau Gruppe GmbH<br />
DB Fahrwegdienste GmbH<br />
DB ProjektBau GmbH<br />
DEVK Allgemeine Lebensversicherungs-<strong>AG</strong><br />
(Chairman)<br />
DEVK Allgemeine Versicherungs-<strong>AG</strong><br />
DEVK Pensionsfonds-<strong>AG</strong><br />
b) DB Jobservice GmbH<br />
DGB Rechtsschutz GmbH<br />
a Prof. Klaus-Dieter Scheurle<br />
State Secretary, Federal Ministry of<br />
Transport, Building and Urban Affairs,<br />
Bonn<br />
a) DB Mobility Logistics <strong>AG</strong><br />
Fraport <strong>AG</strong><br />
b) DFS <strong>Deutsche</strong> Flugsicherung GmbH<br />
a Dr.-Ing. E.h. Dipl.-Ing.<br />
Heinrich Weiss<br />
Chairman of Management Board of SMS<br />
GmbH,<br />
Hilchenbach-Dahlbruch<br />
a) DB Mobility Logistics <strong>AG</strong><br />
SMS Siemag <strong>AG</strong> 1) (Chairman)<br />
Voith <strong>AG</strong><br />
b) Bombardier Inc., Montreal /Canada<br />
* Employees’ representative on<br />
the Supervisory Board<br />
1)<br />
Mandate within the Group<br />
a) Membership in other supervisory boards<br />
required by law<br />
b) Membership in comparable domestic and<br />
foreign corporate control committees of<br />
business enterprises<br />
Information relating to December 31, <strong>2010</strong> or<br />
the time of leaving the services of the company<br />
in <strong>2010</strong>. If appointed after December 31, <strong>2010</strong>,<br />
the time of appointment is used.<br />
SUPERVISORY BOARD COMMITTEES<br />
EXECUTIVE COMMITTEE<br />
Prof. Dr. Dr. Utz-Hellmuth Felcht<br />
(Chairman since March 24, <strong>2010</strong>)<br />
Dr. Werner Müller<br />
(Chairman up to March 24, <strong>2010</strong>)<br />
Günter Kirchheim<br />
Alexander Kirchner<br />
Sts Prof. Klaus-Dieter Scheurle<br />
AUDIT AND COMPLIANCE COMMITTEE<br />
Dr. Jürgen Krumnow (Chairman)<br />
Helmut Kleindienst<br />
Regina Rusch-Ziemba<br />
Sts Prof. Klaus-Dieter Scheurle<br />
PERSONNEL COMMITTEE<br />
Prof. Dr. Dr. Utz-Hellmuth Felcht<br />
(Chairman since March 24, <strong>2010</strong>)<br />
Dr. Werner Müller<br />
(Chairman up to March 24, <strong>2010</strong>)<br />
Günter Kirchheim<br />
Alexander Kirchner<br />
Sts Prof. Klaus-Dieter Scheurle<br />
MEMBERS OF THE MEDIATION<br />
COMMITTEE IN ACCORDANCE WITH<br />
SECTION 27 (3) MITBESTG<br />
Prof. Dr. Dr. Utz-Hellmuth Felcht<br />
(Chairman since March 24, <strong>2010</strong>)<br />
Dr. Werner Müller<br />
(Chairman up to March 24, <strong>2010</strong>)<br />
Günter Kirchheim<br />
Alexander Kirchner<br />
Sts Prof. Klaus-Dieter Scheurle<br />
Frankfurt am Main, February 22, 2011<br />
<strong>Deutsche</strong> <strong>Bahn</strong> Aktiengesellschaft<br />
The Management Board
06 ADDITIONAL<br />
INFORMATION<br />
DB ADVISORY BOARD 264<br />
GLOSSARY 265<br />
FINANCIAL GLOSSARY 265<br />
DB-SPECIFIC TERMS 266
LIST OF ABBREVIATIONS 267<br />
CONTACTS 268
264<br />
| DEUTSCHE BAHN GROUP<br />
DB Advisory Board<br />
In 2002 the Management Board established the<br />
DB Advisory Board to provide independent<br />
counsel for public debates and to position the<br />
corporation.<br />
The DB Advisory Board consists of re -<br />
nowned personalities from the worlds of<br />
business, science and public life, with whom<br />
DB Group intensively discusses central corporate<br />
positions and issues. The DB Advisory<br />
Board’s mission is to challenge and question<br />
DB Group’s positions and then to discuss their<br />
findings with the Management Board. Moreover,<br />
the Board also assists in substantiating<br />
statements and supporting dialogue between<br />
DB Group and the general public.<br />
The DB Advisory Board meets at least twice<br />
yearly to review current issues related to the<br />
corporate development of DB Group. Furthermore,<br />
the DB Advisory Board has also established<br />
committees for the purpose of deeply<br />
reviewing core issues with the appropriate<br />
specialist departments within DB Group.<br />
a Prof. Dr. Dr. h. c. Gerd Aberle<br />
Justus-Liebig University, Gießen<br />
a Manfred Bissinger<br />
Hoffmann und Campe Verlag GmbH<br />
a Prof. Dr. Thomas Ehrmann<br />
Westfälische Wilhelms University, Münster<br />
a Dr. Volker Hauff<br />
Chairman of the Council for Sustainable<br />
Development, Federal Minister (Ret.)<br />
a Hans Jochen Henke<br />
Lawyer, State Secretary (Ret.)<br />
a Prof. Dr. Dres. h. c. Peter Hommelhoff<br />
Ruprecht-Karls University, Heidelberg<br />
a Dr. Walther Leisler Kiep<br />
Minister (Ret.)<br />
a Prof. Dr. Dr. Christian Kirchner<br />
Humboldt University, Berlin<br />
a Dr. Dieter Klumpp<br />
Managing Director Alstom GmbH,<br />
Member of the Board of the German<br />
Railway Industry Association<br />
a Klaudia Martini<br />
Nörr Stiefenhofer Lutz, Law Firm,<br />
Minister of State (Ret.)<br />
a Prof. Dr. Dr. mult. Heribert Meffert<br />
Westfälische Wilhelms University, Münster<br />
a Prof. Dr. Anton Meyer<br />
Ludwigs-Maximilians University, Munich<br />
a Prof. Dr. Rolf Riccius<br />
University of Technology, Berlin.<br />
Aerospace Consultant, Munich<br />
a Prof. Dr. Werner Rothengatter<br />
University of Karlsruhe<br />
a Prof. Dr. Joachim Schwalbach<br />
Humboldt University, Berlin<br />
a Prof. Dr. Frank Straube<br />
University of Technology, Berlin<br />
a Prof. Dr. Thomas Straubhaar<br />
Hamburg World Economic Institute<br />
a Dr. Günter Struve<br />
First German Television Network<br />
a Horst Stuchly<br />
President Federal Railways Agency (Ret.)<br />
a Dr. Jürgen Weber<br />
Chairman of the Supervisory Board of<br />
<strong>Deutsche</strong> Lufthansa <strong>AG</strong><br />
a Ulrich Weiß<br />
Member of the Board of the German<br />
Association of Mid-Sized (Mittelstand)<br />
Construction Companies<br />
a Prof. Dr. Dr. Utz-Hellmuth Felcht<br />
Chairman of the Supervisory Board<br />
of <strong>Deutsche</strong> <strong>Bahn</strong> <strong>AG</strong> and DB Mobility<br />
Logistics <strong>AG</strong><br />
a Dr. Hugo Müller-Vogg<br />
Publicist<br />
a Prof. Dr. Dr. Franz Josef Rader macher<br />
University of Ulm<br />
a Prof. Dr.-Ing. Ekkehard Wendler<br />
Institute of Technology of North Rhine-<br />
Westphalia, Aachen<br />
a Dr. Wendelin Wiedeking<br />
Entrepreneur
| ADDITIONAL INFORMATION<br />
| DB Advisory Board<br />
| Glossary<br />
265<br />
Glossary<br />
FINANCIAL GLOSSARY<br />
a Capital employed<br />
Comprises properties (including intangible<br />
assets) plus net working capital.<br />
a Commercial paper program<br />
Contractual framework or sample documentation<br />
for the issuance of short-term securities.<br />
a Credit facilities<br />
Credit lines arranged with banks that can be<br />
drawn upon as necessary.<br />
a Debt issuance program<br />
Contractual framework or sample documentation<br />
for the issuance of bonds. Ensures high<br />
flexibility in issuing activity.<br />
a Derivative financial instruments<br />
(derivatives)<br />
Finance contracts, the value of which depends<br />
on the performance of the underlying assets<br />
(reference amounts include, for example,<br />
interest rates or commodity prices). Important<br />
examples include options, futures, forwards<br />
and swaps.<br />
a EBIT (earnings before<br />
interest and taxes)<br />
Operating income before interest and taxes.<br />
a EBITDA (earnings before interest,<br />
taxes, depreciation and amortization)<br />
Operating income before interest, taxes, depreciation<br />
and amortization.<br />
a Equity method/at-equity accounting<br />
Procedure used to account for subsidiaries<br />
where assets and liabilities are not fully consolidated<br />
in the consolidated financial statements.<br />
The carrying amount of the investment<br />
is adjusted to reflect the development of the<br />
pro rata share of equity.<br />
a Equity ratio<br />
Key financial performance indicator based on<br />
the balance sheet structure: expresses equity<br />
as a percentage of total assets.<br />
a Fair value<br />
Price calculated in efficient markets taking into<br />
account all factors influencing prices, and negotiated<br />
between knowledgeable, willing parties<br />
in an arm’s length transaction.<br />
a Gearing<br />
Key financial performance indicator that ex -<br />
presses the ratio of net financial debt to equity<br />
as a percentage.<br />
a Gross capital expenditures<br />
Total capital expenditure for property, plant<br />
and equipment and intangible assets – irrespective<br />
of the type of financing.<br />
a Hedging<br />
Hedging transactions conducted within the<br />
scope of risk management, particularly to<br />
minimize interest and currency risks.<br />
a IFRS (International Financial<br />
<strong>Report</strong>ing Standards)<br />
Internationally recognized accounting standards.<br />
Since 2002, the term IFRS has applied to<br />
the entire accounting concept issued by the<br />
International Accounting Standards Board.<br />
Standards issued prior to this continue to be<br />
referred to as International Accounting Standards<br />
(IAS).<br />
a Investment grants<br />
Third-party financial investments in specified<br />
investment projects without future repayment<br />
requirements.<br />
a Net capital expenditures<br />
Gross capital expenditures less third-party<br />
investment grants, for example for infrastructure<br />
capital expenditures.<br />
a Operate leases<br />
Off-balance-sheet financial instruments: leased<br />
or rented assets.<br />
a Plan assets<br />
Assets netted with gross pension obligations.<br />
a Rating<br />
An assessment of creditworthiness issued by<br />
rating agents for a company; affects a company’s<br />
refinancing options and costs.<br />
a Redemption coverage<br />
Key financial performance indicator that de -<br />
scribes the ratio between the ongoing financing<br />
power and the financial obligations of the company<br />
(adjusted net financial debt).<br />
a ROCE (return on capital employed)<br />
Key ratio used in value-based management.<br />
Expresses ratio of adjusted EBIT to capital<br />
employed as a percentage.<br />
a Scope of consolidation<br />
Group of subsidiaries that are included in a<br />
group’s consolidated financial statements.<br />
a Swap<br />
A financial transaction in which two counterparties<br />
exchange financing conditions and in<br />
which each party benefits from the other’s cost<br />
advantages.<br />
a Interest-free loans<br />
Repayable, yet interest-free loans extended by<br />
the German Federal Government. Result from<br />
the financial participation of the Federal<br />
Republic of Germany in capital expenditure for<br />
the extension and replacement of track infrastructure.
266<br />
| DEUTSCHE BAHN GROUP<br />
DB-SPECIFIC TERMS<br />
a Combined rail/road transport<br />
The integrated transport of containers or entire<br />
trucks on the roads and rails.<br />
a Existing network<br />
The existing rail network – and thus the backbone<br />
of the rail infrastructure.<br />
a Freight carriers<br />
Companies that are used for the transport of<br />
goods.<br />
a Hub<br />
Principal handling base. Collection point for the<br />
handling and the centralization of good flows<br />
in different directions.<br />
a Intermodal competition<br />
Competition with other modes of transport, e.g.<br />
between rail and air transport.<br />
a Interoperability (multisystem<br />
capability)<br />
The ability of track vehicles to adapt to different<br />
technical standards (e.g. track widths or power<br />
systems) and to operate on different rail networks<br />
with as little delay as possible.<br />
a Intramodal competition<br />
Competition within a mode of transport, e.g.<br />
within the railway sector.<br />
a Length of line operated<br />
The length of the rail network – irrespective of<br />
the number of parallel tracks. Unit of measure:<br />
kilometers (km).<br />
a Ordering organizations<br />
Generally the German Federal states, which are<br />
responsible for providing local rail passenger<br />
transport and order the respective services from<br />
transport companies.<br />
a Passenger kilometers (pkm)<br />
Unit of measure for volume sold in passenger<br />
transport: product of number of passengers<br />
and mean travel distance.<br />
a Regionalization Act<br />
Regulates the payments of the German Federal<br />
Government to the German Federal states and<br />
thus facilitates ordering of local transport services<br />
on the roads and rails.<br />
a Requirement plan<br />
New line construction and expansion contained<br />
in the Federal Transport Infrastructure Plan<br />
(Bundes verkehrswegeplan).<br />
a Station pricing system<br />
Transparent and nondiscriminatory pricing<br />
system for the utilization of passenger stations.<br />
The specific station prices depend primarily<br />
on the performance and furnishings of the<br />
respective stations.<br />
a TEU (Twenty-Foot Container<br />
Equivalent Unit)<br />
Standardized twenty-foot-long container unit<br />
(1 foot = 30 cm).<br />
a Ton kilometers (tkm)<br />
Unit of measure for volume sold in freight<br />
transport: product of freight carried (in tons)<br />
and mean transport distance (km).<br />
a Train-path<br />
Route traveled by a train, defined in the timetable.<br />
a Train-path kilometers (train-path km)<br />
See volume produced.<br />
a Train-path pricing system (TPS)<br />
Regulates in a transparent and non-discriminatory<br />
manner the prices for the utilization of the<br />
rail network by internal and external customers.<br />
Takes into account the individual characteristics<br />
of the infrastructure utilized.<br />
a Transport contract<br />
A contract between an ordering organization<br />
and a railway regarding the rendering of regional<br />
passenger transport services.<br />
a Volume produced<br />
Distance traveled by train operating companies<br />
on the rail network. Unit of measure: train-path<br />
kilometers (train-path km).<br />
a Volume sold<br />
Central key performance indicator used to measure<br />
performance rendered in passenger and<br />
freight transport. Unit of measure: passenger<br />
kilometers (pkm) and/or ton kilometers (tkm).
| ADDITIONAL INFORMATION | Glossary<br />
267<br />
|<br />
List of abbreviations<br />
List of abbreviations<br />
a A<br />
AEG – General Railways Act<br />
AgvMoVe – Mobility and Transport Services<br />
Association<br />
AktG – German Stock Corporation Act<br />
a B<br />
bbl – Barrel<br />
BBodSchG – Federal Soil Protection Act<br />
BEV – Federal Railroad Fund<br />
BGH – Federal Court of Justice<br />
BilMoG – Accounting Law Modernization Act<br />
BMF – Federal Ministry of Finance<br />
BMVBS – Federal Ministry of Transport,<br />
Building and Urban Affairs<br />
BMWi – Federal Ministry of Economics and<br />
Technology<br />
BNetzA – Federal Network Agency<br />
BR – Series<br />
BSchw<strong>AG</strong> – Federal Track Expansion Act<br />
Buskm – Bus kilometers<br />
BVerfG – Federal Constitutional Court<br />
BVWP – Federal Transport Network Plan<br />
a C<br />
CAD – Canadian dollar<br />
CGU – Cash generating unit<br />
COSO – Committee of Sponsoring<br />
Organizations of the Treadway Commission<br />
CO2 – Carbon dioxide<br />
a D<br />
DB – <strong>Deutsche</strong> <strong>Bahn</strong><br />
DBGrG – <strong>Deutsche</strong> <strong>Bahn</strong> Foundation Act<br />
DepV – Land Fill Site Ordinance<br />
D&O – Directors & Officers<br />
DRS – German Accounting Standards<br />
a E<br />
EBA – Federal Railway Authority<br />
ECB – European Central Bank<br />
EKrG – Railway Crossings Act<br />
ENeuOG – German Rail Restructuring Act<br />
EPS – Earnings per share<br />
ETCS – European Train Control System<br />
EVG – Railway and Transport Workers Union<br />
a F<br />
FIS – Corporate information system<br />
FTE – Full-time employee<br />
a G<br />
GBP – British pound (sterling)<br />
GDL – German Engine Driver’s union<br />
GDP – Gross domestic product<br />
GVFG – Municipal Transport Financing Act<br />
a H<br />
HFM – Hyperion Financial Management<br />
HGB – German Commercial Code<br />
a I<br />
IAS – International Accounting Standards<br />
IASB – International Accounting<br />
Standards Board<br />
IFRIC – International Financial<br />
Interpretations Committee<br />
IFRS – International Financial<br />
<strong>Report</strong>ing Standards<br />
IT – Information technology<br />
a J<br />
JPY – Japanese yen<br />
a K<br />
KV – Combined transport<br />
a L<br />
LuFV – Service and Financing Agreement<br />
a M<br />
M&A – Mergers & Acquisitions<br />
MaRisk – Appropriate Risk Control and<br />
Management Systems<br />
MitbestG – German Codetermination Act<br />
MIV – Motorized individual transport<br />
MJ – Megajoule<br />
a N<br />
Nkm – Commercial vehicle kilometers<br />
a O<br />
OLG – Higher Regional Court<br />
ÖPNV – Local public transport<br />
ÖSPV – Public road transport<br />
a P<br />
P – Passenger<br />
PCGK – Public Corporate Governance Kodex<br />
Pkm – Passenger kilometer<br />
PLN – Polish zloty<br />
Ptkm – Total sum of volume sold (pkm + tkm)<br />
a R<br />
ROCE – Return on capital employed<br />
a S<br />
SCM – Supply chain management<br />
SIC – Interpretation of the Standing<br />
Interpretations Committee<br />
SPE – Special purpose entity<br />
S&P – Standard & Poorʼs<br />
a T<br />
t – Ton<br />
TEN – Trans-European networks<br />
TEU – Twenty-foot container equivalent unit<br />
TOC – Train Operating Company<br />
tkm – Ton kilometer<br />
Trkm – Train-path kilometers<br />
a U<br />
UIC – International Union of Railways<br />
USD – United States dollar<br />
a V<br />
VDE – German unification transport project<br />
VIFG – Transport infrastructure financing<br />
company<br />
VIFGG – Transport Infrastructure Financing<br />
Act<br />
a W<br />
WACC – Weighted average cost of capital<br />
WHG – Water Management Act
268<br />
| DEUTSCHE BAHN GROUP<br />
Contacts<br />
INVESTOR RELATIONS<br />
CORPORATE COMMUNICATIONS<br />
IMPRINT<br />
<strong>Deutsche</strong> <strong>Bahn</strong> <strong>AG</strong><br />
Investor Relations<br />
Europaplatz 1<br />
10557 Berlin<br />
Germany<br />
Phone: + 49-30-2 97-6 4031<br />
Fax: +49-69-2 65-20110<br />
E-mail: ir@deutschebahn.com<br />
Internet: www.deutschebahn.com/ir-e<br />
Corporate publications, the <strong>Report</strong> of the<br />
Competition Officer and the Sustainability<br />
<strong>Report</strong> can be requested from Corporate<br />
Communications:<br />
<strong>Deutsche</strong> <strong>Bahn</strong> <strong>AG</strong><br />
Corporate Communications<br />
Potsdamer Platz 2<br />
10785 Berlin<br />
Germany<br />
Phone: + 49-30-2 97-6 14 80<br />
Fax: + 49-30-2 97-6 14 85<br />
E-mail: presse@deutschebahn.com<br />
Internet: www.deutschebahn.com/presse<br />
CONCEPT, EDITING<br />
<strong>Deutsche</strong> <strong>Bahn</strong> <strong>AG</strong>,<br />
Investor Relations<br />
DESIGN CONCEPT, TYPESETTING<br />
Studio Delhi, Mainz<br />
PROOFREADING<br />
AdverTEXT, Düsseldorf<br />
LITHOGRAPHY<br />
Koch Lichtsatz und Scan, Wiesbaden<br />
PRINTING<br />
ColorDruck Leimen, Leimen<br />
This <strong>Annual</strong> <strong>Report</strong>, the <strong>Annual</strong> <strong>Report</strong><br />
of DB Mobility Logistics Group and the<br />
Financial Statements of <strong>Deutsche</strong> <strong>Bahn</strong><br />
<strong>AG</strong> and additional information are available<br />
on the Internet.<br />
This <strong>Annual</strong> <strong>Report</strong>, the <strong>Annual</strong><br />
<strong>Report</strong> of DB Mobility Logistics Group and<br />
the Financial Statements of <strong>Deutsche</strong><br />
<strong>Bahn</strong> <strong>AG</strong> are published in German and<br />
English. In case of any discrepancy, the<br />
German version shall prevail.<br />
The <strong>2010</strong> <strong>Annual</strong> <strong>Report</strong> was published<br />
March 31, 2011 and is available on<br />
the Internet at www.deutschebahn.com/<br />
ar-online.<br />
DB SERVICE NUMBER<br />
Our service number + 49-18 05-99 66 33<br />
gives you direct access to all of our telephone<br />
services. The access includes information<br />
regarding general information,<br />
booking of train tickets, finding train<br />
times, our customer dialogue and our frequent<br />
traveler system (<strong>Bahn</strong>Card). Calls<br />
will be charged as follows: calls from the<br />
German fixed-line network cost 14 ct /min.<br />
Charges from the German cell phone network<br />
cost 42 ct /min at most.<br />
Printed on<br />
Circlesilk Premium White<br />
(100 % recycled paper)<br />
PHOTOGRAPHY CONSULTING<br />
Max Lautenschläger, Berlin<br />
TRANSLATION<br />
Gabriele Leighton, Hilden<br />
Paul E. Reichmann Communications<br />
Consulting, Frankfurt am Main<br />
PHOTOGRAPHY<br />
Allianz pro Schiene (p. 46), Bartlomiej Banaszak<br />
(p. 47), Pablo Castagnola (pp. 16/17, 43), Marc<br />
Darchinger (p. 23), DB <strong>AG</strong> (p. 47), DB Arriva (p. 5),<br />
Daniel Duwe (p. 46), Rainer Garbe (pp. 42, 43,<br />
45), Kai-Uwe Gundlach (p. 8), Jürgen Henkelmann<br />
(pp. 12 / 13), Ralf Kranert (pp. 16, 17, 42, 43, 44),<br />
Hans-Joachim Krumm (p. 44), Thomas Langer<br />
(pp. 43, 46), Heiner Müller-Elsner (pp. U3, 8, 9,<br />
14 / 15), Rüdiger Nehmzow (p. 6), Michael Neuhaus<br />
(pp. U4, 1, 45), Jean-Luc Poussin/SNCF<br />
(p. 47), Max Warebring (p. U3), SBB Cargo (p. 44),<br />
Stefan Warter/Heiner Müller-Elsner (p. 9)
10-year summary<br />
10-YEAR SUMMARY<br />
[ € million ] <strong>2010</strong> 2009 2008 2007 2006 2005 2004 2003<br />
1)<br />
2002<br />
1)<br />
2001<br />
1)<br />
STATEMENT OF INCOME<br />
Revenues 34,410 29,335 33,452 31,309 30,053 25,055 23,962 28,228 18,685 15,722<br />
Overall performance 36,617 31,271 35,324 33,254 31,943 26,728 25,890 30,438 20,900 17,535<br />
Other operating income 3,120 3,864 3,046 3,219 2,859 2,366 2,860 3,138 2,830 2,406<br />
Cost of materials –19,314 –15,627 –18,544 –17,166 –16,449 –12,650 –12,054 –15,776 –9,546 –7,108<br />
Personnel expenses –11,602 –11,115 –10,583 –9,913 –9,782 –9,211 –9,556 –10,337 –8,387 –7,487<br />
Depreciation –2,912 –2,825 –2,723 –2,795 –2,950 –2,801 –2,722 –2,694 –2,434 –2,162<br />
Other operating expenses –4,092 –3,360 –3,927 –3,704 –3,144 –3,080 –3,274 –4,316 –3,358 –3,282<br />
Operating profit (EBIT) 1,817 2,208 2,593 2,895 2,477 1,352 1,144 – – –<br />
Result from investments accounted<br />
for using the equity method 17 9 21 32 18 76 49 – – –<br />
Other financial result –23 –4 –47 –3 1 7 –55 – – –<br />
Net interest income –911 –826 –760 –908 –941 –945 –984 –637 –489 –313<br />
Profit before taxes on income 900 1,387 1,807 2,016 1,555 490 154 –133 –438 –409<br />
Net profit for the year 1,058 830 1,321 1,716 1,680 611 180 –245 –468 –406<br />
OPERATING INCOME<br />
EBITDA adjusted 4,651 4,402 5,206 5,113 – – – – – –<br />
EBIT adjusted 1,866 1,685 2,483 2,370 2,143 1,350 1,011 465 37 109<br />
VALUE MAN<strong>AG</strong>EMENT<br />
Capital employed as of Dec 31 31,312 28,596 27,961 27,393 28,693 27,013 26,490 30,964 30,428 28,649<br />
Return on capital employed (ROCE) 6.0 % 5.9 % 8.9 % 8.7 % 7.5 % 5.0 % 3.8 % 1.5 % 0.1 % 0.4 %<br />
Redemption coverage 18.1 % 19.4 % 22.5 % 21.1 % 18.6 % 14.7 % 12.7 % – – –<br />
Gearing 118 % 115% 131% 151% 213% 256% 276% – – –<br />
CASH FLOW/CAPITAL EXPENDITURES<br />
Cash flow from operating activities 3,409 3,133 3,539 3,364 3,678 2,652 2,736 – – –<br />
Gross capital expenditures 6,891 6,462 6,765 6,320 6,584 6,381 7,238 9,121 9,994 7,110<br />
Net capital expenditures 2,072 1,813 2,599 2,060 2,836 2,362 3,251 4,013 5,355 3,307
[ € million ] <strong>2010</strong> 2009 2008 2007 2006 2005 2004 2003<br />
1)<br />
2002<br />
1)<br />
2001<br />
1)<br />
BALANCE SHEET AS OF DEC 31<br />
Non-current assets 44,530 41,308 42,353 42,046 43,360 42,907 43,200 – – –<br />
thereof property, plant and equipment<br />
and intangible assets 42,027 39,509 39,976 39,855 41,081 40,430 40,861 40,093 38,869 35,055<br />
thereof deferred tax assets 1,471 1,173 1,692 1,644 1,800 1,556 1,301 – – –<br />
Current assets 7,473 5,995 5,840 6,483 5,080 4,194 4,416 – – –<br />
thereof cash and cash equivalents 1,475 1,470 879 1,549 295 305 765 265 271 363<br />
Equity 14,316 13,066 12,155 10,953 9,214 7,675 7,067 5,076 5,708 8,436<br />
Equity ratio 27.5 % 27.6 % 25.2 % 22.6 % 19.0 % 16.3 % 14.8 % 10.7 % 12.4 % 20.1 %<br />
Non-current liabilities 24,762 23,359 23,161 25,612 26,319 27,963 29,440 30,464 27,779 24,421<br />
thereof financial debt 16,394 14,730 14,083 16,228 17,165 18,310 19,045 – – –<br />
thereof retirement benefit obligations 1,938 1,736 1,649 1,594 1,514 1,414 1,341 – – –<br />
Current liabilities 12,925 10,878 12,877 11,964 12,907 11,463 11,109 12,107 12,524 9,090<br />
thereof financial debt 2,159 1,780 2,770 1,834 2,716 1,664 1,231 – – –<br />
Net financial debt 16,939 15,011 15,943 16,513 19,586 19,669 19,511 – – –<br />
Total assets 52,003 47,303 48,193 48,529 48,440 47,101 47,616 47,647 46,023 41,962<br />
RAIL PERFORMANCE FIGURES<br />
PASSENGER TRANSPORT 2)<br />
Passengers (million) 1,950 1,908 1,920 1,835 1,854 1,785 1,695 1,681 1,657 1,702<br />
Long-distance transport 126 123 123 119 120 119 115 117 128 136<br />
Regional and urban transport 1,824 1,785 1,797 1,717 1,735 1,667 1,580 1,564 1,529 1,566<br />
Volume sold (million pkm) 78,582 76,772 77,812 74,792 74,788 72,554 70,260 69,534 69,848 74,459<br />
Long-distance transport 36,026 34,708 35,457 34,137 34,458 33,641 32,330 31,619 33,173 35,342<br />
Regional and urban transport 42,556 42,064 42,355 40,654 40,331 38,913 37,930 37,915 36,675 39,117<br />
FREIGHT TRANSPORT<br />
Freight carried (million t) 415.4 341.0 378.7 312.8 307.6 274.6 295.3 282.3 289.4 291.3<br />
Volume sold (million tkm) 105,794 93,948 113,634 98,794 96,388 88,022 89,494 85,151 82,756 84,716<br />
Total transport performance (million ptkm) 184,376 170,720 191,446 173,586 171,177 160,576 159,754 154,685 152,604 159,175<br />
INFRASTRUCTURE<br />
Train kilometers on track infrastructure<br />
(million train-path km)<br />
1,034 1,003 1,043 1,050 1,016 998 1,001 988 967 977<br />
thereof non-Group customers 195 170 162 147 128 110 88 70 50 39<br />
EMPLOYEES 3)<br />
Average 251,810 239,888 240,008 231,356 228,990 220,343 229,830 249,251 224,758 219,146<br />
At year end 276,310 239,382 240,242 237,078 229,200 216,389 225,632 242,759 250,690 214,371<br />
1)<br />
Figures according to German GAAP.<br />
2)<br />
<strong>2010</strong> excluding DB Arriva.<br />
3)<br />
Full-time employees, part-time employees are converted in accordance with their share of regular annual working time.
Financial calendar<br />
JULY 28, 2011<br />
Interim Results Press Conference,<br />
Publication of the Interim <strong>Report</strong> January – June 2011<br />
MARCH 29, 2012<br />
<strong>Annual</strong> Results Press Conference,<br />
Publication of 2011 <strong>Annual</strong> <strong>Report</strong>
<strong>Deutsche</strong> <strong>Bahn</strong> <strong>AG</strong><br />
Potsdamer Platz 2<br />
10785 Berlin<br />
Germany<br />
www.deutschebahn.com