Dissociative electron attachment to the unstable carbon ...
Dissociative electron attachment to the unstable carbon ...
Dissociative electron attachment to the unstable carbon ...

You also want an ePaper? Increase the reach of your titles
YUMPU automatically turns print PDFs into web optimized ePapers that Google loves.
<strong>Dissociative</strong> <strong>electron</strong> <strong>attachment</strong> <strong>to</strong> CS 5<br />
Counts<br />
700<br />
600<br />
500<br />
400<br />
300<br />
200<br />
100<br />
0<br />
S -<br />
0 1 2 3 4 5 6 7 8 9<br />
Electron Energy (eV)<br />
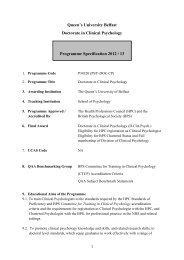
Figure 3. S − ion signal from dissociative <strong>electron</strong> <strong>attachment</strong> <strong>to</strong> CS 2 as a function of<br />
<strong>electron</strong> energy<br />
Counts<br />
1800<br />
1600<br />
1400<br />
1200<br />
1000<br />
800<br />
600<br />
400<br />
200<br />
0<br />
(a)<br />
S -<br />
CS -<br />
S 2<br />
-<br />
5 6 7 8 9 10<br />
Counts<br />
1000<br />
100<br />
10<br />
1<br />
(b)<br />
S -<br />
CS -<br />
S 2<br />
-<br />
5 6 7 8 9 10<br />
Electron Energy (eV)<br />
Electron Energy (eV)<br />
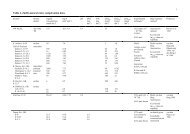
Figure 4. <strong>Dissociative</strong> <strong>electron</strong> <strong>attachment</strong> <strong>to</strong> CS 2 between 5 and 10 eV. The same<br />
data are presented with linear (left) and logarithmic (right) vertical axes.<br />
time-of-flight and <strong>the</strong> <strong>electron</strong> energy. In plot (b) C − and CS − 2 can be seen very weakly.<br />
The CS − 2 is most likely produced in <strong>the</strong> interaction region by secondary charge transfer<br />
reactions as reported in [22]. Figures 3 and 4 show integrated signals of <strong>the</strong> anions<br />
formed. The double peak at 3.6 eV could not be resolved clearly due <strong>to</strong> <strong>the</strong> current<br />
experimental <strong>electron</strong> energy resolution. There is perhaps some hint of <strong>the</strong> double peak<br />
structure in <strong>the</strong> data in Figure 3 near 3.6 eV. The centroids of <strong>the</strong> of <strong>the</strong> three S − peaks<br />
from CS 2 at 3.5, 6.2 and 7.7 eV were used in <strong>the</strong> energy calibration of <strong>the</strong> data. The<br />
differences between positions of <strong>the</strong> geometric centroids and <strong>the</strong> peak maxima were less<br />
that 0.15 eV.<br />
3.2. Composition of <strong>the</strong> gas formed in <strong>the</strong> microwave plasma and positive mass spectra<br />
The composition of <strong>the</strong> gas sample formed in <strong>the</strong> microwave discharge depended strongly<br />
on <strong>the</strong> inlet pressures of CS 2 and He as shown in Figure 5. Figures 5 shows positive ion