Dissociative electron attachment to the unstable carbon ...
Dissociative electron attachment to the unstable carbon ...
Dissociative electron attachment to the unstable carbon ...

Create successful ePaper yourself
Turn your PDF publications into a flip-book with our unique Google optimized e-Paper software.
<strong>Dissociative</strong> <strong>electron</strong> <strong>attachment</strong> <strong>to</strong> <strong>the</strong> <strong>unstable</strong><br />
<strong>carbon</strong> monosulphide molecule CS<br />
K Graupner, T A Field and L Feketeova<br />
Department of Physics and Astronomy, Queen’s University Belfast, Belfast BT7<br />
1NN, UK<br />
E-mail: t.field@qub.ac.uk<br />
Abstract. <strong>Dissociative</strong> <strong>electron</strong> <strong>attachment</strong> <strong>to</strong> <strong>the</strong> <strong>unstable</strong> CS molecule, cabonmonosulphide,<br />
produced in a microwave discharge of <strong>carbon</strong> disulphide and helium<br />
has been observed in <strong>the</strong> <strong>electron</strong> energy range 0-10 eV. The S − ion is formed in two<br />
<strong>electron</strong> <strong>attachment</strong> bands with maxima at 5.43 ± 0.15 eV and ∼ 6.70 ± 0.15 eV and<br />
C − is formed in a band with a maximum of ∼ 6.40 ± 0.15 eV. Absolute cross sections<br />
for <strong>the</strong>se processes are estimated <strong>to</strong> be 0.025, 0.003 and 0.002 Å 2 respectively. These<br />
interactions of CS with low energy <strong>electron</strong>s will play a role in technological plasmas<br />
containing <strong>carbon</strong> and sulphur and extraterrestrial environments where <strong>electron</strong>s are<br />
present with 5 <strong>to</strong> 7 eV energy. New results are also presented for <strong>the</strong> molecules S 2 O,<br />
C 3 S 2 and S 2 F, which were also formed in <strong>the</strong> microwave discharge. For S 2 O <strong>the</strong> previously<br />
reported S − band at 1.8 ± 0.3 eV is confirmed and a new O − <strong>attachment</strong> band<br />
at ∼ 5.4 eV is tentatively assigned <strong>to</strong> S 2 O. Ionization thresholds of C 3 S 2 (9.4 ± 0.3<br />
eV) and S 2 F (10.3 ± 0.4 eV) have been measured, apparently for <strong>the</strong> first time.<br />
PACS numbers: 34.80.Ht, 95.30.Et, 52.25.Fs<br />
1. Introduction<br />
Unstable molecules and radicals are of major importance for <strong>the</strong> processes in <strong>the</strong> plasma<br />
gas phase as well as for its etching or deposition characteristics [1]. Carbon monosulphide<br />
is formed in plasmas of sulphur and <strong>carbon</strong> containing source gases. CS has been<br />
observed, for example, in a CH 3 SCN discharge; it was reported that e − impact <strong>to</strong> CS in<br />
<strong>the</strong> CH 3 SCN discharge could lead <strong>to</strong> <strong>the</strong> formation of C and S a<strong>to</strong>ms in <strong>the</strong> plasma [2].<br />
Plasmas with sulphur containing precursors can deposit n-type semiconducting<br />
CVD diamond films by incorporating S in<strong>to</strong> <strong>the</strong> film structure [3]. CS and CS 2 produced<br />
in gas phase reactions have been observed in such a discharge and it was speculated that<br />
CS could be <strong>the</strong> species responsible for <strong>the</strong> incorporation of sulphur in<strong>to</strong> <strong>the</strong> lattice [3].<br />
Fluorescence spectroscopy of CS has been used <strong>to</strong> measure electric field strengths in a<br />
discharge [4].<br />
CS may also play a role in atmospheric reactions, for example in <strong>the</strong> production<br />
of atmospheric <strong>carbon</strong>yl sulphide (OCS) [5], a possible source for <strong>the</strong> stra<strong>to</strong>spheric<br />
sulphate aerosol layer which influences earths climate and <strong>the</strong> ozone layer [6, 7, 8].
<strong>Dissociative</strong> <strong>electron</strong> <strong>attachment</strong> <strong>to</strong> CS 2<br />
The CS molecule is also of astrophysical importance as it is abundant in space; it has<br />
been found in molecular clouds [9], circumstellar envelops [10], planetary nebulae [11],<br />
comets [12] and o<strong>the</strong>r galaxies [13]. Its production was observed in <strong>the</strong> collision of<br />
comet Shoemaker-Levy 9 with Jupiter [14]. The CS molecule is <strong>unstable</strong> and frequently<br />
described as a radical although it does not have any unpaired <strong>electron</strong>s in its ground<br />
<strong>electron</strong>ic state.<br />
In <strong>the</strong> present work dissociative <strong>electron</strong> <strong>attachment</strong> <strong>to</strong> CS is reported. <strong>Dissociative</strong><br />
<strong>electron</strong> <strong>attachment</strong> <strong>to</strong> a dia<strong>to</strong>mic or polya<strong>to</strong>mic molecule AB can be represented by<br />
AB + e − → (AB − ) ∗ → A + B − (1)<br />
where a free <strong>electron</strong> e − attaches <strong>to</strong> form (AB − ) ∗ , a temporary negative ion, which<br />
can dissociate in<strong>to</strong> <strong>the</strong> neutral fragment A and negatively charged fragment B − . A<br />
competing process is au<strong>to</strong>detachment, where <strong>the</strong> molecule looses <strong>the</strong> <strong>electron</strong> again and<br />
stays intact.<br />
Electron impact ionization cross sections for formation of <strong>the</strong> parent ion has been<br />
measured experimentally for CS [15]. These experimental cross sections agree well at<br />
20 eV and below with <strong>electron</strong> absorption cross sections calculated recently using <strong>the</strong><br />
Schwinger variational method [16]. The experimental values are reasonably close <strong>to</strong><br />
earlier <strong>electron</strong> impact ionization cross sections calculated with <strong>the</strong> BEB model [17, 18].<br />
To <strong>the</strong> authors’ knowledge <strong>the</strong>re exists no previously reported experimental investigation<br />
of dissociative <strong>electron</strong> <strong>attachment</strong> <strong>to</strong> <strong>carbon</strong>monosulphide.<br />
2. Method<br />
The <strong>electron</strong> <strong>attachment</strong> spectrometer, <strong>the</strong> <strong>electron</strong> radical interaction chamber (ERIC),<br />
used here has been described previously [19] and is shown in Figure 1. The gas sample,<br />
a mixture of CS 2 and He, enters <strong>the</strong> interaction region from above through a glass inlet<br />
system.<br />
The interaction region is differentially pumped from below <strong>to</strong> minimize <strong>the</strong> pressure<br />
in <strong>the</strong> mass spectrometer and <strong>electron</strong> gun, which are pumped by a second pump. An<br />
Evenson microwave cavity in <strong>the</strong> inlet system connected <strong>to</strong> a 2.45 GHz microwave power<br />
supply is used <strong>to</strong> produce <strong>unstable</strong> molecules and radicals. Typically microwave powers<br />
of 40 <strong>to</strong> 80 Watts are used. The interaction region and <strong>the</strong> region where <strong>the</strong> <strong>unstable</strong><br />
species are produced are separated by about 25 cm of glass tube.<br />
Electrons emitted from <strong>the</strong> filament pass through a trochoidal <strong>electron</strong><br />
monochroma<strong>to</strong>r [20] and are guided by a magnetic field of about 80 Gauss. The<br />
deflection plate in <strong>the</strong> Faraday cup moves <strong>the</strong> <strong>electron</strong>s off-axis so that <strong>the</strong> <strong>electron</strong>s<br />
can not reenter <strong>the</strong> interaction region.<br />
Fragment anions formed in dissociative <strong>electron</strong> <strong>attachment</strong> in <strong>the</strong> interaction region<br />
are observed with a time-of-flight (TOF) mass spectrometer. A repeller plate pushes ions<br />
in<strong>to</strong> <strong>the</strong> acceleration region where <strong>the</strong>y are fur<strong>the</strong>r accelerated. They <strong>the</strong>n pass through<br />
a drift region and are detected with <strong>the</strong> multichannel plate detec<strong>to</strong>r labelled MCP in
<strong>Dissociative</strong> <strong>electron</strong> <strong>attachment</strong> <strong>to</strong> CS 3<br />
Figure 1. Schematic diagram of <strong>the</strong> <strong>electron</strong> radical interaction chamber (ERIC)<br />
Figure 1. At <strong>electron</strong> energies above ∼ 9 eV positive ions are formed by <strong>electron</strong> impact,<br />
which can be detected by reversing <strong>the</strong> mass spectrometer potentials. The maximum<br />
operating pressure in <strong>the</strong> <strong>electron</strong> spectrometer and time-of-flight mass spectrometer<br />
was less than 10 −5 mbar.<br />
The experiment is pulsed. A short, ∼ 1 µs, pulse of <strong>electron</strong>s is sent through <strong>the</strong><br />
interaction region. After <strong>the</strong> <strong>electron</strong>s have left <strong>the</strong> interaction region a pulse is sent <strong>to</strong><br />
<strong>the</strong> ion repeller <strong>to</strong> push ions <strong>to</strong>wards <strong>the</strong> ion detec<strong>to</strong>r. The repetition rate is 12 kHz.<br />
Conditions were chosen so that at most one ion is detected per ten cycles <strong>to</strong> minimize<br />
any paralysis of <strong>the</strong> detec<strong>to</strong>r due <strong>to</strong> <strong>the</strong> arrival of two ions of <strong>the</strong> same mass at <strong>the</strong> same<br />
time.<br />
The <strong>electron</strong> energy resolution (FWHM) was determined using <strong>the</strong> <strong>attachment</strong><br />
resonance of SF 6 at 0 eV <strong>to</strong> be approximately 250 meV. The <strong>electron</strong> energy scale was<br />
calibrated by comparing <strong>the</strong> observed positions of <strong>the</strong> <strong>attachment</strong> bands of CS 2 with<br />
<strong>the</strong> plasma turned off with literature values [21, 22, 23].<br />
3. Results and Discussion<br />
3.1. <strong>Dissociative</strong> <strong>electron</strong> <strong>attachment</strong> <strong>to</strong> CS 2<br />
Electron <strong>attachment</strong> <strong>to</strong> CS 2 has been described previously [21, 22, 23]. S − formation was<br />
observed with <strong>electron</strong> energies of ∼ 3.6, 6.2, 7.7 and 9.2 eV [22]. The first peak consists
<strong>Dissociative</strong> <strong>electron</strong> <strong>attachment</strong> <strong>to</strong> CS 4<br />
Electron Energy (eV)<br />
12<br />
10<br />
8<br />
6<br />
4<br />
2<br />
0<br />
O - S - CS - S 2<br />
-<br />
(a)<br />
log(Counts)<br />
2.5<br />
2<br />
1.5<br />
1<br />
0.5<br />
0<br />
2000 2500 3000 3500 4000 4500 5000 5500<br />
Time-of-Flight (ns)<br />
Electron Energy (eV)<br />
10<br />
9<br />
8<br />
7<br />
6<br />
C - O - S - CS - S 2<br />
-<br />
CS 2<br />
-<br />
(b)<br />
log(Counts)<br />
3<br />
2.5<br />
2<br />
1.5<br />
1<br />
0.5<br />
0<br />
5<br />
4<br />
2000 2500 3000 3500 4000 4500 5000 5500<br />
Time-of-Flight (ns)<br />
Figure 2. <strong>Dissociative</strong> <strong>electron</strong> <strong>attachment</strong> spectra of CS 2 . The horizontal axes are<br />
<strong>the</strong> times-of-flight of <strong>the</strong> ions and vertical axes show <strong>the</strong> incident <strong>electron</strong> energy.<br />
(a) (Top) <strong>Dissociative</strong> <strong>electron</strong> <strong>attachment</strong> bands in CS 2 . At 0 eV 35 Cl − and 37 Cl −<br />
are visible from DEA <strong>to</strong> residual CCl 4 .<br />
(b) (Bot<strong>to</strong>m) CS 2 <strong>attachment</strong> bands at 6.2, 7.7 and ∼ 9 eV. Also visible is O −<br />
from DEA <strong>to</strong> residual water and CS − 2 formed in secondary processes.<br />
of two close resonances at 3.35 and 3.65 eV [21]. The ions CS − and S − 2 are produced<br />
at 6.2 eV and C − is formed at 6.5 and 7.7 eV. <strong>Dissociative</strong> <strong>electron</strong> <strong>attachment</strong> <strong>to</strong><br />
<strong>electron</strong>ically excited CS 2 in its ˜B 1 B 2 state gives S − at 0.5 eV and CS − at 1.2 eV [24].<br />
Disociative <strong>electron</strong> <strong>attachment</strong> spectra of CS 2 measured here are shown in figures<br />
2, 3 and 4. Figures 2 (a) and (b) show 2-dimensional plots of <strong>the</strong> anion intensity versus
<strong>Dissociative</strong> <strong>electron</strong> <strong>attachment</strong> <strong>to</strong> CS 5<br />
Counts<br />
700<br />
600<br />
500<br />
400<br />
300<br />
200<br />
100<br />
0<br />
S -<br />
0 1 2 3 4 5 6 7 8 9<br />
Electron Energy (eV)<br />
Figure 3. S − ion signal from dissociative <strong>electron</strong> <strong>attachment</strong> <strong>to</strong> CS 2 as a function of<br />
<strong>electron</strong> energy<br />
Counts<br />
1800<br />
1600<br />
1400<br />
1200<br />
1000<br />
800<br />
600<br />
400<br />
200<br />
0<br />
(a)<br />
S -<br />
CS -<br />
S 2<br />
-<br />
5 6 7 8 9 10<br />
Counts<br />
1000<br />
100<br />
10<br />
1<br />
(b)<br />
S -<br />
CS -<br />
S 2<br />
-<br />
5 6 7 8 9 10<br />
Electron Energy (eV)<br />
Electron Energy (eV)<br />
Figure 4. <strong>Dissociative</strong> <strong>electron</strong> <strong>attachment</strong> <strong>to</strong> CS 2 between 5 and 10 eV. The same<br />
data are presented with linear (left) and logarithmic (right) vertical axes.<br />
time-of-flight and <strong>the</strong> <strong>electron</strong> energy. In plot (b) C − and CS − 2 can be seen very weakly.<br />
The CS − 2 is most likely produced in <strong>the</strong> interaction region by secondary charge transfer<br />
reactions as reported in [22]. Figures 3 and 4 show integrated signals of <strong>the</strong> anions<br />
formed. The double peak at 3.6 eV could not be resolved clearly due <strong>to</strong> <strong>the</strong> current<br />
experimental <strong>electron</strong> energy resolution. There is perhaps some hint of <strong>the</strong> double peak<br />
structure in <strong>the</strong> data in Figure 3 near 3.6 eV. The centroids of <strong>the</strong> of <strong>the</strong> three S − peaks<br />
from CS 2 at 3.5, 6.2 and 7.7 eV were used in <strong>the</strong> energy calibration of <strong>the</strong> data. The<br />
differences between positions of <strong>the</strong> geometric centroids and <strong>the</strong> peak maxima were less<br />
that 0.15 eV.<br />
3.2. Composition of <strong>the</strong> gas formed in <strong>the</strong> microwave plasma and positive mass spectra<br />
The composition of <strong>the</strong> gas sample formed in <strong>the</strong> microwave discharge depended strongly<br />
on <strong>the</strong> inlet pressures of CS 2 and He as shown in Figure 5. Figures 5 shows positive ion
<strong>Dissociative</strong> <strong>electron</strong> <strong>attachment</strong> <strong>to</strong> CS 6<br />
Counts<br />
18000<br />
16000<br />
14000<br />
12000<br />
10000<br />
8000<br />
6000<br />
4000<br />
2000<br />
0<br />
(a)<br />
O 2 /S + CS + CS 2<br />
+ C 3 S 2<br />
+<br />
C +<br />
2000 4000 6000 8000<br />
Time of flight (ns)<br />
Counts<br />
450<br />
400 (b) CS +<br />
350<br />
300<br />
O 2 /S +<br />
+ SO + S 2 O +<br />
250 N 2<br />
200<br />
OCS +<br />
+ + + +<br />
150 S 2 CS2<br />
100 H 2 O +<br />
S 5 S7<br />
50<br />
C +<br />
0<br />
2000 4000 6000 8000<br />
S 3<br />
+ S4<br />
+ S6<br />
+ S8<br />
+<br />
Time of flight (ns)<br />
Figure 5. Positive ion mass spectra with <strong>the</strong> plasma on and different inlet pressures<br />
of He and CS 2 ; <strong>the</strong> inlet pressure of CS 2 is high in (a) and low in (b). The <strong>electron</strong><br />
energy is ∼ 20 eV in both spectra.<br />
Counts<br />
12000<br />
10000<br />
8000<br />
6000<br />
4000 O 2 /S + CS +<br />
CS 2<br />
+<br />
2000<br />
+<br />
H<br />
S 2 2 O +<br />
0<br />
2000 4000 6000 8000<br />
Time of flight (ns)<br />
Figure 6. Positive ion mass spectra of He + CS 2 with <strong>the</strong> plasma off. The <strong>electron</strong><br />
energy is ∼ 20 eV, which is, of course, below <strong>the</strong> ionization energy of helium.<br />
mass spectra recorded at ∼ 20 eV <strong>electron</strong> energy of <strong>the</strong> gas in <strong>the</strong> inlet system with (a)<br />
a high inlet pressure of CS 2 and (b) a low pressure of CS 2 . At high CS 2 inlet pressure,<br />
Figure 5 (a), <strong>the</strong> CS + signal is very strong whereas at low CS 2 pressure, Figure 5 (b),<br />
S + n ions and background gas ions (H 2 O + , N + 2 , O + 2 ) are clearly visible. For comparison,<br />
a mass spectrum of CS 2 and He with <strong>the</strong> plasma off is shown in Figure 6.<br />
The presence of CS in <strong>the</strong> gas sample with <strong>the</strong> plasma on is confirmed by <strong>the</strong><br />
appearance energy measurement shown in Figure 7 for CS + . Values of 13.6-16.2 eV<br />
have been reported for appearance energy for CS + from CS 2 whereas <strong>the</strong> evaluated<br />
literature value of <strong>the</strong> ionization energy of CS is 11.3 eV [25]. The observed appearance<br />
energy of CS + here with <strong>the</strong> plasma on, 11.3 ± 0.3 eV, is in good agreement with<br />
ionization energy of CS. The appearance energy of CS + with <strong>the</strong> plasma off observed<br />
here, 16.0 ± 0.5 eV, is not out of line with previous measurements for <strong>the</strong> appearance
<strong>Dissociative</strong> <strong>electron</strong> <strong>attachment</strong> <strong>to</strong> CS 7<br />
Counts<br />
18000<br />
16000<br />
14000<br />
12000<br />
10000<br />
8000<br />
6000<br />
4000<br />
2000<br />
0<br />
(a)<br />
CS +<br />
CS 2<br />
+<br />
10 12 14 16 18 20<br />
Electron Energy (eV)<br />
Counts<br />
25000<br />
20000<br />
15000<br />
10000<br />
5000<br />
0<br />
(b)<br />
CS +<br />
CS 2<br />
+<br />
10 12 14 16 18 20<br />
Electron Energy (eV)<br />
Figure 7. Intensities of CS + and CS + 2 observed with (a) <strong>the</strong> plasma off and (b) <strong>the</strong><br />
plasma on as a function of <strong>electron</strong> energy. The presence of CS in <strong>the</strong> gas sample with<br />
<strong>the</strong> plasma on is confirmed by <strong>the</strong> appearance of CS + at <strong>the</strong> ionization energy of CS.<br />
Counts<br />
600<br />
500<br />
400<br />
300<br />
200<br />
100<br />
0<br />
(a)<br />
C 2 S +<br />
C 3 S 2<br />
+<br />
10 12 14 16 18 20<br />
Electron Energy (eV)<br />
Counts<br />
400<br />
350<br />
300<br />
250<br />
200<br />
150<br />
100<br />
50<br />
0<br />
(b)<br />
S 2 O +<br />
SO +<br />
10 12 14 16 18 20<br />
Electron Energy (eV)<br />
Figure 8. (a) Intensities of C 2 S + and C 3 S + 2 as a function of <strong>electron</strong> energy with <strong>the</strong><br />
plasma on at high CS 2 inlet pressure and (b) intensities of SO + and S 2 O + with <strong>the</strong><br />
plasma on with low CS 2 inlet pressure.<br />
energy of CS + from CS 2 .<br />
CS is known <strong>to</strong> undergo spontaneous polymerisation reactions leading <strong>to</strong> species of<br />
<strong>the</strong> type C n S m . Proposed reactions leading <strong>to</strong> <strong>the</strong> formation of C 3 S 2 are [26]<br />
2CS → C 2 S + S (2)<br />
C 2 S + CS → C 3 S 2 (3)<br />
C 3 S + 2 and also weakly C 2 S + were observed in <strong>the</strong> positive ion mass spectrum with <strong>the</strong><br />
plasma on. Most of <strong>the</strong> C 2 S + detected, however, is likely <strong>to</strong> be due <strong>to</strong> dissociation of a<br />
larger ion ra<strong>the</strong>r than ionization of C 2 S as <strong>the</strong> observed appearance energy is relatively<br />
high at 15.5 ± 0.5 eV, see Figure 8(a). The ionization threshold of C 3 S 2 is determined<br />
<strong>to</strong> be 9.4 ± 0.3 eV from <strong>the</strong> data shown in Figure 8(a). This is in good agreement<br />
with a predicted vertical ionization energy of 9.19 eV calculated here with a GAMESS
<strong>Dissociative</strong> <strong>electron</strong> <strong>attachment</strong> <strong>to</strong> CS 8<br />
Counts<br />
160<br />
140<br />
120<br />
100<br />
80<br />
60<br />
40<br />
20<br />
0<br />
S 2 F +<br />
10 12 14 16 18 20<br />
Electron Energy (eV)<br />
Figure 9. Intensity of S 2 F + as a function of <strong>electron</strong> energy <strong>to</strong> show <strong>the</strong> ionization<br />
threshold of S 2 F<br />
[27, 28, 29] MP2 calculation using <strong>the</strong> 6-31G ∗ basis set and Koopmans <strong>the</strong>orem [30].<br />
The molecular geometry was optimized as part of <strong>the</strong> same calculation under linear D ∞h<br />
symmetry [31].<br />
S 2 O + and SO + were observed in <strong>the</strong> positive ion mass spectra with <strong>the</strong> plasma<br />
on particularly with low flows of CS 2 . Appearance energy measurements are shown in<br />
Figure 8(b). The SO + is a fragment ion because <strong>the</strong> ionization threshold of SO is 10.3<br />
eV [25] but <strong>the</strong> observed appearance energy of SO + is 14.0 ± 0.5 eV. This appearance<br />
energy is in agreement with <strong>the</strong> reported appearance energies of <strong>the</strong> SO + fragment from<br />
S 2 O of 13.7 and 14.5 eV [25]. The appearance energy of S 2 O + , 10.6 ± 0.3 eV, is in<br />
agreement with <strong>the</strong> ionization energy of S 2 O, 10.6 eV [25]. Therefore, S 2 O was present<br />
in <strong>the</strong> gas stream.<br />
When <strong>the</strong> microwave plasma was turned on with CS 2 in <strong>the</strong> gas stream a clearly<br />
visible black deposit was formed on <strong>the</strong> inside of <strong>the</strong> glass wall in <strong>the</strong> region of <strong>the</strong><br />
microwave cavity. Etching <strong>the</strong> residual black deposit by introducing He and C 3 F 6 ,<br />
perfluoropropene, in<strong>to</strong> <strong>the</strong> gas inlet system with <strong>the</strong> plasma on led <strong>to</strong> <strong>the</strong> production<br />
of <strong>the</strong> S 2 F radical. S 2 F + was observed at mass 83 with an appearance energy of 10.3<br />
± 0.4 eV as shown in Figure 9. It seems unlikely that this was a fragment ion due <strong>to</strong><br />
its low appearance energy and also because no possible parent ion was observed in <strong>the</strong><br />
mass spectrum with a lower appearance energy. A signal was also observed at mass<br />
85 with <strong>the</strong> expected relative intensity of 34 S 32 SF + and 32 S 34 SF + ions. Therefore, it is<br />
concluded that <strong>the</strong> ionization threshold of S 2 F is 10.3 ± 0.4 eV. It appears that this is a<br />
new measurement as no previous values have been found <strong>to</strong> compare it with. Theoretical<br />
ionization energy calculations for this molecule and o<strong>the</strong>r open shell molecules are<br />
significantly more complicated than for closed shell molecules, see e.g. [32], such as<br />
C 3 S 2 and have not been pursued here.<br />
Small signals of sulphur ions S + n (n=3..8) were observed with <strong>the</strong> plasma on, visible<br />
in figure 5 (b). In some measurements, mass 60 was observed weakly, see figure 5 (b).
<strong>Dissociative</strong> <strong>electron</strong> <strong>attachment</strong> <strong>to</strong> CS 9<br />
Electron Energy (eV)<br />
10<br />
8<br />
6<br />
4<br />
2<br />
C - S - (a)<br />
log(Counts)<br />
2<br />
1.8<br />
1.6<br />
1.4<br />
1.2<br />
1<br />
0.8<br />
0.6<br />
0.4<br />
0.2<br />
0<br />
0<br />
2000 3000 4000 5000 6000 7000<br />
Time-of-Flight (ns)<br />
C - S - S 2<br />
-<br />
S 3<br />
-<br />
S 4<br />
-<br />
(b)<br />
log(Counts)<br />
Electron Energy (eV)<br />
10<br />
8<br />
6<br />
4<br />
2<br />
3<br />
2.5<br />
2<br />
1.5<br />
1<br />
0.5<br />
0<br />
0<br />
2000 3000 4000 5000 6000 7000<br />
Time-of-Flight (ns)<br />
O - S - S 2<br />
-<br />
S 3<br />
-<br />
S 4<br />
-<br />
(c)<br />
log(Counts)<br />
Electron Energy (eV)<br />
10<br />
8<br />
6<br />
4<br />
2<br />
1.6<br />
1.4<br />
1.2<br />
1<br />
0.8<br />
0.6<br />
0.4<br />
0.2<br />
0<br />
0<br />
2000 3000 4000 5000 6000 7000<br />
Time-of-Flight (ns)<br />
Figure 10. <strong>Dissociative</strong> <strong>electron</strong> <strong>attachment</strong> spectra with <strong>the</strong> plasma on under<br />
different inlet pressure conditions. The CS 2 inlet pressure is highest in (a) and lowest<br />
in (c).
<strong>Dissociative</strong> <strong>electron</strong> <strong>attachment</strong> <strong>to</strong> CS 10<br />
This could be OCS formed in <strong>the</strong> plasma. Finally, <strong>the</strong> C + and most of <strong>the</strong> S + and<br />
S + 2 ions observed are fragments of ionization as <strong>the</strong>y appear far above <strong>the</strong> ionization<br />
thresholds of C, S and S 2 . The possibility, however, that traces of S and S 2 were present<br />
in <strong>the</strong> gas stream cannot be excluded.<br />
3.3. Electron <strong>attachment</strong> <strong>to</strong> CS<br />
Spectra of <strong>the</strong> negative ions formed with <strong>the</strong> plasma on at different discharge and<br />
pressure conditions are shown in figures 10 (a)-(c). Attachment bands, most visible<br />
in figure 10(a) appear at ∼ 5-7 eV which give S − and C − . Ano<strong>the</strong>r S − band is observed<br />
at ∼ 1.8 eV in figures 10(b) and (c), but not (a). S − 2 and S − 3 ions are observed at ∼ 4<br />
and ∼ 7 eV and S − 4 at ∼ 4 eV only. Again <strong>the</strong>se S − n peaks are visible in figures 10(b)<br />
and (c), but not (a). Finally S − formation appears very weakly at ∼ 3.5 eV visible only<br />
in figure 10(b) and O − is observed at ∼ 5.4 eV in figure 10(c). The CS 2 inlet pressure<br />
was highest in <strong>the</strong> measurement shown in Figure 10(a) and lowest in Figure 10(c). The<br />
partial pressures of <strong>the</strong> different molecules in <strong>the</strong> gas sample varies with inlet pressure<br />
as seen in Figure 5 where, for example, it can be seen that <strong>the</strong>re is more CS present<br />
with higher CS 2 inlet pressure.<br />
The identification of <strong>the</strong> dissociative <strong>electron</strong> <strong>attachment</strong> peaks originating from<br />
<strong>the</strong> <strong>unstable</strong> CS molecule is not straightforward as <strong>the</strong> plasma contains several species<br />
that can give S − and C − through dissociative <strong>electron</strong> <strong>attachment</strong>. Some species can,<br />
however, be excluded or assigned as candidates for <strong>the</strong> different observed <strong>attachment</strong><br />
bands by comparison with literature spectra where available. For example, <strong>the</strong> weak<br />
S − signal at ∼ 3.5 eV can be assigned <strong>to</strong> DEA <strong>to</strong> CS 2 as described in section 3.1.<br />
Fur<strong>the</strong>rmore, <strong>the</strong> positions of <strong>the</strong> S − 2 , S − 3 and S − 4 peaks are close <strong>to</strong> <strong>the</strong> positions of <strong>the</strong><br />
peaks observed in dissociative <strong>electron</strong> <strong>attachment</strong> <strong>to</strong> sulphur vapour [33]. <strong>Dissociative</strong><br />
<strong>electron</strong> <strong>attachment</strong> <strong>to</strong> sulphur vapour shows three <strong>attachment</strong> bands, at zero eV (S − n<br />
n=1-8), at about 4 eV (S − n n=2-5) and 7.5 eV (S− n n=1-3), with S− 2 S − 3 and S − 4 showing<br />
<strong>the</strong> highest intensities [33]. The intensity of S − is in all cases lower than <strong>the</strong> intensity<br />
of S − 2 , S − 3 and S − 4 . The similarity between <strong>the</strong> present data and <strong>the</strong>se results for<br />
sulphur vapour has led <strong>to</strong> <strong>the</strong> conclusion that <strong>the</strong> formation of S − 2 , S − 3 and S − 4 is due <strong>to</strong><br />
dissociative <strong>electron</strong> <strong>attachment</strong> <strong>to</strong> S 8 and any smaller S n species that may be present<br />
in <strong>the</strong> gas sample. The composition of <strong>the</strong> sulphur vapour cannot be obtained from<br />
measurements of appearance thresholds for two reasons. First, <strong>the</strong> signal of <strong>the</strong>se ions<br />
is weak, which increases <strong>the</strong> uncertainty in appearance energy measurements. Secondly,<br />
<strong>the</strong> ionization energies of S n molecules, ∼ 9.0 <strong>to</strong> 9.5 eV, are close <strong>to</strong> appearance energies<br />
of S + n fragment ions from larger S m molecules, ∼ 10 <strong>to</strong> 13 eV, where, of course, n <<br />
m [25]. <strong>Dissociative</strong> <strong>electron</strong> <strong>attachment</strong> <strong>to</strong> form S − n ions was not observed at zero eV.<br />
It may be that <strong>the</strong> composition of <strong>the</strong> sulphur species produced in <strong>the</strong> plasma here<br />
is different <strong>to</strong> that of sulphur vapour in [33]. An alternative explanation is that <strong>the</strong><br />
operation of <strong>the</strong> plasma reduced <strong>the</strong> sensitivity of <strong>the</strong> spectrometer <strong>to</strong> observe processes<br />
very close <strong>to</strong> zero <strong>electron</strong> energy. It is worth pointing out that <strong>the</strong> threshold for negative
<strong>Dissociative</strong> <strong>electron</strong> <strong>attachment</strong> <strong>to</strong> CS 11<br />
ion production from CS by dissociative <strong>electron</strong> <strong>attachment</strong>, ∼ 5.3 eV see below, is well<br />
above zero energy.<br />
Le Coat et al. [33] also observed dissociative <strong>electron</strong> <strong>attachment</strong> <strong>to</strong> S 2 leading<br />
<strong>to</strong> <strong>the</strong> formation of S − at 2.4 and 4.55 eV. No S − <strong>attachment</strong> bands are seen at <strong>the</strong>se<br />
energies in any of <strong>the</strong> spectra recorded and so it can be concluded from <strong>the</strong> negative<br />
spectra that at most a trace of S 2 was present in <strong>the</strong> gas sample.<br />
An important observation from <strong>the</strong> data of Le Coat et al. [33] is that sulphur<br />
vapour species, such as S 8 cannot be responsible for <strong>the</strong> S − <strong>attachment</strong> bands at ∼ 1.8<br />
eV and above 5 eV. Similarly, OCS , which was observed in some, but not all, of <strong>the</strong><br />
measurements, can also be excluded as a candidate for <strong>the</strong> <strong>attachment</strong> bands at ∼ 1.8<br />
eV and above 5 eV as <strong>the</strong> positions of its known <strong>attachment</strong> bands [34] are different.<br />
It is unlikely that <strong>electron</strong>ically excited CS 2 was present in <strong>the</strong> gas sample as it would<br />
have been observed by a drop in <strong>the</strong> ionization energy of CS 2 with <strong>the</strong> plasma on, which<br />
was not seen in <strong>the</strong> positive ion mass spectrum.<br />
The assignment of <strong>the</strong> remaining species <strong>to</strong> <strong>the</strong> observed dissociative <strong>electron</strong><br />
<strong>attachment</strong> peaks has been made by comparison of <strong>the</strong> variation in intensities of<br />
negative <strong>electron</strong> <strong>attachment</strong> peaks with <strong>the</strong> plasma operated under different conditions<br />
compared <strong>to</strong> <strong>the</strong> variation in <strong>the</strong> densities of neutral species in <strong>the</strong> interaction region.<br />
The density of neutral species in <strong>the</strong> gas sample is estimated from <strong>the</strong> positive ionization<br />
curves recorded at each different pressure condition. A change in <strong>the</strong> intensity of a<br />
positive parent ion of each molecule should be accompanied by a similar change in <strong>the</strong><br />
intensity of <strong>the</strong> dissociative <strong>electron</strong> <strong>attachment</strong> bands due <strong>to</strong> <strong>the</strong> same molecule in<br />
<strong>the</strong> negative ion spectrum. In fact, changes in <strong>the</strong> ratios of intensities between two<br />
molecules, say A and B, are considered. The change in <strong>the</strong> ratio of <strong>the</strong> intensities of<br />
two parent positive ions, I A + <strong>to</strong> I B +, between two different pressure conditions p 1 and<br />
p 2 should be equal <strong>to</strong> <strong>the</strong> change in ratios of <strong>the</strong> intensities of <strong>the</strong> negative ions formed<br />
by <strong>the</strong> same molecules, I a − <strong>to</strong> I b −, between p 1 and p 2 in <strong>the</strong> negative ion spectrum. This<br />
relationship can be represented by<br />
I A +(p 1 )/I B +(p 1 )<br />
I A +(p 2 )/I B +(p 2 ) = I a −(p 1)/I b −(p 1 )<br />
I a −(p 2 )/I b −(p 2 )<br />
The relationship shown in equation 4 has been presented previously [19].<br />
The unassigned <strong>electron</strong> <strong>attachment</strong> bands have been identified with equation 4.<br />
Calculations were made of I A + / I B + <strong>to</strong> compare <strong>the</strong> intensity of each parent ion<br />
A + in <strong>the</strong> positive ion mass spectra with <strong>the</strong> parent ion of ‘reference’ molecules B + .<br />
Reference molecules are molecules present in <strong>the</strong> gas sample, which have known <strong>electron</strong><br />
<strong>attachment</strong> bands. Here, S 8 and CS 2 have been used as reference molecules. The<br />
<strong>electron</strong> <strong>attachment</strong> spectra of CS 2 are known and <strong>the</strong> bands of S − n (n=2-4) observed<br />
here are considered <strong>to</strong> originate from S 8 or from sulphur species whose number density<br />
is proportional <strong>to</strong> <strong>the</strong> number density of S 8 molecules. Calculations were also made of<br />
I a − / I b − where <strong>the</strong> a − are <strong>the</strong> unidentified <strong>electron</strong> <strong>attachment</strong> bands and <strong>the</strong> b − are<br />
<strong>the</strong> <strong>electron</strong> <strong>attachment</strong> bands of <strong>the</strong> reference molecules. Spectra were recorded under<br />
(4)
<strong>Dissociative</strong> <strong>electron</strong> <strong>attachment</strong> <strong>to</strong> CS 12<br />
four different sets of pressure conditions. The intensity of <strong>the</strong> reference molecules in <strong>the</strong><br />
positive and negative ion spectra, however, was sometimes ra<strong>the</strong>r low, which introduced<br />
some uncertainty in<strong>to</strong> some of <strong>the</strong> ratios calculated. Care has been taken <strong>to</strong> ensure<br />
that fragment ions, such as CS + from CS 2 , do not contribute <strong>to</strong> <strong>the</strong> intensity of parent<br />
ions, such as CS + from CS, by checking data with <strong>electron</strong> energies below fragmentation<br />
thresholds.<br />
The observed <strong>attachment</strong> bands <strong>to</strong> be assigned were S − at 1.8 eV, S − at 5.43 eV,<br />
S − at ∼ 6.70 eV, O − at ∼ 5.4 eV and C − at ∼ 6.40 eV. The relative intensities of<br />
three peaks, S − at 5.43 eV, S − at ∼ 6.70 eV and C − at ∼ 6.40 eV, remained constant<br />
as <strong>the</strong> inlet conditions varied suggesting that <strong>the</strong>y were due <strong>to</strong> dissociative <strong>electron</strong><br />
<strong>attachment</strong> <strong>to</strong> <strong>the</strong> same molecule. By contrast, <strong>the</strong> intensity of S − at 1.8 eV varies<br />
strongly compared <strong>to</strong> <strong>the</strong> intensities of <strong>the</strong> peaks at 5.43, ∼ 6.70 and ∼ 6.40 eV as can be<br />
seen in Figures 10. At high CS 2 inlet gas pressure <strong>the</strong> S − at 1.8 eV intensity is relatively<br />
low, whilst at low CS 2 pressure this peak is high. Application of equation 4 leads <strong>to</strong><br />
<strong>the</strong> conclusion that <strong>the</strong> S − <strong>attachment</strong> band at 1.8 eV is most likely due <strong>to</strong> dissociative<br />
<strong>electron</strong> <strong>attachment</strong> <strong>to</strong> S 2 O. The position of <strong>the</strong> maximum of this <strong>electron</strong> <strong>attachment</strong><br />
band observed here, 1.8 ± 0.3 eV is in agreement with <strong>the</strong> previously reported value<br />
of 1.6 eV for formation of S − from S 2 O [19] within <strong>the</strong> experimental uncertainties.<br />
No o<strong>the</strong>r dissociative <strong>electron</strong> <strong>attachment</strong> bands were observed for S 2 O in that earlier<br />
measurement [19]. The small amount of O − detected at low pressures at ∼ 5.4 eV, which<br />
cannot be due <strong>to</strong> <strong>electron</strong> <strong>attachment</strong> <strong>to</strong> H 2 O [35], is, however, tentatively assigned here<br />
<strong>to</strong> S 2 O as well. In <strong>the</strong> earlier measurements S 2 O was generated from SO 2 and strong<br />
dissociative <strong>electron</strong> <strong>attachment</strong> <strong>to</strong> residual SO 2 in <strong>the</strong> gas sample between 4 and 6 eV<br />
would have masked this new <strong>electron</strong> <strong>attachment</strong> band of S 2 O at 5.4 eV, a possibility<br />
acknowledged in <strong>the</strong> earlier work.<br />
2500<br />
2000<br />
(a) S -<br />
1000<br />
(b) S -<br />
C -<br />
Counts<br />
1500<br />
1000<br />
500<br />
C - 1<br />
Counts<br />
100<br />
10<br />
0<br />
5 5.5 6 6.5 7<br />
Electron Energy (eV)<br />
5 5.5 6 6.5 7<br />
Electron Energy (eV)<br />
Figure 11. <strong>Dissociative</strong> <strong>electron</strong> <strong>attachment</strong> bands assigned <strong>to</strong> CS<br />
Application of equation 4 <strong>to</strong> <strong>the</strong> remaining three peaks, S − at 5.43 eV, C − at ∼<br />
6.40 eV and S − at ∼ 6.70 eV, does not lead <strong>to</strong> an unambiguous assignment. Both CS<br />
and C 3 S 2 could be responsible for <strong>the</strong>se three bands. The lack of larger C n S − m fragments
<strong>Dissociative</strong> <strong>electron</strong> <strong>attachment</strong> <strong>to</strong> CS 13<br />
in <strong>the</strong> spectra favours assignment <strong>to</strong> CS over C 3 S 2 . Similarly, it would perhaps be<br />
unlikely that <strong>the</strong> C − ion would be so prominent in dissociative <strong>electron</strong> <strong>attachment</strong> <strong>to</strong><br />
C 3 S 2 because of <strong>the</strong> molecular rearrangement required for dissociation <strong>to</strong> give C − . It<br />
is also more likely <strong>the</strong>se three <strong>electron</strong> <strong>attachment</strong> bands are due <strong>to</strong> CS because <strong>the</strong>ir<br />
positions agree well with calculated <strong>the</strong>rmodynamic threshold for formation of C − and<br />
S − from CS as discussed in section 3.4. Therefore, <strong>the</strong>se three <strong>electron</strong> <strong>attachment</strong><br />
bands are assigned <strong>to</strong> <strong>the</strong> <strong>unstable</strong> CS molecule. The integrated intensities of <strong>the</strong> bands<br />
assigned <strong>to</strong> CS are shown in Figure 11; spectrum (a) has a linear vertical axis and (b)<br />
is logarithmic.<br />
3.4. <strong>Dissociative</strong> <strong>electron</strong> <strong>attachment</strong> thresholds<br />
The appearance energy AE(B − ) of a fragment anion B − in dissociative <strong>electron</strong><br />
<strong>attachment</strong> <strong>to</strong> a molecule AB can be estimated using <strong>the</strong> equation<br />
AE(B − ) = D(A−B) − EA(B) + E ∗ (5)<br />
where D(A-B) is <strong>the</strong> dissociation energy of <strong>the</strong> chemical bond that is broken, EA(B)<br />
is <strong>the</strong> <strong>electron</strong> affinity of <strong>the</strong> fragment B and E* is <strong>the</strong> excess energy above <strong>the</strong><br />
<strong>the</strong>rmodynamic limit. Below it is assumed that E* is zero.<br />
In figure 11 <strong>the</strong> S − band at 5.43 eV appears <strong>to</strong> have an assymmetric peakshape,<br />
particularly compared <strong>to</strong> <strong>the</strong> CS 2 bands in figure 4. If it is assumed that <strong>the</strong>re is a<br />
vertical onset for S − formation at its <strong>the</strong>rmodynamic threshold on <strong>the</strong> low energy side<br />
of this band <strong>the</strong>n <strong>the</strong> energy resolution of <strong>the</strong> <strong>electron</strong> beam may be calculated from<br />
<strong>the</strong> rise of <strong>the</strong> S − signal. The <strong>electron</strong> energy resolution calculated in this way is 150<br />
meV, which is better than <strong>the</strong> resolution determined with SF 6 , 250 meV. The resolution<br />
determined from <strong>the</strong> right hand side of <strong>the</strong> peak is 300 meV. Therefore, it is concluded<br />
that <strong>the</strong> S − band at 5.43 eV is cut off at low energy by <strong>the</strong> threshold for formation of<br />
S − . The threshold for formation of S − determined experimentally from <strong>the</strong> position of<br />
half maximum on <strong>the</strong> S − rise is 5.26 ± 0.15 eV.<br />
The <strong>electron</strong> energy resolution calculated from this low energy rise of <strong>the</strong> C − band at<br />
∼ 6.40 eV is also 150 meV, which suggests that this band starts at <strong>the</strong> <strong>the</strong>rmodynamic<br />
threshold for C − production. The experimental threshold determined from <strong>the</strong> half<br />
maximum position of <strong>the</strong> C − signal rise is 6.21 ± 0.15 eV.<br />
The thresholds for formation of S − and C − from C 3 S 2 and CS have been calculated<br />
with equation 5. The bond energy of <strong>the</strong> C-S bond can be calculated from <strong>the</strong> heats of<br />
formation of CS (280.33 kJ/mol), S (276.98 kJ/mol) and C (716.67 kJ/mol) [25] leading<br />
<strong>to</strong> D(C-S)= 7.39 eV. A literature value is D(C-S)=7.379 ± 0.025 eV [36]. The <strong>electron</strong><br />
affinities of S and C are 2.077 eV and 1.262 eV respectively [25]. The <strong>the</strong>rmodynamic<br />
threshold for <strong>the</strong> reaction CS + e − → C + S − lies <strong>the</strong>n at 5.302 ± 0.025 eV, which is<br />
in excellent agreement with <strong>the</strong> experimentally determined threshold of 5.26 ± 0.15 eV.<br />
The calculated threshold for <strong>the</strong> production of <strong>the</strong> <strong>carbon</strong> anion C − is 6.117 ± 0.025<br />
eV, which agrees with <strong>the</strong> experimental value, 6.21 ± 0.15 eV, within <strong>the</strong> experimental<br />
uncertainty.
<strong>Dissociative</strong> <strong>electron</strong> <strong>attachment</strong> <strong>to</strong> CS 14<br />
In <strong>the</strong> case of C 3 S 2 <strong>the</strong> energy of <strong>the</strong> S-CCCS bond can be calculated using <strong>the</strong><br />
heats of formation of S (276.98 kJ/mol [25]), CCCS (567 kJ/mol [37]) and SCCCS (412.5<br />
kJ/mol [38]) which lead <strong>to</strong> D(S-CCCS)=4.47 eV. As <strong>the</strong> <strong>electron</strong> affinity of sulphur is<br />
EA(S)=2.077 eV <strong>the</strong> calculated threshold for formation of S − from C 3 S 2 is AE(S − )=2.39<br />
eV, much lower than <strong>the</strong> experimentally observed threshold at 5.26 ± 0.15 eV, which is<br />
confirmation that C 3 S 2 is not responsible for <strong>the</strong>se <strong>electron</strong> <strong>attachment</strong> bands between<br />
5 and 7 eV. The determination of <strong>the</strong> threshold for C − formation from C 3 S 2 is more<br />
complex. For <strong>the</strong> dissociation of SCCCS in<strong>to</strong> C − and SCCS <strong>the</strong> S-CCCS and <strong>the</strong> SC-<br />
CCS bonds have <strong>to</strong> be broken and <strong>the</strong> S-CCS bond is formed. The appearance energy<br />
of C − thus is calculated using<br />
AE(C − ) = D(S − CCCS) + D(SC − CCS) − D(S − CCS) − EA(C) (6)<br />
The bond energy of <strong>the</strong> S-CCS bond is calculated using <strong>the</strong> heats of formation of SCCS<br />
(376.66 kJ/mol [38]), S and CCS (586 kJ/mol [37]) <strong>to</strong> be D(S-CCS)=5.04 eV. The bond<br />
energy of <strong>the</strong> SC-CCS bond is calculated using <strong>the</strong> heats of formation of SCCCS, CS and<br />
CCS <strong>to</strong> be 4.70 eV. The predicted <strong>the</strong>rmodynamic threshold for C − formation from C 3 S 2<br />
is calculated as AE(C − )=2.87 eV, which again is significantly lower than <strong>the</strong> observed<br />
value of 6.21 ± 0.15 eV.<br />
There are two low lying excited <strong>electron</strong>ic state of <strong>the</strong> <strong>carbon</strong> a<strong>to</strong>m; 1 D and 1 S,<br />
which lie 1.264 and 2.684 eV above <strong>the</strong> ground state respectively [39]. The calculated<br />
threshold for formation of C ( 1 D) + S − from CS is 6.566 ± 0.025 eV, which is in<br />
agreement with <strong>the</strong> half maximum position of <strong>the</strong> low energy rise of <strong>the</strong> smaller second<br />
S − <strong>electron</strong> band at 6.49 ± 0.15 eV. It is not possible <strong>to</strong> determine from <strong>the</strong> experimental<br />
data if <strong>the</strong> second S − band rises at <strong>the</strong> threshold for C ( 1 D) + S − production because<br />
<strong>the</strong> high energy tail of <strong>the</strong> first S − band intereferes with <strong>the</strong> low energy rise of this<br />
second S − band. It is not certain from <strong>the</strong> experimental data whe<strong>the</strong>r or not <strong>the</strong> rise of<br />
<strong>the</strong> second band is so steep that it is effectively vertical. The similarity, however, in <strong>the</strong><br />
calculated threshold for formation of C ( 1 D) + S − from CS and <strong>the</strong> experimental half<br />
maximum position strongly suggest that this second S − band corresponds <strong>to</strong> formation<br />
of C ( 1 D) + S − . No experimental evidence has been found for formation of C ( 1 S) +<br />
S − from CS, which is energetically allowed above 7.986 ± 0.025 eV.<br />
There are also excited 1 D and 1 S <strong>electron</strong>ic states of <strong>the</strong> sulphur a<strong>to</strong>m 1.145 and<br />
2.750 eV above <strong>the</strong> ground state [40], but no experimental evidence was observed <strong>to</strong><br />
indicate that C − is formed in conjunction with <strong>the</strong>se low lying excited states of S. The<br />
threshold for formation of C − + S ( 1 D) is 7.262 eV, which is higher than that of any<br />
process observed here. Fur<strong>the</strong>rmore, <strong>the</strong> formation of sulphur a<strong>to</strong>ms in singlet states is,<br />
of course, spin forbidden as <strong>the</strong> temporary CS − state will be a doublet and <strong>the</strong> ground<br />
state of C − is quartet; 4 S.<br />
The anion C − has an excited 2 D state with an <strong>electron</strong> affinity of 0.033 eV [41].<br />
The threshold for formation of C − ( 2 D) + S is 7.346 eV, but again this is not observed.<br />
No <strong>electron</strong>ically excited states of S − are known [41].
<strong>Dissociative</strong> <strong>electron</strong> <strong>attachment</strong> <strong>to</strong> CS 15<br />
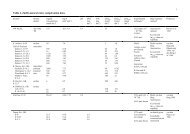
Table 1. Summary of results. The columns are D(A-B) bond dissociation energy,<br />
EA(B) <strong>electron</strong> affinity of <strong>the</strong> fragment B, AE(B − ) calculated threshold for <strong>the</strong><br />
formation of <strong>the</strong> fragment B − , Observed AE(B − ) experimentally observed threshold for<br />
B − , Observed Max <strong>electron</strong> energy at dissociative <strong>electron</strong> <strong>attachment</strong> band maximum<br />
and Cross Sections. See text for references.<br />
fragments: D(A-B) EA(B) AE(B − ) Observed Observed Cross Section<br />
B − A (eV) (eV) (eV) AE (eV) Max (eV) σ (Å 2 )<br />
S − C ( 3 P) 7.379 2.077 5.302 5.26±0.15 5.43±0.15 0.025<br />
CS S − C ( 1 D) 7.379 2.077 6.566 6.49±0.15 ∼ 6.70±0.15 0.0029<br />
C − S 7.379 1.262 6.117 6.21±0.15 ∼ 6.40±0.15 0.0024<br />
S 2 O S− SO 3.51 2.077 1.43 - 1.8±0.3 ∼0.09<br />
O − S 2 4.50 1.461 3.04 - ∼5.4
<strong>Dissociative</strong> <strong>electron</strong> <strong>attachment</strong> <strong>to</strong> CS 16<br />
data where <strong>the</strong> reference molecule was CS 2 present. The maximum variation between<br />
measurements was a fac<strong>to</strong>r of two for <strong>the</strong> S − bands and three for C − . The uncertainty in<br />
<strong>the</strong> average cross section values presented here is expected <strong>to</strong> be an order of magnitude<br />
at most. The cross sections determined here are presented in Table 1. The CS cross<br />
sections are presented with two significant figures because <strong>the</strong> uncertainties in <strong>the</strong>ir<br />
relative intensities are significantly smaller than <strong>the</strong> absolute uncertainties.<br />
There are two main sources of uncertainty for <strong>the</strong>se measurements; first, <strong>the</strong><br />
variation in <strong>the</strong> composition of <strong>the</strong> gas sample due <strong>to</strong> changing conditions in <strong>the</strong><br />
microwave source. Positive mass spectra cannot be recorded at exactly <strong>the</strong> same time as<br />
<strong>the</strong> negative ion spectra, but <strong>the</strong> changeover between recording positive and negative ion<br />
spectra is kept as short as possible <strong>to</strong> minimize this source of uncertainty. Fur<strong>the</strong>rmore,<br />
measuring times were also short <strong>to</strong> minimize any effects due <strong>to</strong> changes in <strong>the</strong> discharge<br />
over time. The second main source of uncertainty is <strong>the</strong> low intensity of <strong>the</strong> reference<br />
signal of S − from CS 2 in <strong>the</strong> <strong>electron</strong> <strong>attachment</strong> spectrum as <strong>the</strong> number density of<br />
CS 2 is low and <strong>the</strong> <strong>electron</strong> <strong>attachment</strong> cross section of CS 2 is ra<strong>the</strong>r small, 3.7 × 10 −3<br />
Å 2 [21].<br />
The cross section for <strong>the</strong> S − peak at 1.8 eV from S 2 O estimated here, 0.09 Å 2 ,<br />
is within an order of magnitude of <strong>the</strong> value reported previously, 0.3 Å 2 , [19] from<br />
different experiments with <strong>the</strong> same apparatus where SO 2 and He were passed through<br />
<strong>the</strong> microwave discharge <strong>to</strong> generate SO, S 2 O, SO 2 and S 2 O 2 . There were additional<br />
uncertainties in <strong>the</strong> determination of this S 2 O cross section. It was necessary <strong>to</strong> use<br />
CS as <strong>the</strong> reference molecule in one dataset where <strong>the</strong>re was not sufficient signal from<br />
CS 2 . It is expected that <strong>the</strong> previously reported value of 0.3 Å 2 is more reliable than<br />
<strong>the</strong> present one. The quality of <strong>the</strong> data for <strong>the</strong> weaker O − signal from S 2 O at 5.4 eV<br />
only allowed <strong>the</strong> estimation of an upper limit <strong>to</strong> its cross section.<br />
3.6. Dissociation Dynamics<br />
It interesting <strong>to</strong> compare <strong>the</strong> dissociative <strong>electron</strong> <strong>attachment</strong> <strong>to</strong> CS observed here with<br />
previous measurements for CO [42, 43, 44], which is, of course, valence-iso<strong>electron</strong>ic<br />
with CS. The dissociative <strong>electron</strong> <strong>attachment</strong> spectra of CO and CS are remarkably<br />
similar. O − is observed with a sharp onset at <strong>the</strong> <strong>the</strong>rmodynamic threshold for O −<br />
formation from CO at 9.63 eV, in <strong>the</strong> same way that S − is observed from CS at its<br />
<strong>the</strong>rmodynamic threshold. A second smaller O − signal from CO appears at 10.88 eV,<br />
<strong>the</strong> threshold for formation of O − + excited C ( 1 D), with ano<strong>the</strong>r sharp onset, which is<br />
analogous <strong>to</strong> <strong>the</strong> second smaller S − peak observed here from formation of S − + C ( 1 D).<br />
In <strong>the</strong> case of CO <strong>the</strong> second O − peak is largely obscured by <strong>the</strong> high energy tail of <strong>the</strong><br />
first O − band except in experiments where <strong>the</strong> kinetic energy of <strong>the</strong> fragment O − ion is<br />
selected [42]. It is interesting <strong>to</strong> note that <strong>the</strong> two S − peaks observed here from CS are<br />
observed without kinetic energy selection of <strong>the</strong> fragment ion.<br />
As well as <strong>the</strong> similarity between O − from CO and S − from CS <strong>the</strong>re is also some<br />
similarity between <strong>the</strong> formation of C − from CS and CO. A C − peak is observed for
<strong>Dissociative</strong> <strong>electron</strong> <strong>attachment</strong> <strong>to</strong> CS 17<br />
both CO and CS in between <strong>the</strong> two peaks of O − and S − . Above 10.2 eV C − is produced<br />
from CO with a cross section 3300 times smaller than for <strong>the</strong> O − peak above 9.63 eV<br />
[44]. C − production from CS shows a maximum at ∼ 6.40 eV with a cross section about<br />
ten times smaller than <strong>the</strong> intensity of <strong>the</strong> first S − peak, see Figure 11. In contrast <strong>to</strong><br />
CS where <strong>the</strong> C − has an onset at <strong>the</strong> <strong>the</strong>rmodynamic threshold, however, <strong>the</strong> formation<br />
of C − from CO is delayed by about 0.37 eV [45].<br />
<strong>Dissociative</strong> <strong>electron</strong> <strong>attachment</strong> <strong>to</strong> CS can be assigned as follows:<br />
CS ( 1 Σ + ) + e − (5.43 eV) → S − ( 2 P) + C ( 3 P) (8)<br />
CS ( 1 Σ + ) + e − (6.70 eV) → S − ( 2 P) + C ( 1 D) (9)<br />
CS ( 1 Σ + ) + e − (6.40 eV) → C − ( 4 S) + S ( 3 P) (10)<br />
It is not straightforward <strong>to</strong> determine <strong>the</strong> nature of <strong>the</strong> <strong>electron</strong> <strong>attachment</strong><br />
resonance or resonances that lead <strong>to</strong> dissociation of CS. Each of <strong>the</strong> three dissociative<br />
<strong>electron</strong> <strong>attachment</strong> bands observed here appears <strong>to</strong> be cut off at low energy by <strong>the</strong><br />
threshold for formation of <strong>the</strong> ion. Therefore, <strong>the</strong> positions of <strong>the</strong> maxima of <strong>the</strong> <strong>electron</strong><br />
atttachment resonances responsible for dissociation, are not known as <strong>the</strong>y are likely <strong>to</strong><br />
be below <strong>the</strong> <strong>the</strong>rmodynamic thresholds. GAMESS RHF STO-3G calculations of CS,<br />
CS 2 , OCS and CO performed here indicate that <strong>the</strong> lowest unoccupied orbital of each<br />
of <strong>the</strong>se molecules is π ∗ . CO, CS 2 and OCS all show 2 Π shape resonances at between<br />
1 and 2 eV in <strong>electron</strong> scattering measurements [46, 47, 23], and in <strong>the</strong> case of OCS in<br />
<strong>the</strong> dissociative <strong>electron</strong> <strong>attachment</strong> spectrum [34], which can be assigned <strong>to</strong> <strong>electron</strong><br />
<strong>attachment</strong> in<strong>to</strong> <strong>the</strong>se π ∗ orbitals. Therefore, it is expected that <strong>the</strong> lowest lying <strong>electron</strong><br />
<strong>attachment</strong> resonance of CS is 2 Π with <strong>attachment</strong> of <strong>the</strong> free <strong>electron</strong> in<strong>to</strong> <strong>the</strong> lowest<br />
π ∗ orbital.<br />
It is sometimes possible <strong>to</strong> find a linear relationship between <strong>the</strong> calculated<br />
unoccupied molecular orbital energies and <strong>the</strong> experimentally observed positions of<br />
<strong>electron</strong> <strong>attachment</strong> resonances for a family of related molecules [48, 49]. Such linear<br />
relationships can be used <strong>to</strong> predict <strong>the</strong> positions of <strong>electron</strong> <strong>attachment</strong> resonances<br />
from calculated unoccupied molecular orbital energies [50]. Here, for example, <strong>the</strong> <strong>the</strong><br />
lowest 2 Π resonance of CS could be predicted from <strong>the</strong> energy of <strong>the</strong> lowest π ∗ orbital<br />
of CS using a linear relationship between <strong>the</strong> lowest 2 Π resonances and <strong>the</strong> lowest<br />
π ∗ unoccupied orbitals of CS 2 , OCS and CO. There is not, however, a simple linear<br />
relationship between <strong>the</strong> energies of <strong>the</strong> lowest 2 Π resonances and π ∗ orbital energies<br />
calculated with GAMESS of CO, CS 2 and OCS. A sensible linear relationship may not<br />
even be found with only CS 2 and OCS. Thus, it has not been possible here <strong>to</strong> predict<br />
<strong>the</strong> energy of <strong>the</strong> first 2 Π resonance of CS. Calculations of <strong>the</strong> integral elastic scattering<br />
cross sections for <strong>electron</strong> collisions with CS indicate <strong>the</strong> presence of broad 2 Π and<br />
2 ∆ resonances around 7 eV [16]. These resonances could possibly play a role in <strong>the</strong><br />
<strong>electron</strong> <strong>attachment</strong> observed here, but it is expected <strong>to</strong> be very unlikely that <strong>the</strong> first<br />
2 Π resonance of CS would be as high as 7 eV. The lowest 2 Π is more likely <strong>to</strong> be in <strong>the</strong><br />
range of 0 <strong>to</strong> 3 eV given that those of CS 2 , OCS and CO are between 1 and 2 eV. It<br />
may be that some of <strong>the</strong> dissociative <strong>electron</strong> <strong>attachment</strong> observed here above 5 eV is
<strong>Dissociative</strong> <strong>electron</strong> <strong>attachment</strong> <strong>to</strong> CS 18<br />
due <strong>to</strong> <strong>the</strong> high energy tail of <strong>the</strong> first resonance, but without fur<strong>the</strong>r <strong>the</strong>oretical input<br />
it is not possible <strong>to</strong> comment fur<strong>the</strong>r.<br />
The anion CS − is iso<strong>electron</strong>ic <strong>to</strong> <strong>the</strong> radical NS. NS has a 2 Π ground state with an<br />
<strong>electron</strong>ic configuration of 7σ 2 2π 4 3π 1 outside a core of 1σ 2 2σ 2 3σ 2 4σ 2 5σ 2 6σ 2 1π 4 [51]. The<br />
NS ground state corresponds <strong>to</strong> <strong>the</strong> lowest expected 2 Π shape resonance of CS where <strong>the</strong><br />
extra <strong>electron</strong> is placed in <strong>the</strong> lowest π ∗ orbital of <strong>the</strong> ground state CS molecule, which<br />
has <strong>the</strong> outer <strong>electron</strong>ic configuration 7σ 2 2π 4 . All <strong>the</strong> <strong>electron</strong>ically excited states of NS<br />
from a 4 Π <strong>to</strong> J 2 Σ + at 7.0 eV above <strong>the</strong> ground state have <strong>the</strong> <strong>electron</strong>ic configuration<br />
7σ 2 2π 3 3π 2 or 7σ 1 2π 4 3π 2 , except for <strong>the</strong> Rydberg states [51]. Therefore, it is expected<br />
that all <strong>the</strong> equivalent higher resonance states of CS − are ‘core excited’ where an <strong>electron</strong><br />
from <strong>the</strong> 7σ 2 2π 4 ‘core’ and <strong>the</strong> extra attaching <strong>electron</strong> are placed in <strong>the</strong> π ∗ orbital .<br />
There are, of course, no Rydberg states of negative ions. Dipole bound anion states are<br />
<strong>the</strong> nearest equivalents <strong>to</strong> Rydberg states, but <strong>the</strong> dipole moment of ground state CS,<br />
1.96 Debye [52], is <strong>to</strong>o low <strong>to</strong> support <strong>the</strong>m [53].<br />
In <strong>the</strong> case of CO, angular and energetically resolved measurements of <strong>the</strong> O −<br />
fragments led <strong>to</strong> <strong>the</strong> conclusion that <strong>electron</strong> <strong>attachment</strong> responsible for <strong>the</strong> two peaks<br />
above 9.63 and 10.88 eV proceeds under formation of 2 Π excited states of CO − [42, 45].<br />
The <strong>electron</strong>ic states of <strong>the</strong> NO molecule, which is iso<strong>electron</strong>ic <strong>to</strong> CO − , are very similar<br />
<strong>to</strong> those of NS. Again <strong>the</strong> ground state of NO corresponds <strong>to</strong> <strong>the</strong> 2 Π shape resonance of<br />
CO − at low energy. It has been suggested that excited 2 Π states of NO may correspond<br />
<strong>to</strong> <strong>the</strong> negative ion resonances that lead <strong>to</strong> dissociative <strong>electron</strong> <strong>attachment</strong>; again <strong>the</strong>se<br />
excited states would correspond <strong>to</strong> ‘core excited’ negative ion states [42, 45].<br />
4. Conclusions<br />
<strong>Dissociative</strong> <strong>electron</strong> <strong>attachment</strong> <strong>to</strong> <strong>the</strong> CS <strong>unstable</strong> molecule produced in a microwave<br />
discharge has been investigated. Three dissociative <strong>electron</strong> <strong>attachment</strong> bands of CS<br />
have been observed; formation of S − at 5.43 eV, C − at ∼ 6.40 eV and S − at ∼ 6.70<br />
eV. The fragments are all produced in <strong>the</strong>ir ground states except at 6.70 eV <strong>the</strong> <strong>carbon</strong><br />
a<strong>to</strong>m is excited and <strong>the</strong> products are S − + C ( 1 D). All three of <strong>the</strong>se bands appear<br />
at <strong>the</strong>ir <strong>the</strong>rmodynamic thresholds. Absolute cross sections for <strong>the</strong>se bands have been<br />
estimated and are shown in Table 1.<br />
<strong>Dissociative</strong> <strong>electron</strong> <strong>attachment</strong> <strong>to</strong> CS is remarkably similar <strong>to</strong> dissociative <strong>electron</strong><br />
<strong>attachment</strong> <strong>to</strong> CO, <strong>carbon</strong> monoxide, which is valence-iso<strong>electron</strong>ic. The identity of <strong>the</strong><br />
<strong>electron</strong> <strong>attachment</strong> resonances which enable dissociative <strong>electron</strong> <strong>attachment</strong> is not<br />
clear. Consideration of <strong>the</strong> NS radical, which is iso<strong>electron</strong>ic <strong>to</strong> <strong>the</strong> CS − anion, suggests<br />
that <strong>the</strong> resonances observed are ‘core excited’ where <strong>the</strong> free <strong>electron</strong> excites one of <strong>the</strong><br />
valence <strong>electron</strong>s as it attaches <strong>to</strong> <strong>the</strong> molecule. Theoretical calculations of potential<br />
energy curves for CS − resonances, including core excited resonances, are very desirable <strong>to</strong><br />
aid in <strong>the</strong> understanding of <strong>the</strong> molecular dynamics. Fur<strong>the</strong>rmore, parallel calculations<br />
of CO and CS might reveal why C − is observed so weakly from CO, but much more<br />
strongly from CS.
<strong>Dissociative</strong> <strong>electron</strong> <strong>attachment</strong> <strong>to</strong> CS 19<br />
The previously observed formation of S − in dissociative <strong>electron</strong> <strong>attachment</strong> <strong>to</strong> S 2 O<br />
at 1.8 eV is confirmed here and formation of O − at 5.4 eV is tentatively assigned <strong>to</strong><br />
S 2 O. The ionization energies of <strong>the</strong> S 2 F radical, 10.3 ± 0.4 eV, and C 3 S 2 , 9.4 ± 0.3,<br />
have been measured, apparently for <strong>the</strong> first time.<br />
Acknowledgments<br />
The authors would like <strong>to</strong> thank John Dyke for his encouragement and advice concerning<br />
<strong>the</strong> generation of CS. KG would like <strong>to</strong> thank <strong>the</strong> European Social Fund (ESF) for<br />
providing a PhD studentship. The authors also gratefully acknowledge financial support<br />
from <strong>the</strong> EPSRC (GR/N04362/2) and Royal Society (RSRG 21245).<br />
References<br />
[1] D. B. Graves, M. J. Kushner, J. W. Gallagher, A. Garscadden, G. S. Oehrlein, and A. V. Phelps.<br />
Database Needs for Modeling and Simulation of Plasma Processing. Washing<strong>to</strong>n, DC: National<br />
Research Council, National Academy Press, 1996.<br />
[2] P. Li, Y. L. Tan, and W. Y. Fan. Chem. Phys., 302:171, 2004.<br />
[3] J. R. Pe<strong>the</strong>rbridge, P. W. May, G. M. Fuge, K. N. Rosser, and M. N. Ashfold. Diamond and<br />
Related Materials, 11:301, 2002.<br />
[4] S. Maurmann, V. Gavrilenko, H.-J. Kunze, and E. Oks. J. Phys. D: Appl. Phys., 29:1525, 1996.<br />
[5] N. D. Sze and M. K. W. Ko. Geophys. Res. Lett., 8:765, 1981.<br />
[6] P. J. Crutzen. Geophys. Res. Lett., 3:73, 1976.<br />
[7] R. P. Turco, R. C. Whitten, O. B. Toon, J. B. Pollack, and P. Hamill. Nature, 283:283, 1980.<br />
[8] N. M. Deutscher, N. B. Jones, D. W. T. Griffith, S. W. Wood, and F. J. Murcray. Atmos. Chem.<br />
Phys. Discuss., 6:1619, 2006.<br />
[9] J. P. Williams and L. Blitz. Astrophys. J., 494:657, 1998.<br />
[10] P. M. Woods, F. L. Schöier, L.-Å. Nyman, and H. Olofsson. Astronomy and Astrophysics, 402:617,<br />
2003.<br />
[11] P. M. Woods and L.-Å. Nyman. H2co and cs in planetary nebulae. In A. J. Markwick-Kemper,<br />
edi<strong>to</strong>r, Astrochemistry: Recent Succes and Current Challanges, page 1. Poster Book IAU<br />
Symposium No. 231, 2005.<br />
[12] N. Biver, D. Bockelée-Morvan, P. Colom, J. Crovisier, B. Germain, E. Lellouch, J. K. Davies,<br />
W. R. F. Dent, R. Moreno, G. Paubert, J. Wink, D. Despois, D. C. Lis, D. Mehringer,<br />
D. Benford, M. Gardner, T. G. Phillips, M. Gunnarsson, H. Rickman, A. Winnberg, P. Bergman,<br />
L. E. B. Johannson, and H. Rauer. Earth, Moon and Planets, 78:5, 1997.<br />
[13] S. Martín, J. Martín-Pintado, R. Mauersberger, C. Henkel, and S. García-Burillo. Astrophys. J.,<br />
620:210, 2005.<br />
[14] R. I. Kaiser, C. Ochsenfeld, M. Head-Gordon, and Y. T. Lee. Science, 279:1181, 1998.<br />
[15] R. S. Freund, R. C. Wetzel, and R. J. Shul. Phys. Rev. A, 41:5861, 1990.<br />
[16] A. M. C. Sobrinho and M.-T. Lee. Int. J. Quantum Chem., 103:703, 2005.<br />
[17] Y.-K. Kim, W. Hwang, N. M. Weinberger, M. A. Ali, and M. E. Rudd. J. Chem. Phys., 106:1026,<br />
1997.<br />
[18] available on http://physics.nist.gov/PhysRefData/Ionization/. 2006.<br />
[19] T. A. Field, A. E. Slattery, D. J. Adams, and D. D. Morrison. J. Phys. B: At. Mol. Opt. Phys.,<br />
38:255, 2005.<br />
[20] A. Stama<strong>to</strong>vic and G.J. Schulz. Rev. Sci. Instrum., 41:423, 1970.<br />
[21] J. P. Ziesel, G. J. Schulz, and J. Milhaud. J. Chem. Phys., 62:1936, 1975.<br />
[22] E. Krishnakumar and K. Nagesha. J. Phys. B: At. Mol. Opt. Phys., 25:1645, 1992.
<strong>Dissociative</strong> <strong>electron</strong> <strong>attachment</strong> <strong>to</strong> CS 20<br />
[23] R. Dressler, M. Allan, and M. Tronc. J. Phys. B: At. Mol. Phys., 20:393, 1987.<br />
[24] S. A. Rangwala, S. V. K. Kumar, and E. Krishnakumar. Phys. Rev. A, 64:012707, 2001.<br />
[25] P.J. Linstrom and W.G. Mallard, edi<strong>to</strong>rs. NIST Chemistry WebBook, NIST Standard Reference<br />
Database Number 69. National Institute of Standards and Technology, Gai<strong>the</strong>rsburg MD, 20899<br />
(http://webbook.nist.gov)., 2005.<br />
[26] E. K. Moltzen, K. J. Klabunde, and A. Senning. Chem. Rev., 88:391, 1988.<br />
[27] M.W.Schmidt, K. K. Baldridge, J. A. Boatz, S. T. Elbert, M. S. Gordon, S. Koseki J. H. Jensen,<br />
N. Matsunaga, K. A. Nguyen, S. J. Su, T. L. Windus, M. Dupuis, and J. A. Montgomery. J.<br />
Comput. Chem., 14:1347, 1993.<br />
[28] M. S. Gordon and M. W. Schmidt. Advances in <strong>electron</strong>ic structure <strong>the</strong>ory: GAMESS a decade<br />
later. Elsevier, Amsterdam, 2005.<br />
[29] see http://www.msg.ameslab.gov/GAMESS/GAMESS.html.<br />
[30] T. Koopmans. Physica 1, 1:104, 1934.<br />
[31] Y. Xie and H. F. Schaefer III. J. Mol. Struc. (Theochem.), 460:117, 1999.<br />
[32] O. V. Gritsenko and E. J. Baerends. J. Chem. Phys., 120:8364, 2004.<br />
[33] Y. Le Coat, L. Bouby, J. P. Guillotin, and J. P. Ziesel. J. Phys. B: At. Mol. Opt. Phys., 29:545,<br />
1996.<br />
[34] I. Iga and S. K. Srivastava. J. Mol. Struct. (Theochem.), 335:31, 1995.<br />
[35] C. E. Mel<strong>to</strong>n. J. Chem. Phys., 57:4218, 1972.<br />
[36] P. Coppens, J. C. Reynard, and J. Drowart. J. Chem. Soc. Faraday Trans. 2, 75:292, 1979.<br />
[37] Y. H. Le Teuff, T. J. Millar, and A. J. Markwick. Astron. Astrophys. Suppl. Ser., 146:157, 2000.<br />
[38] B. J. McBride, M. J. Zehe, and S. Gordon. NASA Glenn Coefficients for Calculating<br />
Thermodynamic Properties of Individual Species. NASA report, 2002.<br />
[39] C. E. Moore. Tables of spectra of hydrogen, <strong>carbon</strong>, nitrogen, and oxygen a<strong>to</strong>ms and ions. In<br />
J. W. Gallagher, edi<strong>to</strong>r, CRC Handbook of Chemistry and Physics, page 336. CRC Press, Boca<br />
Ra<strong>to</strong>n, FL, 76 th edition, 1993.<br />
[40] W. C. Martin, R. Zalubas, and A. Musgrove. J. Phys. Chem. Ref. Data, 19:821, 1990.<br />
[41] T. Andersen, H. K. Haugen, and H. Ho<strong>to</strong>p. J. Phys. Chem. Ref. Data, 28:1511, 1999.<br />
[42] R. I. Hall, I. Cǎdež, C. Schermann, and M. Tronc. Phys. Rev. A, 15:599, 1977.<br />
[43] G. Denifl, D. Muigg, A. Stama<strong>to</strong>vic, and T. D. Mrk. Chem. Phys. Lett., 288:105, 1998.<br />
[44] A. Stama<strong>to</strong>vic and G.J. Schulz. J. Chem. Phys., 53:2663, 1970.<br />
[45] L.G. Chris<strong>to</strong>phorou, D. L. McCorkle, and A.A. Chris<strong>to</strong>doulides. Electron <strong>attachment</strong> processes.<br />
In L. G. Chris<strong>to</strong>phorou, edi<strong>to</strong>r, Electron-Molecule Interactions and <strong>the</strong>ir Applications Vol. 1.<br />
Academic Press, Inc., 1984.<br />
[46] C. Szmytkowski and M. Zubek. Chem. Phys. Lett., 57:105, 1978.<br />
[47] S. J. Buckman and B. Lohmann. Phys. Rev. A, 34:1561, 1986.<br />
[48] S. W. Staley and J. T. Strnad. J. Phys. Chem., 98:116, 1994.<br />
[49] K. Afla<strong>to</strong>oni, G. A. Gallup, and P. D. Burrow. J. Phys. Chem. A, 104:7359, 2000.<br />
[50] K. Graupner, T. L. Merrigan, T. A. Field, T. G. A. Youngs, and P. C. Marr. New J. Phys., 8:117,<br />
2006.<br />
[51] G. C. Lie, S. D. Peyerimhoff, and R. J. Buenker. J. Chem. Phys., 82:2672, 1985.<br />
[52] G. Winnewisser and R. L. Cook. J. Mol. Spectrosc., 28:266, 1968.<br />
[53] J. Kalcher. Croatia Chemica Acta, 74:903, 2001.