LF-8147 - Marine Performance from Salt Fog - Q-Lab
LF-8147 - Marine Performance from Salt Fog - Q-Lab
LF-8147 - Marine Performance from Salt Fog - Q-Lab

Create successful ePaper yourself
Turn your PDF publications into a flip-book with our unique Google optimized e-Paper software.
. Reprinted with permission <strong>from</strong> the Journal of Protective Coatings and Linings (JPCL) Pittsburgh, PA.<br />
Predic tin! Exterior <strong>Marine</strong> <strong>Performance</strong> of<br />
CoatingsTrom <strong>Salt</strong> <strong>Fog</strong>: Two Types of Errors<br />
by Bernard R. Appleman,<br />
Steel Structures Painting Council<br />
his article presents a brief description<br />
of the various approaches<br />
to determine longterm<br />
durability of coatings.<br />
Following the introduction,<br />
some data <strong>from</strong> SSPC's <strong>Performance</strong><br />
of Alternate Coatings in the Environment<br />
(PACE) program are presented, comparing<br />
salt fog testing and exterior marine<br />
performance for several industrial maintenance<br />
coating systems. The analysis focuses<br />
on 2 types of errors that can occur when<br />
relying on salt fog: accepting poor coatings<br />
and rejecting good coatings. An alternate<br />
scheme for early prediction of performance<br />
is presented.<br />
Determining Long-Term<br />
Coating <strong>Performance</strong><br />
There are several approaches for determining<br />
long-term durability, i.e., how well a<br />
coating performs in a long-term atmospheric<br />
exterior test.<br />
Exterior Exposures<br />
First, one can actually perform long-term<br />
testing by placing test panels on exposure in<br />
aggressive areas or by applying coatings to<br />
chemical storage tanks, bridges, or other facilities.<br />
Exterior testing is considered the<br />
most reliable means of determining longterm<br />
performance, although there are<br />
obvious disadvantages to the method,<br />
especially the time required to make the appropriate<br />
judgments.<br />
Accelerated Approach<br />
The second approach is to accelerate the<br />
degradation, commonly done with salt fog<br />
cabinets, humidity chambers, and ultraviolet<br />
light-condensation cabinets. Here, degradation<br />
(e.g., rusting, scribe undercutting, or<br />
blistering) will occur in a shorter time period,<br />
so in a matter of approximately 1,000 hours<br />
instead of 5 years, one can observe degradation.<br />
An important concern is whether or not<br />
that degradation reflects the degradation produced<br />
in an exterior environment.<br />
Early Detection of Degradation<br />
Another approach is to detect the degradation<br />
early, rather than waiting for conventional<br />
means of degradation such as rusting and<br />
blistering. A prime example is using electrochemical<br />
means for early detection of degradation.<br />
There are other types of tests including<br />
water permeability or other characteristics<br />
for detecting early degradation.<br />
Early detection of degradation can also<br />
be achieved with quantitative visual evaluation<br />
of rusting or blistering. This technique<br />
examines the surface in detail rather than<br />
comparing the surface to an ASTM standard.<br />
In addition, these 3 basic approaches,<br />
exterior exposures, accelerated degradation,<br />
and early detection of degradation, can also<br />
be combined.<br />
Time Frames<br />
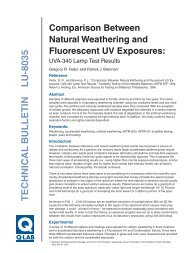
What is the time frame for obtaining this information?<br />
The main reason long-term degradation<br />
is not always used is the length of time<br />
required for results. In exterior exposure, the<br />
time frame for degradation is in the tens of<br />
thousands of hours (Fig. 1). (Ten thousand<br />
134 / Iournal of protective Coatings 6 Linings
Predicting Coating <strong>Performance</strong><br />
Degradation<br />
0<br />
2 -<br />
4 -<br />
6 -<br />
8 -<br />
10 I I I I<br />
1 10 100 1,000 10,000 100,000<br />
Hours<br />
Fig. 1<br />
Typical time frames for degradation<br />
Typical degradation rate based on rusting and undercutting<br />
in exterior<br />
A Typical degradation rate based on rusting and undercutting in<br />
accelerated testing (e.g., salt fog) or early indicator<br />
(e.g., electrochemical response) in exterior<br />
Typical degradation rate based on early indicator in accelerated test<br />
Degradation rate for new experimental test procedure (sought<br />
in future)<br />
Note:<br />
1 month = 30 days = 720 hours<br />
1 year = 8,760 hours<br />
hours is a little over 1 year.) Degradation typically<br />
begins to occur between 30,000 and<br />
50,000 hours (3 to 5 years). One order of<br />
magnitude less time (on the order of 1,000-<br />
2,000 hours) is what typically occurs when<br />
using an accelerated test, e.g., humidity testing,<br />
salt fog testing.<br />
By using accelerated testing, one<br />
is able to reduce the time frame by about 1<br />
order of magnitude. Of course, the question<br />
of the validity of the evaluation must<br />
still be addressed. Another way to reduce<br />
the magnitude is by using early degradation<br />
of the exterior exposures. Rather than<br />
looking at parameters like rust rating and<br />
blistering, which may not be evident for<br />
3 to 5 years, there are perhaps some parameters<br />
(such as electrochemical response) that<br />
will be manifest in 1,000 to 3,000 hours of<br />
exterior exposure (a matter of months<br />
rather than years).<br />
These are 2 ways to shorten the time<br />
frame. It may be possible to combine these 2<br />
approaches, selecting an accelerated test that<br />
reduces the time by 1 order of magnitude and<br />
selecting a means of evaluating degradation<br />
that reduces this time by a second order of<br />
magnitude. That would result in a range of<br />
hundreds of hours. This would be a major advance<br />
if one could get valid information about<br />
coating performance in that time frame.<br />
Going even further, to the range of 10-50<br />
hours, would be a very desirable goal, but currently<br />
there are few prospects for achieving<br />
that in a practical test.<br />
The coatings industry is still struggling<br />
with the first order of magnitude, to get valid<br />
data within 1,000-2,000 hours. Perhaps as a<br />
long-term goal, we can aspire to obtain valid<br />
performance data in the 10- to 50-hour range.<br />
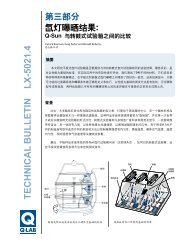
Time to Failure versus Average Rating<br />
The performance of coatings can be assessed<br />
and com~ared in several wavs. Su~~ose<br />
one Fig. 3<br />
has a number of coating systems ;Ad wants to Five replicates showing<br />
know how coating A compares to coating B.<br />
variable undercutting<br />
(three-coat polyamide at<br />
approximately 4 years)<br />
October 1992 / 135
Predicting Coating <strong>Performance</strong><br />
Fig. 2<br />
Alkyd in marine, 5 replicates;<br />
average of 5 panels<br />
Rust rating<br />
--[7-- HLI i<br />
1 12 24 36 48<br />
Months<br />
Ratings and Rankings of Acrylic<br />
lable 1 Coatings over SSPC-SP 2<br />
Time to Failurea<br />
~anking~J<br />
<strong>Salt</strong> <strong>Fog</strong> Kure<br />
Coating Hours Months <strong>Salt</strong> <strong>Fog</strong> Kure<br />
C-8 400 2 5 11<br />
C-11 1,070 130+ 2 3<br />
C-19 310 130+ 8 2<br />
C-23 350 92 7 6<br />
C-27 200 2 9 10<br />
OTime for panels to reach a rust rating of 7 (SSPC-VIS 2IASTMD 610)<br />
b1 is best, I1 is worst<br />
times to failure were equiualent, other factors were used, including<br />
time to reach 8 and 9 rust ratings and time to failure by scribe<br />
undercutting<br />
TWO common approaches are the time to failure<br />
and the rating after a given time, for example,<br />
36 months.1<br />
Time to failure is considered the superior<br />
method. Figure 2 shows rust ratings of an<br />
alkyd coating exposed in a marine environment.<br />
Five replicates were used. The data<br />
show quite a spread in performance among<br />
the replicates, which is typical. (See Fig. 3 of<br />
scribe undercutting of 5 replicate epoxy coating<br />
system.) The worst is the one with the triangle;<br />
the best one was perfect (10 rust rating)<br />
for the entire 54 months of the<br />
experiment, with the others ranging in between.<br />
The dashed line with the triangle is<br />
the average (the mean) of the five replicates.<br />
These data help illustrate the difference<br />
between the average rating and the time to<br />
failure. As illustrated by the dotted horizontal<br />
line, when a failure is defined as 7 rust rating,<br />
which is very typical, the average time to failure<br />
is shown to be about 48 inonths. It is seen<br />
that the worst of the individual panels failed<br />
at about 28 months. This panel represented 1<br />
out of 5 specimens, or 20 percent of the samples.<br />
If 20 percent of the surface fails within<br />
28 months, that would be more significant<br />
than knowing that the average rating after 36<br />
months was 8, or the average rating after 48<br />
months was 6.<br />
Information is needed on when to repaint<br />
the structure, not the "average" condition.<br />
This illustrates why SSPC typically uses<br />
time to failure as a measure of performance<br />
and why we think it is a more valuable parameter<br />
than the average rating after a given time<br />
period.<br />
136 /Journal of Protective Coatings 8 Linings
Predicting Coating <strong>Performance</strong><br />
<strong>Salt</strong> <strong>Fog</strong> (hrs)<br />
4000<br />
3000 -<br />
2000 -<br />
nA<br />
nn<br />
q<br />
q q q<br />
on q q<br />
q<br />
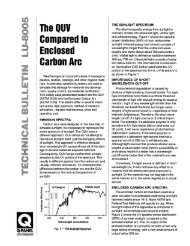
Fig. 4<br />
PACE, Branch A, leadand<br />
chromate-free oiltalkyd. Each point<br />
corresponds to a specific coating system. (E.g., for<br />
coating A, rust failure in salt fog occurred after<br />
3,700 hours, and rust failure at marine exposure<br />
occurred after 36 months.)<br />
0 , 1 1 1 1 1 1 1 1 1 1<br />
0 24 48 72 96 120 144<br />
<strong>Marine</strong> Exposure (months)<br />
<strong>Salt</strong> <strong>Fog</strong> (hrs) Fig. 5<br />
1200<br />
PACE, Branch C, acrylic over SSPC-SP 2. Each point<br />
corresponds to a specific coating system.<br />
1000-<br />
800 -<br />
600 -<br />
400 -7 q<br />
200 -0<br />
-<br />
q<br />
0<br />
q<br />
I I I , I 1 1 I I I I<br />
0 24 48 72 96 120 144<br />
<strong>Marine</strong> Exposure (months)<br />
q<br />
q<br />
q<br />
q<br />
q<br />
Comparing <strong>Salt</strong> <strong>Fog</strong> and<br />
Exterior <strong>Performance</strong><br />
The PACE program was completed in 1989,<br />
having started in 1976.2 SSPC has produced a<br />
series of reports; the present data are derived<br />
<strong>from</strong> SSPC Reports 79-01 and 89-03.213 The<br />
study included 8 branches, with each branch<br />
a complete experiment in itself.3~4~5<br />
Linear correlation of Alkyd Coatings over<br />
Blast-Cleaned Steel<br />
It is of interest to examine correlations between<br />
the salt fog testing and the exterior exposure<br />
for selected groups of coatings.<br />
The first group is a series of 20 leadand<br />
chromate-free oil and alkyd coating systems<br />
applied over SSPC-SP 10. Coated panels<br />
were exposed in salt fog (ASTM B 117) for<br />
8,000 hours and at the LaQue Center marine<br />
site at Kure Beach, NC (250-meter lot) for up<br />
to 12 years.<br />
The coatings were evaluated for<br />
rusting and blistering in the salt spray and<br />
for rusting and scribe undercutting at the<br />
marine site. The parameter of interest here<br />
is the time for coatings failure by rusting<br />
(i.e., the time until the coating system deteriorates<br />
to a rust rating of 7 per SSPC-VIS 2 or<br />
ASTM D 610).<br />
Figure 4 is a scattergram (i.e., a corre-<br />
October 1992 / 13 7
Predicting Coating <strong>Performance</strong><br />
Rejecting Good<br />
Coatings<br />
Water-Borne Coatings<br />
Table 2 Over SSPC-SP 2<br />
<strong>Salt</strong> <strong>Fog</strong> Reject<br />
Kure Lifetime<br />
(400 hours) (Months)<br />
Accepting Poor<br />
Coatings<br />
Water-he Coatings<br />
1 Table 3 Over SSPC-SP 2<br />
Kure Reject<br />
<strong>Salt</strong> <strong>Fog</strong> Lifetime<br />
(
Predicting Coating <strong>Performance</strong><br />
Rejecting Good<br />
Coatings<br />
Water-Borne Coatings<br />
Table 4 Ouer SSPC-SP 10<br />
<strong>Salt</strong> <strong>Fog</strong> Reject<br />
Kure Lifetime<br />
(
Predicting Coating <strong>Performance</strong><br />
I<br />
lable 6<br />
Comparison of Kure Rankings for<br />
Full and Reduced Exposure Time<br />
Full Exposure Reduced Exposure Rust Failure Correlation<br />
Time (Months) Time (Months) criteriona Coefficient (Rs)<br />
130 60 7 0.98b<br />
a~oatings rated and ranked based on number of months until rust rating of<br />
7(8) or less (SSPC-VIS 2IASTM D 610) was reached. All coatings that<br />
remained at 7(8) or greater for the specified exposure time were ranked based<br />
on final rust ratings.<br />
b~his represents the Spearman rank correlation between Set A (35 water-borne<br />
coatings ranked at 130 months at marine site) us. Set B (same 35 water-borne<br />
coatings ranked at 60 months at some marine site).<br />
C<strong>Salt</strong> fog test<br />
salt fog cabinet test. Another (C-23) lasted<br />
92 months (almost 8 years) in exterior exposure<br />
yet would have been rejected based on<br />
the salt fog test.<br />
In summary, of the 9 coatings rejected<br />
in salt fog, 3 were excellent, 2 fair, and 4 poor.<br />
So the salt fog resulted in substantial error of<br />
the first type, rejecting good coatings, as 3 excellent<br />
coatings would have been rejected if<br />
salt fog had been used as a screening test and<br />
the exterior exposures had not been run.<br />
(Note: Of the 16 coatings rated excellent in<br />
salt fog (greater than 1,800 hours), the qualitative<br />
ratings at Kure Beach were 4 excellent,<br />
4 good, 3 fair, and 5 poor.)<br />
How about accepting poor coatings?<br />
The left side of Table 3 lists coatings that<br />
would have been rejected based on the Kure<br />
Beach long-term exposures using a criterion<br />
of rust rating of 7 within 36 months. In other<br />
words, if these coatings failed in less than 36<br />
months at Kure, we would reiect them as not<br />
being suitable exterior coatings. The second<br />
column shows the salt fog lifetimes of those<br />
11 coatings. The first was 1,070 hours, 2 were<br />
at 1,840, and 3 were at 2,400 hours. For application<br />
over hand-cleaned steel, any coating<br />
lasting more than about 1,500 hours is considered<br />
excellent in salt fog. Five of these 11<br />
coatings would have been rejected based on<br />
long-term exterior exposure.<br />
Thus, 5 of these coatings, though considered<br />
excellent in salt fog (lifetime of more<br />
than 1,800 hours), failed at Kure Beach. Of<br />
the other 6 coatings that failed at Kure Beach,<br />
2 were good in salt fog (more than 1,000<br />
hours), 1 fair (more than 500 hours), and 3<br />
poor (less than or equal to 500 hours). Looking<br />
at it the other way, salt fog testing would<br />
have accepted at least 5, possibly 7 coatings<br />
that were ultimately rejected based on their<br />
Kure Beach exposure.<br />
Therefore, the salt fog test accepted a<br />
large number of poor coatings and rejected a<br />
large number of good coatings. So even<br />
though some correlation was observed, the<br />
salt fog was found not to be a suitable screening<br />
test for exterior exposure at Kure Beach.<br />
Kure Beach was chosen in this analysis rather<br />
than an industrial environment because one<br />
would think that if there were 1 exposure<br />
site that salt fog would be able to reproduce,<br />
it would be the marine exposure. Yet we<br />
see that this is not the case with the vast<br />
majority of the data.<br />
The next example is of water-borne<br />
coatings over blast-cleaned steel. Table 4<br />
shows the extent of rejection of good<br />
coatings. Six coatings were rejected based<br />
on salt fog data. Of these 6 coatings, 5 did<br />
extremely well at Kure Beach, 4 of them<br />
lasting beyond the duration of the 130-<br />
month experiment.<br />
Table 5 shows that of the 5 coatings<br />
rejected based on exterior exposure results,<br />
salt fog testing would have accepted 3. The<br />
validity of results of salt fog over blastcleaned<br />
steel (Tables 4 and 5) is even poorer<br />
than over hand-cleaned steel (Tables 2 and 3).<br />
Thus, once again, the salt fog is shown to be'<br />
very unsuitable for predicting the performance<br />
of these coatings in an exterior marine<br />
environment.<br />
140 / Journal of Protective Coatings & Linings
Predicting Coating <strong>Performance</strong><br />
Predicting <strong>from</strong><br />
Data Based on<br />
Exterior Exposures<br />
General Approaches<br />
Because of poor correlation and the likelihood<br />
of major errors with salt fog and other accelerated<br />
tests, it is often preferable to evaluate<br />
coatings based on exterior testing. There are<br />
several means by which short-term answers<br />
can be derived <strong>from</strong> exterior exposures. These<br />
include the following.<br />
Prediction <strong>from</strong> early data (Rather than<br />
running data out for 5 to 10 years, we can<br />
look at that data at 1,2, or 3 years and make<br />
some prediction.)<br />
Alternate failure criteria (For example,<br />
utilize a rust rating of 8 rather than 7 as a<br />
failure criterion.)<br />
Enhanced evaluation procedures (Obtain a<br />
better, clearer, or more detailed picture of<br />
what the panel looks like through visual, mechanical,<br />
physical, or electrochemical<br />
approaches.)<br />
Increased sample size (replicates) (SSPC<br />
has recently issued a report on a study using<br />
sample sizes of 20 and 30, showing how the<br />
size of samples helps provide earlier information<br />
on failures.)6<br />
Accelerate exterior environment (For example,<br />
spray with acid or salt water, use reflective<br />
mirrors to enhance the amount of sunlight,<br />
or place samples in a black box that<br />
heats up the panels.)<br />
%o of these approaches will be illustrated<br />
below.<br />
Predictions <strong>from</strong> Early Field Data<br />
Suppose instead of running the experiment<br />
for 130 months at Kure Beach, we terminate<br />
it at 60 months (5 years) and try to make predictions.<br />
How closely would the predictions at<br />
60 months match the results at 130 months?<br />
Table 6 shows that the Spearman correlation<br />
(R,) between these 2 rankings is 0.93, which<br />
is quite good. After 48 months, the rank correlation<br />
dropped to 0.89, at 36 months to<br />
0.85, and at 24 months to 0.73. So the shorter<br />
the time period, the poorer the ability to predict<br />
the ranking of the coatings at 130<br />
months. Yet this is still quite a bit better than<br />
the salt fog. Even at 2 years' exterior exposure,<br />
we could make a better prediction of<br />
Distinguishing Poor VS. Good,<br />
Rust Failure Criterion of 7<br />
PACE C-Water-Borne Over<br />
Table 7 SSPC-SP 2, Exterior <strong>Marine</strong><br />
Nos. of Coatings in Category<br />
Time Failure<br />
(Months) Criterion P* F G E<br />
* P = Poor, F = Fair, G = Good, E = Excellent<br />
Distinguishing Poor VS. Good,<br />
Rust Failure Criterion of 8<br />
PACE C-Water-Borne Over<br />
Table 8 SSPC-SP 2, Exterior <strong>Marine</strong><br />
Nos. of Coatings in Category<br />
Time Failure<br />
(Months) Criterion P* F G E<br />
130 8 9 9 7 10<br />
48 8 9 9 17 -<br />
36 8 9 6 30 -<br />
24 8 9 - 26 -<br />
* P = Poor, F = Fair, G = Good, E = Excellent<br />
long-term exposure than if we had 1,000 or<br />
2,000 hours in salt fog.<br />
It is important to determine the validity<br />
of this approach in distinguishing poor <strong>from</strong><br />
good coatings. Table 7 presents data on how<br />
reducing the exposure time affects the ability<br />
to distinguish among different levels of coating<br />
performance. Based on 130 months' data,<br />
11 coatings were found to be poor performers;<br />
I<br />
October 1992 / 141
Predicting Coating <strong>Performance</strong><br />
New Developments<br />
in Cyclic<br />
Accelerated<br />
Testing<br />
by Bernard R. Appleman, SSPC<br />
Since the JPCL article of November 1989, "Cyclic<br />
Accelerated Testing: The Prospects for Improved<br />
Coating <strong>Performance</strong> Evaluation," there has been<br />
increased interest in using cyclic tests for accelerated<br />
degradation of corrosion protective coatings.<br />
Recent activities focusing on cyclic testing are described<br />
below.<br />
In May 1991, SSPC, in conjunction with<br />
the Naval Civil Engineering <strong>Lab</strong>oratory (NCEL),<br />
organized a workshop on accelerated testing of<br />
coatings. Work groups were established to address<br />
3 critical areas: accelerated testing, statistical<br />
analysis and evaluation, and electrochemical<br />
testing. The work group on accelerated testing focused<br />
on the value and validity of cyclic testing<br />
versus conventional testing such as salt fog.<br />
The workshop recommended, as an urgent<br />
industry need, systematic programs to evaluate<br />
cyclic methods against conventional accelerated<br />
test methods and exterior exposure tests.<br />
Specific objectives are<br />
to determine if cyclic tests provide a reasonable<br />
simulation of exterior exposures,<br />
to identify the principal variations and parameters<br />
of cyclic testing,<br />
to identify the appropriate tests to corroborate<br />
preliminary conclusions of the merits of cyclic<br />
testing, and<br />
to determine the overall value of cyclic accelerated<br />
testing compared to conventional testing<br />
and the needs of the protective coatings industry.<br />
Among the parameters recommended for<br />
study are the following.<br />
Cycle time<br />
Sequence of stresses<br />
Temperature of cabinet solution panel and<br />
control<br />
Source of ultraviolet light<br />
Relative humidity<br />
Repeatability within a cabinet<br />
Reproducibility among cabinets<br />
Electrolyte concentration<br />
Effect of different cycles on different coatings<br />
SSPC and ASTM have taken steps to carry<br />
out some of the recommendations. SSPC has developed<br />
a multi-client test program to compare<br />
various cyclic tests to conventional accelerated<br />
tests as well as to exterior and enhanced exterior<br />
exposure testing. This program is also being<br />
supported by SSPC membership through<br />
general research funding allocations. The program<br />
is designated as APEC (Advances in <strong>Performance</strong><br />
Evaluation of Coatings). It includes the<br />
following tests.<br />
Cycle 1: 2 hours' spray at 30 C (86 F) with<br />
Timmins solution 3.5 percent (NH4)2S04 and<br />
0.25 percent NaC112 hours' forced dry air at 40 C<br />
(104 F)<br />
Cycle 2: 1 week of Cycle 1 followed by 1 week<br />
of another cycle consisting of 4 hours of W radiation<br />
(using W-A bulbs) at 60 C (140 F) and 4<br />
hours of condensation at 40 C (104 F)<br />
Cycle 3: 6 hours' immersion in 5 percent<br />
NaCV6 hours' ambient dry (panels placed on rack<br />
that rotates 60 degrees every 2 hours, for a total<br />
cycle time of 12 hours)<br />
Cycle 4: 6 hours' immersion in 5 percent<br />
NaCV6 hours' exuosure to W-A Iamos<br />
Standard ~ccelerated Test: <strong>Salt</strong> fig in accordance<br />
with ASTM B 117<br />
Standard <strong>Marine</strong>: 250-meter (800-foot) lot at<br />
La Que Corrosion Center, Kure Beach, North<br />
Carolina<br />
Standard Industrial: Pittsburgh, PA<br />
Accelerated Exterior <strong>Marine</strong>: Exterior marine<br />
panels sprayed twice a week with 5 percent NaCl<br />
Accelerated Exterior Industrial: Exterior industrial<br />
panels sprayed twice a day with 3.5 percent<br />
(NH4) SO4 and 0.25 percent NaCl solution<br />
To iate, approximately 20 coatings have<br />
been accepted into the testing program, with<br />
testing initiated in late 1990. Preliminary analysis<br />
has been made of data using Cycle 1 and 40<br />
months' exterior marine. (Forty-month data are<br />
derived <strong>from</strong> the predecessor program, Advances<br />
in Coatings Technology for Steel [ACTS], which<br />
utilized the same control panels as APEC.) On the<br />
basis of scribe undercutting data, Cycle 1 shows<br />
considerably higher correlation with exterior<br />
than does salt spray. These results are still preliminary.<br />
They are based on a limited number of<br />
5 were fair; 4 were good; and 15 were excellent.<br />
After 60 months, the poor and fair coatings<br />
could still be distinguished, but insufficient<br />
time had elapsed to distinguish the<br />
excellent <strong>from</strong> the good coatings. Even down<br />
to 36 months, it was still possible to distinguish<br />
the 11 poor coatings. However, 24<br />
months was apparently too short a time period<br />
to distinguish poor <strong>from</strong> good coatings<br />
based on a failure criterion of 7.<br />
Alternate Failure Criterion<br />
Now let's examine the effect of an alternate<br />
failure criterion, that is, <strong>from</strong> a rust rating of<br />
8 rather than 7. The rust scale in ASTM D 610<br />
is logarithmic, so a rust rating of 8 (0.01 percent<br />
of area rusted) is much more stringent<br />
that a rust rating of 7 (0.3 percent of the<br />
area rusted). Therefore, a coating will reach<br />
an 8 rating before it reaches a 7 rating. So,<br />
if we can use the 8 rating as our failure criterion,<br />
we will observe "failure" in a shorter<br />
time period.<br />
Table 6 shows rank correlation for evaluations<br />
at various time intervals using an 8<br />
failure criterion. The Kure ratings after 60<br />
months vs. those at 130 months result in a<br />
rank correlation of 0.98, almost a perfect 1:l<br />
correspondence. Again, the shorter the rating<br />
period, the poorer the correlation, but even at<br />
24 months, one still gets a reasonably good<br />
rank correlation of 0.8. <strong>Salt</strong> fog at 1,200<br />
hours resulted in a rank correlation of 0.2.<br />
Thus, 1,200 or 2,400 hours' salt fog data give<br />
considerably poorer prediction than 24<br />
months at Kure Beach.<br />
Table 8 shows how the ability to differentiate<br />
among poor, fair, good, and excellent<br />
coatings is influenced by the number of<br />
months of exposure.<br />
If one reduces the exposure time to 18<br />
months (not shown here), major deviations in<br />
rank are observed. 24 months in this particular<br />
approach is the shortest exposure time required<br />
to eliminate the poor coatings.<br />
Comparing Tables 7 and 8 shows that<br />
with a failure criterion of 8, one can reduce<br />
the time for screening poor coatings <strong>from</strong><br />
36 to 24 months. This reduced time frame is<br />
the advantage of using a more stringent failure<br />
criterion. This approach is markedly superior<br />
to salt fog in predicting long-term<br />
field performance.<br />
Conclusions<br />
The statistical techniques of regression correlation<br />
and rank correlation both demonstrated<br />
lack of correspondence between salt fog<br />
and marine exterior exposure. Further, data<br />
were presented demonstrating that salt fog<br />
results in quite a large number of 2 types of<br />
142 / Journal of Protective Coatings b Linings
Predicting Coating <strong>Performance</strong><br />
.<br />
samples (10 paint systems) and have not been which panels must be physically removed <strong>from</strong> an cepted industry test for cyclic testing remains<br />
subjected to a rigorous statistical analysis for existing cabinet and placed in another chamber elusive. One important goal of SSPC and JPCL is<br />
significance. or location. to track and coordinate these various activities,<br />
A task group under ASTM Subcommittee The critical need for improved accelerated and periodically assess their progress.<br />
D1.27 on Accelerated Tests for Paints is drafting 2 testing is confirmed by the number of organizanew<br />
standards for consensus review. The first is tions that have had or are planning technical seson<br />
cyclic salt fog, dry-off, and Wlcondensation, sions on this subject. The National Association of<br />
consistent with Cycle 2 above. The second covers Corrosion Engineers (NACE) has sponsored a<br />
cycling between salt and W, and is consistent symposium on Accelerated Testing at its annual<br />
with Cycle 4 above. It is anticipated that both of conference in Nashville in April 1992. ASTM<br />
these will initially be issued as Standard Prac- Committee G-3 on Durability of Non-Metallic Matices.<br />
They would describe how to conduct the terials and Subcommittee D1.27 on Accelerated<br />
tests and identify available equipment, but they Testing of coatings are co-sponsoring a sympoare<br />
not expected to establish definitive test proce- sium on Accelerated and Outdoor Durability Testdures,<br />
cycle times, or parameters. Standard ing, January 19-20,1993 in Fort Lauderdale. In<br />
methods would be developed at a later date, based November 1993, ASTM Committee G-1 is likewise<br />
on results <strong>from</strong> user data on the methods and ap- sponsoring a special symposium on Cyclic<br />
paratus. ASTM D1.27 is also planning to adminis- Corrosion Testing. The American Chemical Sociter<br />
an interlaboratory test to evaluate industrial ety is responding with a symposium on "Durabilimaintenance<br />
coatings and pre-finished metal ty of Coatings," to be held April 18-23,1993,<br />
coatings in 4 to 5 test cycles and several outdoor in Denver. The Federation of Societies for Coattest<br />
sites. This work would be coordinated with ings Technology (FSCT) has included sessions<br />
the SSPC test program to provide the maximum on accelerated testing at several recent conferamount<br />
of data for the development of standards. ences, and, earlier, it sponsored a survey on the<br />
Organizations that use accelerated testing will be various accelerated testing techniques. SSPC is<br />
asked to participate in the SSPC and ASTM pro- tentatively planning to hold its Second Confergrams<br />
by furnishing laboratory test facilities, test ence on Accelerated Testing and Durability in<br />
specimens, coatings, and funding.<br />
Spring of 1994.<br />
Another ASTM Committee, G.1, on Corro-<br />
Finally, at the SSPC National Conference<br />
sion of Metals, is preparing to revise the current in Kansas City, the Accelerated Testing Commitsalt<br />
spray test, ASTM B 117, to incorporate cy- tee will meet on November 19, to review new<br />
cling. An important question that must be addressed<br />
is the difference between cabinets designed<br />
to produce a cycle internally, and those in<br />
sources of data and programs to evaluate and<br />
standardize test procedures.<br />
Although there is a substantial amount of<br />
new development and activity under way, an ac-<br />
Bibliography<br />
"Advances in Accelerated Testing and Coating<br />
Characterization." Proceedings of the SSPC<br />
Coating Evaluation and Durability Conference.<br />
Pittsburgh, PA. April 29-May 3,1991.<br />
SSPC 91-15 (16 papers). Steel Structures<br />
Painting Council. Pittsburgh, PA. 1991.<br />
Investigation of Cyclic Test Methods for Corrosion<br />
Protective Coatings. SSPC Report 91-03.<br />
Steel Structures Painting Council. Pittsburgh,<br />
PA. --- 1991.<br />
Investigation of Standardized Reference Paints<br />
for Improved <strong>Performance</strong> Evaluation. SSPC<br />
Report 91-02. Steel Structures Painting -<br />
council. Pittsburgh, PA 1991.<br />
<strong>Performance</strong> Testing of<strong>Marine</strong> Coatings: New<br />
Test and Evaluation Procedures. SSPC Report<br />
90-02 (National Shipbuilding Research Program<br />
Report 0311). Steel Structures Painting<br />
Council. Pittsburgh, PA. June 1990.<br />
Survey ofAccelerated Test Methods for Anti-Corrosive<br />
Coating <strong>Performance</strong>. Federation of<br />
Societies for Coatings Technology. Philadelphia,<br />
PA. June 1989.<br />
errors. This "screening" test accepted poor<br />
coatings (i.e., coatings that ultimately failed<br />
in atmospheric exposure) and rejected good<br />
coatings (i.e., those that weathered atmospheric<br />
exposure very well).<br />
It was shown that early data <strong>from</strong> exterior<br />
exposures can be used for prediction of<br />
long-term field performance. A more stringent<br />
alternative failure criterion (i.e., an 8<br />
rather than a 7 rating per ASTM D 61OISSPC-<br />
VIS 2) can also allow earlier prediction in<br />
shorter time periods. This approach is much<br />
superior to using accelerated testing because<br />
actual exterior data are being utilized.<br />
Acknowledgment<br />
The original research was supported primarily<br />
by the Federal Highway Administration<br />
(FHWA) and a consortium of 25 state highway<br />
agencies. The author recognizes the technical<br />
contributions of Dr. Simon Boocock and Raymond<br />
Weaver of SSPC and John Peart of<br />
FHWA. <strong>Lab</strong>oratory ratings and panel preparations<br />
were conducted by J. Henry Lauer of<br />
SSPC. Early contributions to the program<br />
were made by John Keane and Dr. Joseph A.<br />
Bruno, Jr., formerly of SSPC.<br />
This article is based on one originally<br />
published in reference 7. R<br />
References<br />
1. B.R. Appleman, "New Statistical Approach to Evaluate<br />
and Predict <strong>Performance</strong> of Coatings for Steel," American<br />
Chemical Society Polymeric Materials Science<br />
and Engineering, 58, Washington, DC, p. 412, (1988).<br />
2. <strong>Performance</strong> ofAltemate Coatings in the Environment<br />
(PACE): Volume 3, Executive Summary, SSPC<br />
89-12, Steel Structures Painting Council, Pittsburgh,<br />
PA, December 1989 (FHWA RD 89-236).<br />
3. <strong>Performance</strong> ofAlternate Coatings in the Environment<br />
(PACE) PHASE IAccelerated Tests and Results,<br />
SSPC Report 79-01, Steel Structures Painting Council,<br />
Pittsburgh, PA, December 1979 (FHWA PA 79-05).<br />
4. <strong>Performance</strong> ofAlternate Coatings in the Environment<br />
(PACE), Volume 1: Ten Year Field Data, SSPC<br />
89-03, Steel Structures Painting Council, Pittsburgh,<br />
PA, June 1989 (FHWA RD 89-127).<br />
5. <strong>Performance</strong> ofAltemate Coatings in the Environment<br />
(PACE), Volume 2: Five Year Field Data and<br />
Bridge Data of Improved Formulations, SSPC Report<br />
89-11, Steel Structures Painting Council, Pittsburgh,<br />
PA, December 1989 (FHWA RD 89-235).<br />
6. "<strong>Performance</strong> Testing of <strong>Marine</strong> Coatings: New Test<br />
and Evaluation Procedures," National Shipbuilding<br />
Research Program, Report NSRP 0311, SSPC Report<br />
90-02, Steel Structures Painting Council, Pittsburgh,<br />
PA, June 1990.<br />
7. Bernard R. Appleman, "Comparing Short- and Long-<br />
Term Testing of Coatings," in Advances in Accelerated<br />
Testing and Coating Characterization, SSPC 91-15,<br />
Steel Structures Painting Council, Pittsburgh, PA,<br />
1991.<br />
October 1992 / 143