Sunlight, Weathering, Light Stability - Q-Lab
Sunlight, Weathering, Light Stability - Q-Lab
Sunlight, Weathering, Light Stability - Q-Lab

Create successful ePaper yourself
Turn your PDF publications into a flip-book with our unique Google optimized e-Paper software.
the winter months. These types of changes are<br />
especially significant for polymeric materials, such<br />
as PVC.<br />
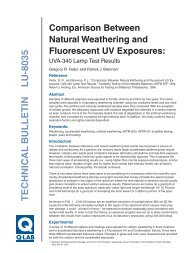
Atmosphere<br />
Summer Sun<br />
Earth<br />
Winter Sun<br />
Figure 4- Seasonal Effect on Atmospheric Filtering<br />
Spectral Sensitivity. The amount and type of<br />
damage that a material is susceptible to is dependant<br />
upon the spectral sensitivity of that particular<br />
material. Spectral sensitivity is a measure of how<br />
damage caused by a unit of light energy varies<br />
according to the wavelength of light. Spectral<br />
sensitivity may vary from material to material, and<br />
similar materials formulated for the same application<br />
may have significantly different spectral sensitivities.<br />
Spectral sensitivity determines whether<br />
a material is sensitive to short wavelengths, long<br />
wavelengths, or both.<br />
Importance of Short Wavelength Cut-Off. Photochemical<br />
reactions are caused by photons of light<br />
breaking chemical bonds. For each type of chemical<br />
bond, there is a critical threshold wavelength<br />
of light that contains enough energy to cause a<br />
reaction. <strong>Light</strong> of any wavelength shorter than this<br />
threshold can break the bond, but longer wavelengths<br />
of light cannot, regardless of the light’s<br />
intensity. Therefore, the short wavelength cut<br />
on of a light source is of critical importance. For<br />
example, if a particular polymer is only sensitive<br />
to UV light below 295 nm (the solar cut-off point),<br />
it will never experience photochemical deterioration<br />
outdoors. If the same polymer is exposed<br />
to a laboratory light source that has a spectral<br />
cut-off of 280 nm, it will deteriorate. Consequently,<br />
light sources that produce shorter wavelengths<br />
produce faster tests, but there is a possibility of<br />
anomalous results if a tester has a wavelength<br />
cut-off that is too far below that of the material’s<br />
end-use environment.<br />
Importance of Longer Wavelengths. For interiorgrade<br />
materials, such as inks and dyes, longer<br />
wave UV and short wave visible light often have a<br />
significant effect. IR radiation can also effect degradation<br />
because of the heat buildup. In addition,<br />
IR can be responsible for thermal degradation in<br />
some materials. And, although IR does not cause<br />
photodegradation, the increased temperatures it<br />
may create can lead to an increase in the rate of<br />
photoinitiated degradation.<br />
Accelerated <strong>Light</strong> Sources<br />
Compared to <strong>Sunlight</strong><br />
The following discussion of accelerated light<br />
sources will confine itself to the issue of spectrum.<br />
It will not address spectral stability, the effects of<br />
moisture, the effects of exposure cycles or the<br />
reproducibility of results.<br />
To analyze their usefulness for simulating sunlight,<br />
the most common laboratory light sources will be<br />
compared to what we call the Solar Maximum condition:<br />
global, noon sunlight, at normal incidence,<br />
on the summer solstice. The Solar Maximum is<br />
the most severe condition met in outdoor service,<br />
and as such it controls which materials will fail. It<br />
is misleading to compare light sources against socalled<br />
“average optimum sunlight,” which is simply<br />
an average of the much less damaging summer<br />
and winter equinox measurements. Another misleading<br />
comparison is the “Miami average,” which<br />
is simply an average of one year of Miami sunlight.<br />
All graphs labeled "sunlight" in this paper refer to<br />
the Solar Maximum.<br />
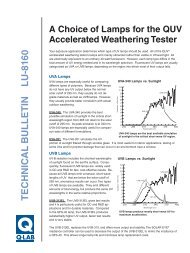
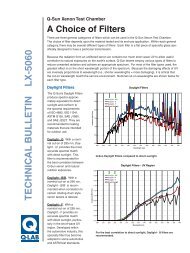
Despite the inherent variability of solar UV, our<br />
measurements show surprisingly little variation in<br />
the Solar Maximum at different locations. Figure<br />
5 shows the Solar Maximum measured at three<br />
widely varied locations.<br />
Irradiance (W/m 2 /nm)<br />
2.0<br />
1.5<br />
1.0<br />
0.5<br />
Kitt Peak<br />
Cleveland<br />
Miami<br />
0.0<br />
250 350 450 550 650<br />
Wavelength (nm)<br />
Figure 5- Solar Maximum, 3 Locations<br />
3