Sunlight, Weathering, Light Stability - Q-Lab
Sunlight, Weathering, Light Stability - Q-Lab
Sunlight, Weathering, Light Stability - Q-Lab

You also want an ePaper? Increase the reach of your titles
YUMPU automatically turns print PDFs into web optimized ePapers that Google loves.
<strong>Sunlight</strong>, <strong>Weathering</strong> &<br />
<strong>Light</strong> <strong>Stability</strong> Testing<br />
TECHNICAL BULLETIN LU-0822<br />
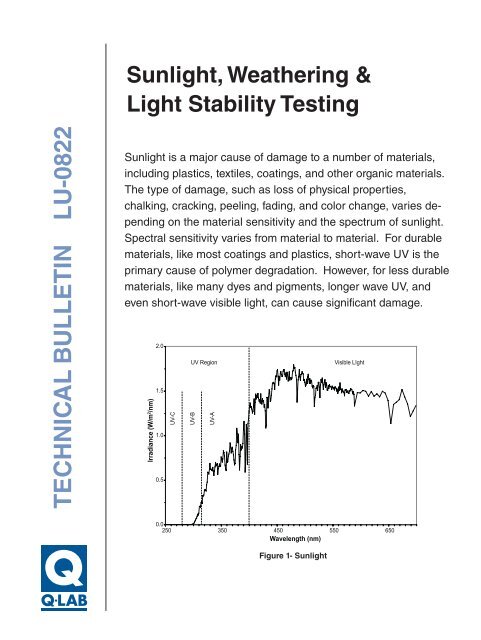
<strong>Sunlight</strong> is a major cause of damage to a number of materials,<br />
including plastics, textiles, coatings, and other organic materials.<br />
The type of damage, such as loss of physical properties,<br />
chalking, cracking, peeling, fading, and color change, varies depending<br />
on the material sensitivity and the spectrum of sunlight.<br />
Spectral sensitivity varies from material to material. For durable<br />
materials, like most coatings and plastics, short-wave UV is the<br />
primary cause of polymer degradation. However, for less durable<br />
materials, like many dyes and pigments, longer wave UV, and<br />
even short-wave visible light, can cause significant damage.<br />
Irradiance (W/m 2 /nm)<br />
2.0<br />
1.5<br />
1.0<br />
0.5<br />
UV-C<br />
UV Region<br />
UV-B<br />
UV-A<br />
Visible LIght<br />
0.0<br />
250 350 450 550 650<br />
Wavelength (nm)<br />
Figure 1- <strong>Sunlight</strong>
For many manufacturers, it is crucial to formulate<br />
products that can withstand light exposure. Accelerated<br />
weathering testers are designed to simulate<br />
natural sunlight, and are widely used for research<br />
and development, quality control and material certification.<br />
These testers can provide fast, repeatable<br />
and reproducible results.<br />
Irradiance (W/m 2 /nm)<br />
1.0<br />
0.8<br />
0.6<br />
0.4<br />
TEST CONDITIONS<br />
date: 22 JUN 99<br />
location: Oberlin, OH<br />
direction: normal to sun<br />
IL1700 cal date: 17 MAY 99<br />
input optics: teflon 3/8" high<br />
wavelength increments: 5 nm<br />
2:00 PM<br />
1:00 PM<br />
3:00 PM<br />
12:00 PM<br />
11:00 PM<br />
4:00 PM<br />
10:00 AM<br />
5:00 PM<br />
9:00 AM<br />
6:00 PM<br />
8:00 AM<br />
7:00 PM<br />
2<br />
In order to quantify the wide variations in the UV<br />
content of sunlight, four categories of spectroradiometric<br />
measurements were taken. These<br />
include direct summer sunlight, winter sunlight,<br />
sunlight filtered though ordinary window glass and<br />
sunlight filtered through automotive glass.<br />
In order to quantify the spectra from the various<br />
lab testers, spectroradiometric measurements<br />
were made in various types of accelerated testers<br />
including QUV ® Accelerated <strong>Weathering</strong> Testers<br />
(i.e., fluorescent UV and condensation testers)<br />
and xenon arc chambers. In addition, spectra<br />
were calculated for the accelerated outdoor<br />
exposure device known as the Q-TRAC ® Natural<br />
<strong>Sunlight</strong> Concentrator. The various accelerated<br />
devices show a wide variety of spectra. These<br />
measurements suggest recommendations for the<br />
use of different testers or different light sources for<br />
different applications.<br />
The <strong>Sunlight</strong> Spectrum<br />
The electromagnetic energy from sunlight is normally<br />
divided into ultraviolet, visible light and infrared<br />
energy, as shown in Figure 1. Ultraviolet light<br />
consists of radiation below 400 nanometers (nm).<br />
Visible light is defined as radiation between 400<br />
and 760 nm. Infrared energy consists of wavelengths<br />
longer than the visible red wavelengths,<br />
and starts above about 760 nm.<br />
Variability of <strong>Sunlight</strong>. Because UV is easily<br />
filtered by air mass, cloud cover, pollution, etc., the<br />
amount and spectrum of natural UV exposure is<br />
extremely variable. <strong>Sunlight</strong> varies from moment<br />
to moment throughout the day. Figure 2 shows the<br />
spectral power distribution (SPD) of full spectrum<br />
sunlight measured at several times throughout the<br />
day (where & when).<br />
Irradiance (W/m 2 /nm)<br />
0.2<br />
0.0<br />
250 270 290 310 330 350 370 390<br />
Wavelength (nm)<br />
Figure 2- <strong>Sunlight</strong> Throughout the Day<br />
The SPD of sunlight also varies throughout the<br />
year. The greatest variability is in the UV region.<br />
Figure 3 shows a comparison of the UV regions<br />
of sunlight, measured in Cleveland, Ohio, USA at<br />
noon on:<br />
• The summer solstice (longest day of the year)<br />
• The winter solstice (shortest day of the year)<br />
• The spring equinox.<br />
These measurements are in agreement with data<br />
reported by other investigators. See ASTM G173<br />
for a useful reference spectrum.<br />
1.5<br />
1.0<br />
0.5<br />
March<br />
Equinox<br />
June<br />
December<br />
0.0<br />
250 270 290 310 330 350 370 390<br />
Wavelength (nm)<br />
Figure 3- Seasonal Variation of <strong>Sunlight</strong> UV<br />
7:00 AM<br />
8:00 PM<br />
(cloudy)<br />
Because the sun is lower in the sky during the<br />
winter months, it is filtered through a greater air<br />
mass (Figure 4). This introduces two important<br />
distinctions between summer and winter sunlight:<br />
changes in the intensity of the light and changes<br />
in the spectrum. Most importantly, the shorter,<br />
more damaging UV wavelengths are filtered out<br />
during the winter. For example, the intensity of<br />
UV at 320 nm is about 8 times greater in the<br />
summer than in the winter. In addition, the short<br />
wavelength solar cut-off shifts from about 295<br />
nm in summer to about 310 nm in winter months.<br />
Consequently, materials sensitive to UV below 310<br />
nm would degrade only slightly, if at all, during
the winter months. These types of changes are<br />
especially significant for polymeric materials, such<br />
as PVC.<br />
Atmosphere<br />
Summer Sun<br />
Earth<br />
Winter Sun<br />
Figure 4- Seasonal Effect on Atmospheric Filtering<br />
Spectral Sensitivity. The amount and type of<br />
damage that a material is susceptible to is dependant<br />
upon the spectral sensitivity of that particular<br />
material. Spectral sensitivity is a measure of how<br />
damage caused by a unit of light energy varies<br />
according to the wavelength of light. Spectral<br />
sensitivity may vary from material to material, and<br />
similar materials formulated for the same application<br />
may have significantly different spectral sensitivities.<br />
Spectral sensitivity determines whether<br />
a material is sensitive to short wavelengths, long<br />
wavelengths, or both.<br />
Importance of Short Wavelength Cut-Off. Photochemical<br />
reactions are caused by photons of light<br />
breaking chemical bonds. For each type of chemical<br />
bond, there is a critical threshold wavelength<br />
of light that contains enough energy to cause a<br />
reaction. <strong>Light</strong> of any wavelength shorter than this<br />
threshold can break the bond, but longer wavelengths<br />
of light cannot, regardless of the light’s<br />
intensity. Therefore, the short wavelength cut<br />
on of a light source is of critical importance. For<br />
example, if a particular polymer is only sensitive<br />
to UV light below 295 nm (the solar cut-off point),<br />
it will never experience photochemical deterioration<br />
outdoors. If the same polymer is exposed<br />
to a laboratory light source that has a spectral<br />
cut-off of 280 nm, it will deteriorate. Consequently,<br />
light sources that produce shorter wavelengths<br />
produce faster tests, but there is a possibility of<br />
anomalous results if a tester has a wavelength<br />
cut-off that is too far below that of the material’s<br />
end-use environment.<br />
Importance of Longer Wavelengths. For interiorgrade<br />
materials, such as inks and dyes, longer<br />
wave UV and short wave visible light often have a<br />
significant effect. IR radiation can also effect degradation<br />
because of the heat buildup. In addition,<br />
IR can be responsible for thermal degradation in<br />
some materials. And, although IR does not cause<br />
photodegradation, the increased temperatures it<br />
may create can lead to an increase in the rate of<br />
photoinitiated degradation.<br />
Accelerated <strong>Light</strong> Sources<br />
Compared to <strong>Sunlight</strong><br />
The following discussion of accelerated light<br />
sources will confine itself to the issue of spectrum.<br />
It will not address spectral stability, the effects of<br />
moisture, the effects of exposure cycles or the<br />
reproducibility of results.<br />
To analyze their usefulness for simulating sunlight,<br />
the most common laboratory light sources will be<br />
compared to what we call the Solar Maximum condition:<br />
global, noon sunlight, at normal incidence,<br />
on the summer solstice. The Solar Maximum is<br />
the most severe condition met in outdoor service,<br />
and as such it controls which materials will fail. It<br />
is misleading to compare light sources against socalled<br />
“average optimum sunlight,” which is simply<br />
an average of the much less damaging summer<br />
and winter equinox measurements. Another misleading<br />
comparison is the “Miami average,” which<br />
is simply an average of one year of Miami sunlight.<br />
All graphs labeled "sunlight" in this paper refer to<br />
the Solar Maximum.<br />
Despite the inherent variability of solar UV, our<br />
measurements show surprisingly little variation in<br />
the Solar Maximum at different locations. Figure<br />
5 shows the Solar Maximum measured at three<br />
widely varied locations.<br />
Irradiance (W/m 2 /nm)<br />
2.0<br />
1.5<br />
1.0<br />
0.5<br />
Kitt Peak<br />
Cleveland<br />
Miami<br />
0.0<br />
250 350 450 550 650<br />
Wavelength (nm)<br />
Figure 5- Solar Maximum, 3 Locations<br />
3
Two Different Approaches<br />
The QUV Accelerated <strong>Weathering</strong> Tester and the<br />
xenon arc are the most commonly used accelerated<br />
weathering and light stability testers. These<br />
testers are based on two completely different<br />
approaches.<br />
Xenon arc testers, such as the Q-SUN ® Xenon<br />
Test Chamber, reproduce the entire spectrum of<br />
sunlight including ultraviolet (UV), visible light and<br />
infrared (IR). The xenon is essentially an attempt<br />
to reproduce sunlight itself.<br />
QUV testers do not attempt to reproduce the full<br />
spectrum of sunlight, but, rather, just the damaging<br />
effects of sunlight. This is accomplished by<br />
confining the primary emission of their fluorescent<br />
lamps to the UV portion of the spectrum. This<br />
approach is effective because short wavelength<br />
UV causes almost all of the damage to durable<br />
materials exposed outdoors. Figure 6 shows the<br />
comparison between sunlight, xenon and fluorescent<br />
UV.<br />
3.0<br />
2.5<br />
Xenon with<br />
Daylight Filter<br />
Xenon Arc Lamps. The full spectrum xenon arc<br />
(ISO4892-2, ISO11341, ASTM G155, SAE J2412)<br />
allows the user to test for damage caused by<br />
short-wave UV, as well as longer wavelength damage<br />
such as fading and color change. There are<br />
two main factors to consider when using a xenon<br />
tester: effect of filters and irradiance control.<br />
Xenon Filters for Outdoor Simulations.<br />
Because the radiation from an unfiltered xenon arc<br />
contains too much short-wave UV to allow useful<br />
correlation to natural exposures on the earth’s<br />
surface, xenon testers employ various types of<br />
filters to reduce unwanted radiation and achieve<br />
an appropriate spectrum. For most of the filter<br />
types used, the greatest effect is on the short<br />
wavelength portion of the spectrum. Because the<br />
damaging effects of UV are inversely proportional<br />
to wavelength, it is critical that the cut-on wavelength<br />
match the service environment. The type<br />
of filter depends on the materials tested, and the<br />
end-use application.<br />
There are three general categories of filters that<br />
can be used in a xenon test chamber. Within each<br />
general category, there may be several different<br />
types of filters. Each filter is a piece of specialty<br />
glass designed to have a particular transmission.<br />
Irradiance (W/m 2 /nm)<br />
2.0<br />
1.5<br />
1.0<br />
0.5<br />
QUV with<br />
UVA-340 Lamps<br />
<strong>Sunlight</strong><br />
0.0<br />
250 350 450 550 650 750 850 950 1050<br />
Wavelength (nm)<br />
Figure 6- <strong>Sunlight</strong>, Xenon and Fluorescent UV<br />
Daylight Filters produce spectra approximately<br />
equivalent to direct, noon summer sunlight and<br />
conform to the spectral requirements of ISO 4892,<br />
ISO 11341, ASTM G155, SAE J1960 and SAE<br />
J2527. They are recommended for testing materials<br />
that are intended for outdoor use and allow<br />
the best correlation between xenon and natural<br />
outdoor exposures. See Figure 7 and Figure 7A.<br />
In addition to the technical considerations, there<br />
are practical ramifications to these differing approaches.<br />
Xenon testers require a lot of electrical<br />
input to produce their full spectrum. Consequently,<br />
they also generate a lot of heat from the visible<br />
and IR portions of the spectrum. This heat must<br />
be removed by either a water-cooling or an aircooling<br />
system. Therefore, differences in the operating<br />
costs of the two tester types are significant.<br />
For a full discussion, see Q-<strong>Lab</strong> Technical Bulletin<br />
LU-8009, QUV & Q-SUN: A Comparison of Two<br />
Effective Approaches To Accelerated <strong>Weathering</strong> &<br />
<strong>Light</strong> <strong>Stability</strong> Testing.<br />
Irradiance (W/m 2 /nm)<br />
2.0<br />
1.5<br />
1.0<br />
0.5<br />
<strong>Sunlight</strong><br />
Xenon<br />
Extended UV<br />
0.0<br />
250 300 350 400 450 500 550 600 650 700<br />
Wavelength (nm)<br />
Figure 7- Xenon with Extended UV Filters<br />
4
Irradiance (W/m 2 /nm)<br />
1.2<br />
1.0<br />
0.8<br />
0.6<br />
0.4<br />
0.2<br />
Xenon<br />
Exended UV<br />
<strong>Sunlight</strong><br />
0.0<br />
250 275 300 325 350 375 400<br />
Wavelength (nm)<br />
Figure 7A- Xenon with Extended UV Filters in the UV<br />
Irradiance Control. To control light intensity,<br />
modern xenon arc testers have a light monitoring<br />
system to compensate for the inevitable light<br />
output decay from lamp aging. The most common<br />
irradiance settings are 0.35 or 0.55 W/m 2 at 340<br />
nm. Figure 9 shows how these two settings compare<br />
to the Solar Maximum. While 0.55 is comparable<br />
to summer sunlight, 0.35 is comparable to<br />
winter sunlight. However, for historical reasons,<br />
0.35 is the most commonly used setting.<br />
Another irradiance setting that can be used is 0.68<br />
W/m 2 at 340 nm. This is the irradiance which is<br />
the best match with the Solar Maximum.<br />
Extended UV Filters allow significant excess UV<br />
below the cut-on of natural sunlight at the earth’s<br />
surface. Extended UV Filters are often used to<br />
produce faster degradation than Daylight Filters.<br />
They are required in many automotive test<br />
methods. They may also be used to reproduce<br />
extraterrestrial spectra for aerospace applications.<br />
See Figure 8 and Figure 8A.<br />
Irradiance (W/m 2 /nm)<br />
2.0<br />
1.5<br />
1.0<br />
0.5<br />
<strong>Sunlight</strong><br />
0.55 W/m 2<br />
0.35 W/m 2<br />
2.5<br />
Irradiance (W/m 2 /nm)<br />
Irradiance (W/m 2 /nm)<br />
2.0<br />
1.5<br />
1.0<br />
0.5<br />
<strong>Sunlight</strong><br />
Xenon<br />
Daylight<br />
0.0<br />
250 300 350 400 450 500 550 600 650 700<br />
Wavelength (nm)<br />
1.2<br />
1.0<br />
0.8<br />
0.6<br />
0.4<br />
0.2<br />
Figure 8- Xenon with Daylight Filters<br />
Xenon<br />
Daylight<br />
<strong>Sunlight</strong><br />
0.0<br />
250 275 300 325 350 375 400<br />
Wavelength (nm)<br />
Figure 8A- Xenon with Daylight Filters in the UV<br />
0.0<br />
250 350 450 550 650<br />
Wavelength (nm)<br />
Figure 9- Effect of Irradiance Setting<br />
Fluorescent UV. Unlike xenon arcs, QUV testers<br />
(ISO4892-3, ISO 11507, ASTM G154, SAE J2020)<br />
utilize different types of UV lamps, with different<br />
spectra for different exposure applications.<br />
FS-40 Lamps. In the early 1970’s, the FS-40<br />
became the first QUV machine lamp to achieve<br />
wide use. This lamp is currently specified in some<br />
automotive specifications, particularly for coatings.<br />
This lamp has demonstrated good correlation to<br />
outdoor exposures for gloss retention on coatings<br />
and for the material integrity of plastics. However,<br />
the short wavelength output below the solar cut-off<br />
can cause anomalous results, especially for color<br />
retention of plastics and textile materials.<br />
UVB-313 Lamps were introduced in 1984. The<br />
UVB-313 is essentially a second generation FS-<br />
40. It has the same SPD as the FS-40, but with<br />
higher, more stable output. Figure 10 shows the<br />
SPD of sunlight compared to the UVB-313 and the<br />
FS-40. Because of its higher output, the UVB-313<br />
gives significantly greater acceleration than the<br />
FS-40 for most materials. It is especially useful for<br />
Quality Control and research applications.<br />
5
12<br />
1.2<br />
1.0<br />
<strong>Sunlight</strong><br />
10<br />
Q-Trac<br />
Irradiance (W/m 2 /nm)<br />
0.8<br />
0.6<br />
0.4<br />
FS-40<br />
UVB-313<br />
Irradiance (W/m 2 /nm)<br />
8<br />
6<br />
4<br />
<strong>Sunlight</strong><br />
2<br />
0.2<br />
0.0<br />
250 270 290 310 330 350 370 390<br />
Wavelength (nm)<br />
Figure 10- UVB-313 and FS-40<br />
0<br />
250 300 350 400 450 500 550 600 650 700<br />
Wavelength (nm)<br />
Figure 12- Q-TRAC Concentrator and <strong>Sunlight</strong><br />
UVA-340 Lamps were designed to enhance correlation<br />
with natural exposures. The UVA-340 has<br />
been extensively used for both plastics and coatings,<br />
and greatly improves the correlation possible<br />
with QUV testers. Figure 11 shows the UVA-340<br />
compared to the Solar Maximum. This lamp is an<br />
excellent simulation of sunlight from about 370 nm<br />
to the solar cut-off of 295 nm.<br />
Irradiance (W/m 2 /nm)<br />
1.2<br />
1.0<br />
0.8<br />
0.6<br />
0.4<br />
UVA-340<br />
<strong>Sunlight</strong><br />
Filtering Effect of<br />
Glass on <strong>Sunlight</strong><br />
Common Window Glass. Glass of any type<br />
acts as a filter on the sunlight spectrum. The<br />
shorter, more damaging wavelengths are the most<br />
greatly affected. Figure 13 shows direct sunlight<br />
compared to sunlight filtered though ordinary,<br />
single-strength, untinted, 0.125 inch thick window<br />
glass. Ordinary glass is essentially transparent to<br />
light above 370 nm. However, the filtering effect<br />
becomes more pronounced with decreasing wavelengths.<br />
In fact, the most damaging wavelengths<br />
below about 310 nm are completely filtered out.<br />
3.00<br />
6<br />
0.2<br />
0.0<br />
250 270 290 310 330 350 370 390<br />
Wavelength (nm)<br />
Figure 11- UVA-340 and <strong>Sunlight</strong><br />
Q-TRAC Natural <strong>Sunlight</strong> Concentrator.<br />
Accelerated outdoor weathering devices that use<br />
natural sunlight as their light source have been<br />
used for many decades. Simple, early versions<br />
were designed to follow the sun from morning until<br />
night in order to maximize the amount of sunlight<br />
that an outdoor exposure specimen could receive.<br />
Later, mirrors were added to concentrate the<br />
sunlight onto the test specimens for even greater<br />
acceleration. This solar concentrating acceleration<br />
technique has been standardized in ISO 877,<br />
ASTM G90 and SAE J1961, among others.<br />
The Q-TRAC and other sunlight concentrators<br />
use a series of 10 mirrors to reflect full spectrum<br />
sunlight. The spectrum that the test specimens<br />
actually receive is affected by the fact that the device<br />
utilizes only direct beam sunlight and that the<br />
reflectivity of the mirrors is not perfectly efficient.<br />
Figure 12 shows a comparison of natural sunlight<br />
and the Q-TRAC concentrator spectrum.<br />
Irradiance (W/m 2 /nm)<br />
2.50<br />
2.00<br />
1.50<br />
1.00<br />
0.50<br />
<strong>Sunlight</strong><br />
Through<br />
Window<br />
Glass<br />
0.00<br />
260 300 340 380 420 460 500 540 580 620 660 700 740 780<br />
Wavelength (nm)<br />
Figure 13- <strong>Sunlight</strong> Through Window Glass<br />
Automotive Glass. Automotive glass is thicker<br />
than window glass. It is frequently tinted and<br />
windshield glass normally contains a layer of laminated<br />
plastic. Figure 14 shows a comparison of<br />
direct sunlight with sunlight through window glass<br />
and sunlight through windshield glass. All of these<br />
act to improve the filtering efficiency of auto glass<br />
and almost all of the most damaging UV is filtered<br />
out. Figure 15 shows the SPD of four different<br />
types of automotive glass, with varying thickness<br />
and tint combinations.
1.2<br />
1.20<br />
1.0<br />
1.00<br />
Irradiance (W/m 2 /nm)<br />
0.8<br />
0.6<br />
0.4<br />
0.2<br />
Through<br />
Window<br />
Glass<br />
<strong>Sunlight</strong><br />
Through<br />
Windshield<br />
0.0<br />
260 280 300 320 340 360 380 400<br />
Wavelength (nm)<br />
Irradiance (W/m 2 /nm)<br />
0.80<br />
0.60<br />
0.40<br />
0.20<br />
<strong>Sunlight</strong><br />
Window - B/SL<br />
Filter<br />
Window - Q<br />
Filter<br />
Wavelength (nm)<br />
<strong>Sunlight</strong><br />
Through<br />
Glass<br />
Window - IR<br />
Filter<br />
0.00<br />
250 275 300 325 350 375 400<br />
Figure 14- <strong>Sunlight</strong> Through Windshield Glass<br />
Figure 16A- Xenon with Window Glass Filters<br />
in the UV<br />
Irradiance (W/m 2 /nm)<br />
1.2<br />
1.0<br />
0.8<br />
0.6<br />
0.4<br />
A= 0.128 inch thick, clear<br />
B= 0.228 inch thick, clear<br />
C= 0.159 inch thick, lightly tinted<br />
D= 0.194 inch thick, tinted<br />
<strong>Sunlight</strong><br />
A<br />
C<br />
The spectra produced by xenon test chambers using<br />
Window Glass Filters also covers most of the<br />
wavelengths that would be found from the many<br />
artificial light sources used indoors (cool white<br />
fluorescent, etc.), so it is also appropriate for most<br />
indoor applications. See Figure 17.<br />
0.2<br />
B<br />
D<br />
0.0<br />
260 280 300 320 340 360 380 400<br />
Wavelength (nm)<br />
Figure 15- <strong>Sunlight</strong> Through Auto Glass<br />
Accelerated <strong>Light</strong> Sources and<br />
<strong>Sunlight</strong> Through Glass<br />
Xenon Arc. Properly filtered xenon arc (ISO<br />
4892-2, ISO 105 B02, ASTM G-155, SAE J2527,<br />
AATCC TM16-3) provides the best simulation of<br />
sunlight through window glass. However there<br />
is no single “standard window glass.” Because<br />
transmission varies due to thickness, chemical<br />
composition, etc., several Window Glass Filters<br />
have been developed for the Q-SUN Xenon Test<br />
Chamber.<br />
Irradiance (W/m 2 /nm)<br />
0.14<br />
0.12<br />
0.10<br />
0.08<br />
0.06<br />
0.04<br />
0.02<br />
Q-Sun with<br />
Window Glass Filters<br />
8,000 lux<br />
<strong>Sunlight</strong> through<br />
Window Glass<br />
8,000 lux<br />
Mercury Vapor<br />
Metal Halide<br />
High Pressure Sodium<br />
Cool White Fluorescent<br />
Incandescent<br />
0.00<br />
250 300 350 400 450 500 550 600 650 700 750 800<br />
Wavelength (nm)<br />
Figure 17- SPDs of Common Indoor <strong>Light</strong>s,<br />
Compared to Q-SUN Xenon Test Chamber<br />
2.80<br />
2.40<br />
Irradiance (W/m 2 /nm)<br />
2.00<br />
1.60<br />
1.20<br />
0.80<br />
0.40<br />
Window - Q<br />
Filter<br />
Window - B/SL<br />
Filter<br />
<strong>Sunlight</strong><br />
<strong>Sunlight</strong><br />
Through<br />
Glass<br />
Wavelength (nm)<br />
Figure 16- Xenon with Window Glass Filters<br />
Window - IR<br />
Filter<br />
0.00<br />
250 300 350 400 450 500 550 600 650 700<br />
7
Note: Some automotive test methods for interior<br />
materials like textiles and soft trim still specify the<br />
extended UV Filter. SAE J1885 and SAE J2412<br />
are examples of this. Figure 18 shows this xenon<br />
method compared to sunlight through ordinary<br />
glass. Obviously an excessive amount of short<br />
wave UV is allowed by the Extended UV Filter<br />
and the correlation to real world results should be<br />
examined carefully.<br />
1.2<br />
1.0<br />
Irradiance (W/m 2 /nm)<br />
0.8<br />
0.6<br />
0.4<br />
Quartz/Boro<br />
Xenon Arc<br />
0.2<br />
<strong>Sunlight</strong> Through Glass<br />
0.0<br />
260 280 300 320 340 360 380 400<br />
Wavelength (nm)<br />
Figure 18- Xenon and <strong>Sunlight</strong> Through Glass<br />
8
Conclusions and Caveats<br />
Correlation between laboratory and natural exposure<br />
test results will probably always be controversial.<br />
The user must educate himself to make a<br />
number of choices.<br />
Because there are several types of lab testers<br />
with multiple lamps and filters available, no single<br />
tester is perfect for every application. Short wave<br />
UV is usually best for testing polymer degradation,<br />
while the full spectrum approach is often most appropriate<br />
for testing for color change of pigments<br />
and dyes.<br />
<strong>Light</strong> sources that produce very short wavelength<br />
UV give fast results, but they may not always be<br />
accurate. Usually when they are wrong, they are<br />
wrong on the safe side in that the results are too<br />
severe. <strong>Light</strong> sources that eliminate wavelengths<br />
below the solar cut-off of 295 nm will give more<br />
accurate results, but the price for increased correlation<br />
is usually reduced acceleration. As Fischer<br />
has shown, test speed and accuracy are inversely<br />
related.<br />
In addition, we should point out that despite the<br />
current interest in light energy, the spectrum of a<br />
test device is only one piece of the puzzle. With<br />
any accelerated tester, there are a number of<br />
parameters that can be programmed: spectrum,<br />
moisture, humidity, temperature and test cycle.<br />
Furthermore, the parameters that one chooses<br />
are, to a certain extent, arbitrary. No single test<br />
cycle or device can reproduce all of the variables<br />
found outdoors in different climates, altitudes and<br />
latitudes. Consequently, even the most elaborate<br />
tester is really just a screening device. The real<br />
usefulness of accelerated testers is that they can<br />
give reliable, relative indications of which materials<br />
perform best under a specific set of conditions.<br />
Acknowledgements<br />
The authors are responsible for the accuracy of<br />
this paper. However we would like to recognize<br />
the assistance of:<br />
Kit Peak National Observatory<br />
Ohio Spectrographic Service<br />
3M Company<br />
BASF Corporation<br />
Americhem Corporation<br />
Reference Note<br />
This paper was originally presented at the Society<br />
of Plastics Engineers Automotive RETEC in 1987,<br />
and published as the Q-PANEL ® technical bulletin<br />
<strong>Sunlight</strong>, UV and Accelerated <strong>Weathering</strong> in 1994.<br />
The paper was revised in 2007 and rereleased as<br />
<strong>Sunlight</strong>, <strong>Weathering</strong> and <strong>Light</strong> <strong>Stability</strong> Testing.<br />
9
Appendix 1<br />
Enclosed Carbon Arc (ASTM G153). The use of<br />
the enclosed carbon arc as a solar simulator for<br />
weathering and lightfastness testing goes back<br />
to about 1918. When the light output of this apparatus<br />
is compared to sunlight, some limitations<br />
become evident. Figure 19 shows the UV SPD<br />
of summer sunlight (Solar Maximum) compared<br />
to the enclosed carbon arc. The UV output of the<br />
enclosed carbon arc primarily consists of two very<br />
large spikes of energy, with a very small amount of<br />
output below 350 nm. Figure 20 shows the same<br />
SPD comparison graphed on a different vertical<br />
scale to include all of the output from the spikes.<br />
Because it is deficient in the short wave portion of<br />
the spectrum, the enclosed carbon arc gives very<br />
slow tests on most materials, and poor correlation<br />
on materials sensitive to short wavelength UV.<br />
Sunshine Carbon Arc (ISO 4892-4, ASTM G152).<br />
The introduction of the sunshine carbon arc (also<br />
sometimes called an "open flame" carbon arc) in<br />
1933 was an advance over the enclosed carbon<br />
arc. Figure 21 shows the UV SPD of the sunshine<br />
carbon arc (with Corex D filters). While the match<br />
with sunlight is superior to the enclosed carbon<br />
arc, there is still a very large spike of energy, much<br />
greater than sunlight, at about 390 nm.<br />
A more serious problem with the spectrum of the<br />
sunshine carbon arc is found in the short wavelengths.<br />
To illustrate this, a change of scale is<br />
necessary to expand the low end of the graph.<br />
Figure 22 shows Solar Maximum compared to the<br />
sunshine carbon arc between 260 nm and 320<br />
nm. The carbon arc emits a great deal of energy<br />
in the UV-C portion of the spectrum, well below<br />
the normal solar cut-off point of 295 nm. Radiation<br />
of this type is realistic for outer space, but is<br />
never found at the earth's surface. These short<br />
wavelengths can cause unrealistic degradation<br />
when compared to natural exposures.<br />
1.2<br />
1.0<br />
Enclosed<br />
Carbon Arc<br />
5<br />
Irradiance (W/m 2 /nm)<br />
0.8<br />
0.6<br />
0.4<br />
0.2<br />
<strong>Sunlight</strong><br />
Irradiance (W/m 2 /nm)<br />
4<br />
3<br />
2<br />
Sunchine Carbon Arc<br />
0.0<br />
260 280 300 320 340 360 380 400<br />
Wavelength (nm)<br />
12.0<br />
Figure 19- Enclosed Carbon Arc and <strong>Sunlight</strong><br />
1<br />
<strong>Sunlight</strong><br />
0<br />
260 280 300 320 340 360 380 400<br />
Wavelength (nm)<br />
Figure 21- Sunshine Carbon Arc and <strong>Sunlight</strong><br />
Irradiance (W/m 2 /nm)<br />
10.0<br />
8.0<br />
6.0<br />
4.0<br />
2.0<br />
<strong>Sunlight</strong><br />
Enclosed<br />
Carbon Arc<br />
0.0<br />
260 280 300 320 340 360 380 400<br />
Wavelength (nm)<br />
Irradiance (W/m 2 /nm)<br />
0.3<br />
0.2<br />
0.1<br />
Sunchine Carbon Arc<br />
Figure 20- Enclosed Carbon Arc and <strong>Sunlight</strong><br />
<strong>Sunlight</strong><br />
0.0<br />
260 280 300 320<br />
Wavelength (nm)<br />
Figure 22- Sunshine Carbon Arc and <strong>Sunlight</strong><br />
10
Appendix 2<br />
Experimental. A spectroradiometer was used<br />
to measure the spectral irradiance received by<br />
test samples exposed to sunlight or accelerated<br />
testers. Irradiance is the rate at which light energy<br />
falls on a unit area of surface. Spectral irradiance<br />
is the distribution of irradiance, with respect to<br />
wavelength. In this case, the irradiance was measured<br />
at each 1 nm wavelength band throughout<br />
the wavelength region of interest. The resulting<br />
Spectral Power Distribution (SPD) curves were<br />
plotted as graphs of irradiance versus wavelength.<br />
Measurements of sunlight were taken at solar<br />
noon with the sensor kept at normal incidence<br />
to the sun with a solar tracking equatorial drive<br />
system. The sensor viewed the entire sky, so that<br />
complete global sunlight was measured. Measurements<br />
of the accelerated light sources were<br />
taken with the sensor in the same position as an<br />
ordinary test sample, so that the irradiance measured<br />
would be the same as the sample receives.<br />
All of the measurements were taken with the<br />
same instrument to ensure that the various SPD<br />
curves would be strictly comparable. Attempting<br />
to compare SPD curves generated by different<br />
spectroradiometers is a frequent source of error<br />
in this field, due to different types of input optics,<br />
different wavelength bandpasses, or simply limitations<br />
in the state of the art in spectral irradiance<br />
calibrations of diffuse light sources, such as the<br />
sky or fluorescent lights.<br />
The instrument, shown in the figure nearby, was<br />
an International <strong>Light</strong> IL 700 Spectroradiometer,<br />
No. 504, consisting of the following components<br />
shown below:<br />
• Input Optics: IL-2WE Double Wide Eye,<br />
quartz double lens cosine diffuser for wide<br />
viewing angle.<br />
• Monochromator: Kratos GM-200, double<br />
grating monochromator with calibrated 1.0 nm<br />
band pass, stray light less than 1 part per<br />
million.<br />
• Detector: PM 270C Photo-multiplier, with an<br />
S-5 response, operated from an IL 760 power<br />
supply.<br />
• Picoammeter: IL 700A Radiometer.<br />
• Calibration: Microwatts per square centimeter<br />
per nanometer, traceable to the<br />
National Bureau of Standards. Calibration<br />
Certificate: 404045901.<br />
Figure 23- Spectroradiometer Schematic<br />
11
Q-<strong>Lab</strong> Corporation<br />
Q-<strong>Lab</strong> Headquarters<br />
Westlake, OH USA<br />
Tel: +1-440-835-8700<br />
info@q-lab.com<br />
Q-<strong>Lab</strong> Florida<br />
Homestead, FL USA<br />
Tel: +1-305-245-5600<br />
q-lab@q-lab.com<br />
Q-<strong>Lab</strong> Europe, Ltd.<br />
Bolton, England<br />
Tel: +44-1204-861616<br />
info.eu@q-lab.com<br />
Q-<strong>Lab</strong> Arizona<br />
Buckeye, AZ USA<br />
Tel: +1-623-386-5140<br />
q-lab@q-lab.com<br />
www.q-lab.com<br />
Q-<strong>Lab</strong> Deutschland, GmbH<br />
Saarbrücken, Germany<br />
Tel: +49-681-857470<br />
vertrieb@q-lab.com<br />
Q-<strong>Lab</strong> China 中 国 代 表 处<br />
Shanghai, China 中 国 上 海<br />
电 话 : +86-21-5879-7970<br />
info.cn@q-lab.com<br />
LU-0822.3 © 2011 Q-<strong>Lab</strong> Corporation. All Rights Reserved.<br />
Q-<strong>Lab</strong>, the Q-<strong>Lab</strong> logo, QUV, Q-SUN, Q-TRAC and Q-PANEL are registered trademarks of Q-<strong>Lab</strong> Corporation.